Explore a Map of Election Results
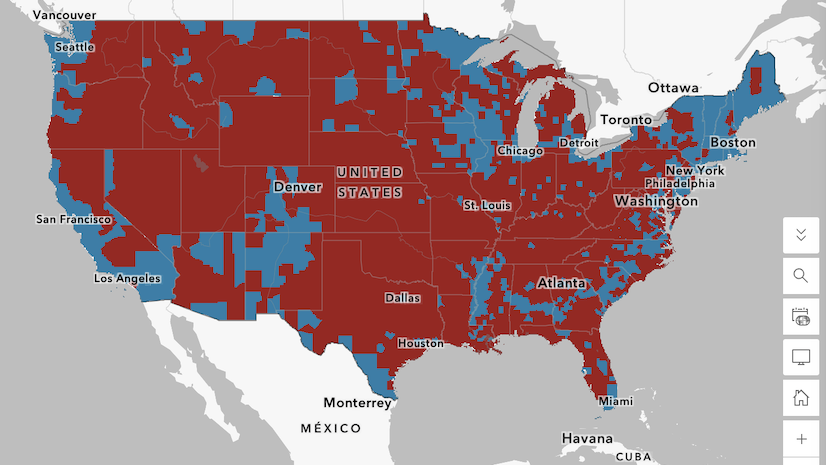
Election maps can show more than who won and who lost. Learn to build your own web map to visualize voting patterns around the US.
Election maps can show more than who won and who lost. Learn to build your own web map to visualize voting patterns around the US.
Officials in New Hanover County are collecting data to improve distribution via pantries and mobile food trucks.
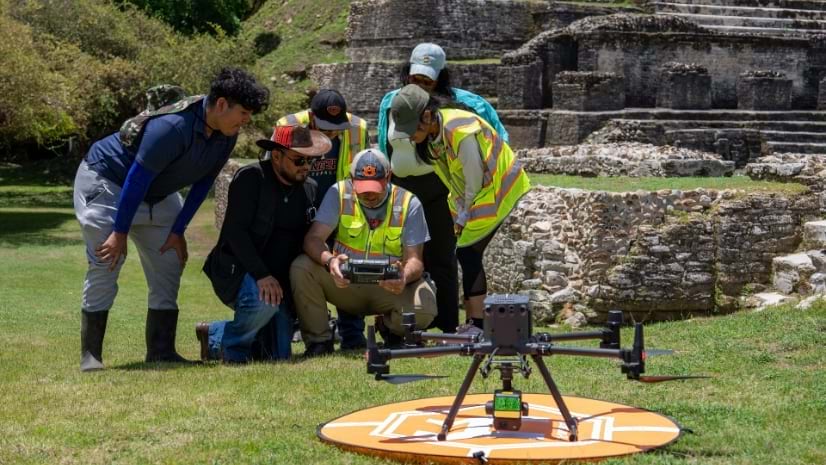
Drones let researchers see places they can’t reach on foot. The new visuals have helped preserve Mayan sites and share them with the world.
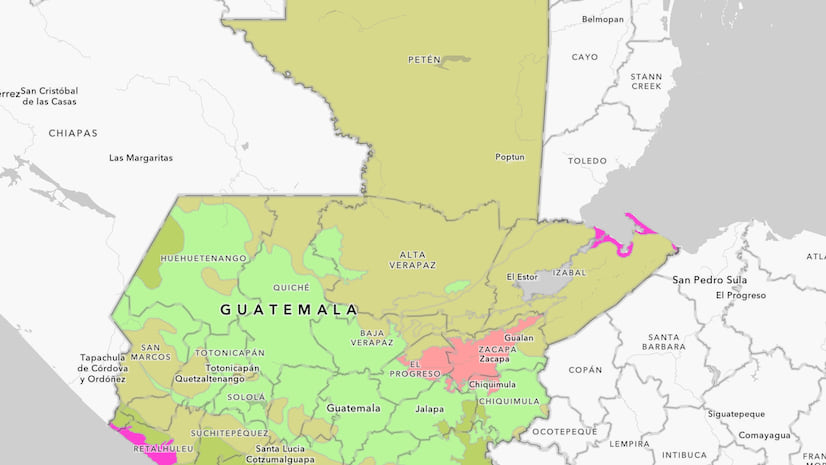
You’re a scientist in search of biodiversity data for Guatemala. Find out how to get data from a global layer and target it to your region.
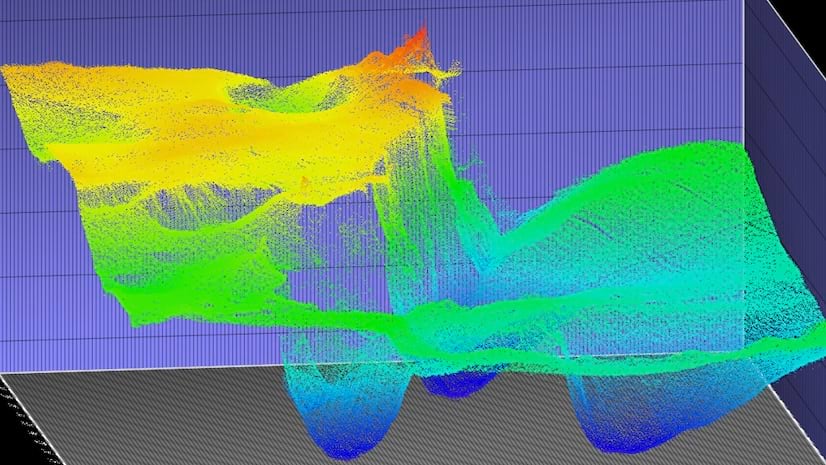
The state pioneers the first combined approach to seafloor mapping, fusing airborne lidar, sonar-equipped boats, and autonomous vessels.
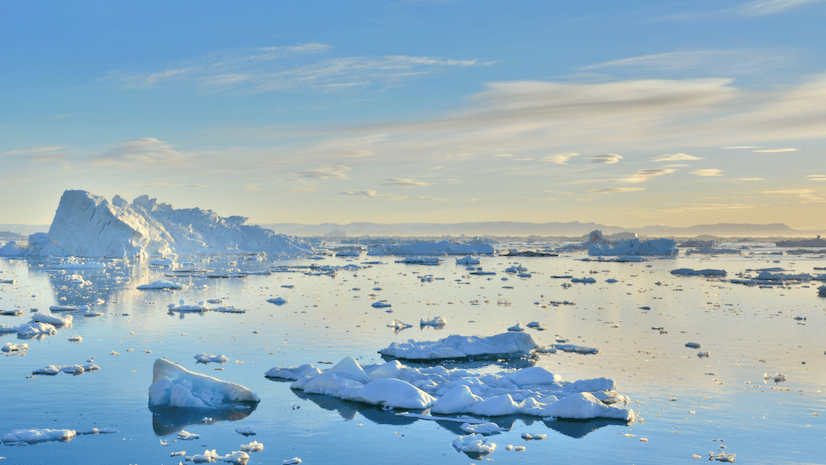
Mapping the underwater topography of remote fjords reveals how glacier dynamics and ocean interactions are impacting warming Arctic waters.
Reach new heights. Learn how to create and add a feature layer to an interactive web map in ArcGIS Online.
Watch this video to learn the three key elements of assembling a well-balanced map layout and how to create your own stunning design.
Watch this in-depth conversation about the role maps play in Ken Burns’s PBS documentary The American Revolution.
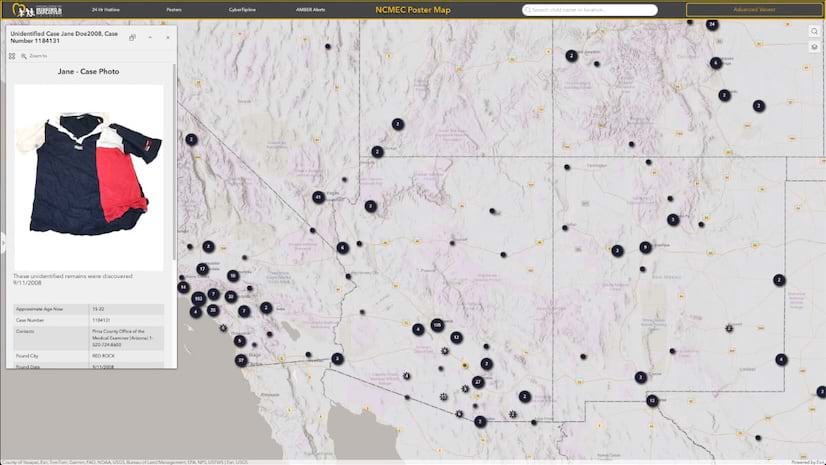
A site that delivers vital data about missing kids in the US lets the public view a map and see the faces of children who have disappeared.
Read a collection of expert-written chapters, case studies, and user stories that show how mapmakers are being inclusive with their designs.
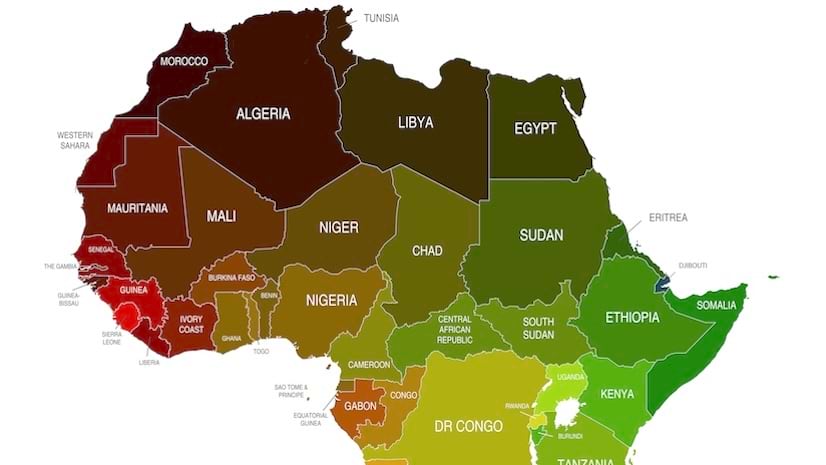
This joint effort is part of a five-year endeavor to produce the most comprehensive basemap of Africa to date.