
December 5, 2019 |
Dr. Dawn Wright | Mapping
September 1, 2020

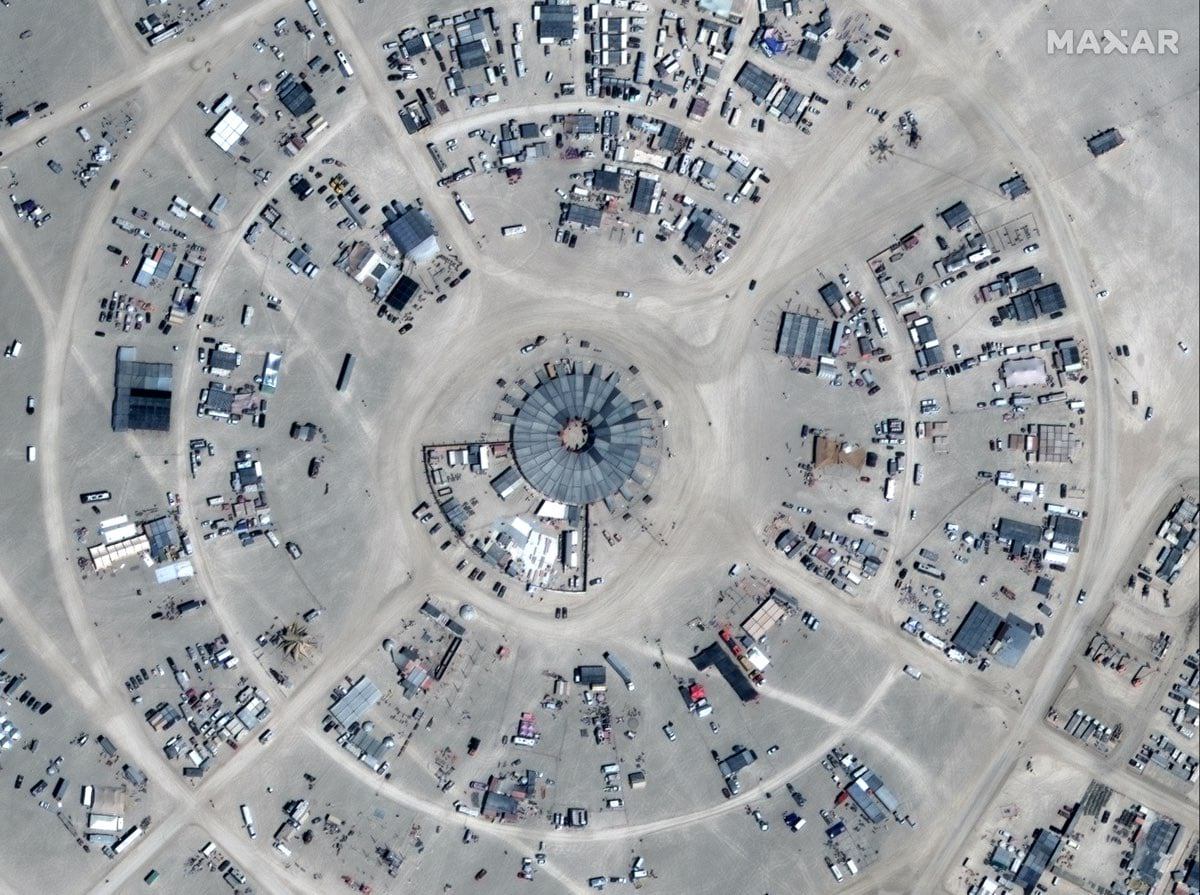
Attracting free-spirited exploration of new age ideas in a temporary city setting, the iconic annual Burning Man festival purports to be a “crucible of creativity . . . dedicated to community, art, self-expression, and self-reliance.” Now, scientific discovery can be added to the list.
The in-person gathering won’t occur this year due to the coronavirus pandemic, but data from a past year’s gathering is proving useful to climate change researchers. The atmospheric effect of the pop-up city created to accommodate more than 70,000 attendees suddenly occupying an otherwise uninhabited space in Nevada’s Black Rock Desert helps scientists understand yet another human impact on climate.
“Normally when we study the microclimate of cities, it is difficult to assess what the landscape would be like if the city were not there, or if the city was significantly different,” said Andrew Oliphant, a micrometeorologist and chair of the Department of Geography & Environment at San Francisco State University. “Black Rock City gave us the opportunity to do that analysis.”

Evolving from annual bonfire gatherings on San Francisco’s Baker Beach in the 1980s, Burning Man moved in 1990 to the Black Rock Desert of Nevada for more space. At its start, the festival took place in June for the summer solstice. Now, it marks the end of summer.
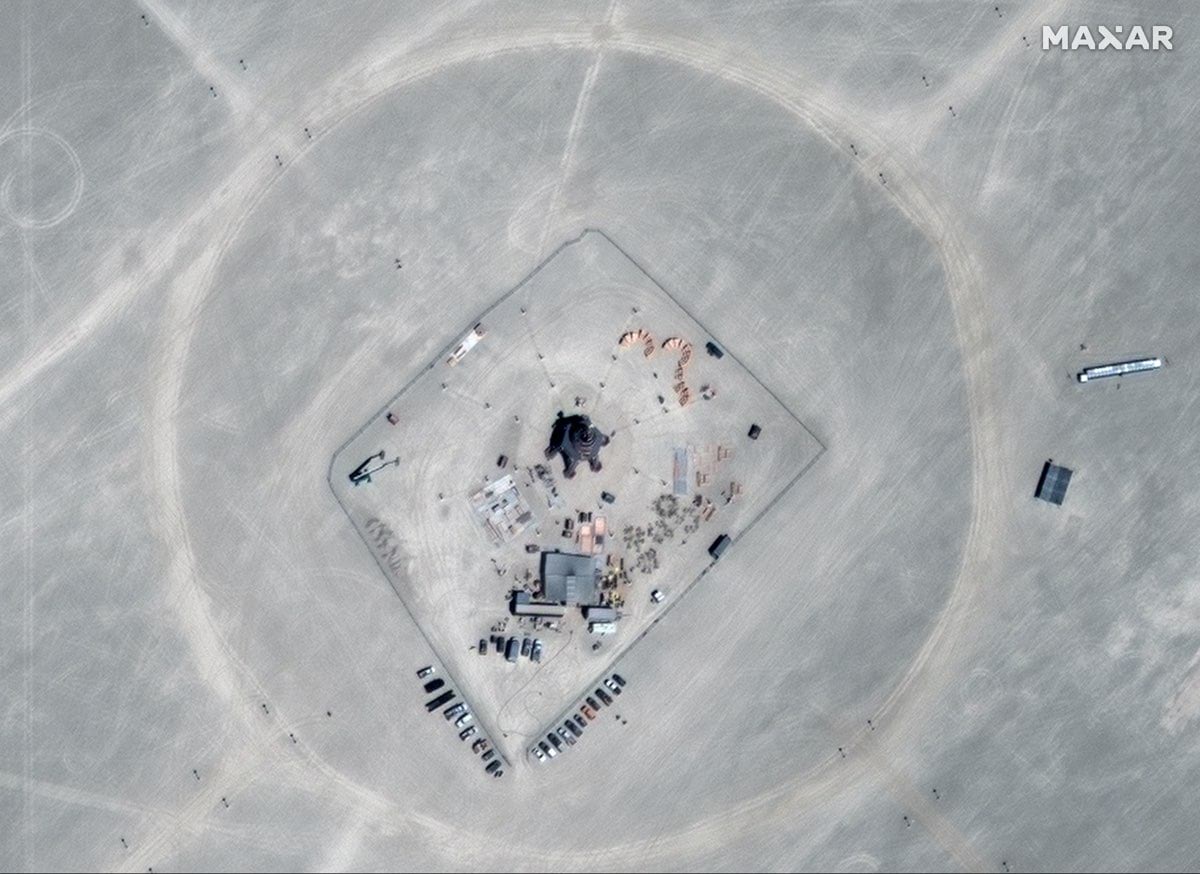
Attendees set up a temporary metropolis, Black Rock City (BRC), to participate in community and civic life and connect with nature. The site’s flat, arid, vegetation-free playa also proved perfect for climate research.
“The frictional properties of the surface are extremely small prior to the construction of the city, and there are no sources or sinks of carbon dioxide (CO2) from vegetation, no transpiration, and very little evaporation from the dry lakebed sediment,” Oliphant said.
With so little impact to the atmosphere before people arrive, Oliphant and his research team could accurately measure the impacts of human activity. They investigated the changing micrometeorological impact of BRC by measuring surface energy and CO2 emissions. They measured surface roughness using wind speed profiles and three-dimensional sonic anemometers. Then, they modeled the roughness in a geographic information system (GIS).
“Wind speed profiles were used to determine the changing surface roughness and validate the GIS modeling,” Oliphant said. “The surface energy balance was measured to determine the impacts of the built city on surface heat fluxes, and temperature measurements were made to determine the urban heat island status. Surface-atmosphere CO2 fluxes were measured to determine urban carbon emissions.”

For this project, Oliphant and his research team used the 30-meter-tall mobile micrometeorological tower called the California State University-Mobile Atmospheric Profiling System (CSU-MAPS). The tower is equipped with wind speed, temperature, and radiation sensors. It also has an eddy covariance system that uses a high-frequency gas analyzer and a three-dimensional sonic anemometer to determine fluxes of CO2, water vapor, and heat on the surface and in the atmosphere.
The tower went up prior to the start of the 2013 festival, and the team made measurements throughout the event. A smaller, similarly equipped tower was deployed outside of the city in the open playa to provide baseline measurements. Researchers took turns riding an instrumented bicycle around the area to regularly measure temperature profiles.

The team took measurements for 12 days—before people arrived, during construction and throughout the event, and after the event concluded. The Burning Man organization provided data about attendees, including a census report detailing population changes, as well as transportation and energy consumption surveys.
“We determined that wind speed was reduced after the construction of the city, particularly below five meters,” Oliphant said. “However, surface radiation and energy fluxes were little changed after the development of the city.”
The team did not detect a heat island effect, which normally takes place in cities because surfaces such as concrete and asphalt capture the sun’s heat during the day and release it at night. Because there were no such surfaces to absorb the sun’s heat in BRC, there was no subsequent additional release of heat at night.

Interestingly, the amount of carbon dioxide from the breath of attendees far exceeded emissions from transportation, which won’t be true of any other city. However, these findings will help inform environmental impact assessments for other geographies and gatherings.
Because BRC’s urban design and building elements are similar to those found in other informal settlements—such as refugee camps, shanty towns, or favelas—the finding can support research in those areas. Oliphant said, “Our results will help refine weather forecast models and air pollution transport models applied to these temporary urban environments.”
Learn how GIS keeps track of weather and climate to inform forecasts, preparedness and adaptation.