September 15, 2017 |
September 26, 2017
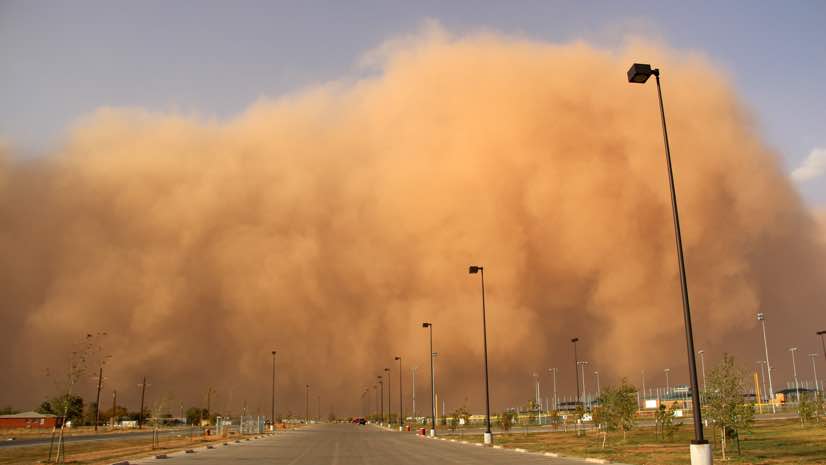
For those who live in the Southwest, scientists are seeing an arresting rise in a rare fungal lung infection and its impact to human health has grown dramatically. Microscopic fungal spores called coccidioidomycosis attach to soil particles that can become airborne when wind whips up or the soil is disturbed. People who breathe this dust are susceptible to an infection called Valley fever with flu-like symptoms—fever, cough, chills, fatigue, joint aches—that weaken the immune system and can lead to pneumonia in severe cases.
From 2000 to 2011, epidemiological data shows that the infection rate of Valley fever increased more than 800 percent. The Centers for Disease Control and Prevention (CDC) reported that Southwestern states had significantly high numbers of cases. People who live or work in areas where the dirt is disturbed, such as farms or construction sites, are most susceptible. However, there hasn’t been a corresponding increase in farming or construction sites.
Why have Valley fever cases increased so much?
The Arizona Department of Public Health wanted answers and the National Oceanic and Atmospheric Administration (NOAA) set out to find them.

Binding disciplines
Scientists speculated that the upsurge in cases was related to ocean temperatures rising. That seems a huge leap in logic, especially since Arizona, which saw the greatest spike, is landlocked. But by looking at the bigger picture through the lens of spatial analysis, the causal relationship can often be revealed.
In this case, the bigger picture is painted by data from five scientific disciplines:
Geography is the canvas that ties these disciplines together because everything happens someplace. Maps, the language of geography, show the relationships, patterns, and impacts everything has on everything else. Spatial analysis is a method for measuring and weighing different data and determining the strength of those relationships.
Geographic information system (GIS) technology provides the means to aggregate spatial information and perform spatial analysis. With these tools, the researchers have the means to query the data from different disciplines through the shared attribute of location. They can also communicate their scientific knowledge about changes that have occurred, exposing the root cause of Valley fever increases.
Sleuthing scientists
Scientists at NOAA developed a rigorous approach using the lynchpin of geography to tie the data from the different sciences together. Combining spatial analysis and statistical modeling approaches, the researchers tested their theory that the ocean was involved.
“When we saw this dramatic increase in dust storms and the drying of soils, we started looking to the ocean for answers,” said Julian Wang, a NOAA climate scientist.
Scientists noted that most infections were reported in areas where increased dust activity has been detected. Sensors, satellites, and soil tests collect palynological data that researchers used to measure dust particles. By tracking dust data, they charted trends in dust storm activity over time and space.
To examine Southwest dust trends, researchers created models for analyzing dust storms by place and time. They found that in the Southwest in the 1990s, there were approximately 20 dust storms per year, but in the 2000s, there was an average of 48 storms per year. They also noted that dust storms have become more frequent in all seasons except summer when vegetation cover keeps soil moisture higher. Furthermore, the dust season had become longer over time.
 rise between the 1990s and the 2000s")
Pinpointing the cause
Why are dust storms on the rise? Climatology data analyses indicate that sea surface temperatures in the North Pacific were warmer during the 2000s than during the 1990s. Also, colder waters off the California coast affected wind patterns. The effect is that cooler and drier northerly winds from the North Pacific are blowing across the southwestern US and drying out the soil. The wind pattern also blocks warmer, moister winds from the tropical Pacific from reaching shore.
To determine the strength of the correlations among dust storms, Valley fever, and high-population centers, the scientists also used sophisticated statistical models to verify connections. They validated their assumptions that specific types of climate variables were correlated to the rise in dust storms and that dust storms were related to cases of Valley fever in high-population areas.
“Over time, analyzing the data will help us better predict dust storm patterns and answer the question of whether increased dust storms are a natural variation or could precipitate a larger shift in the area to desert,” said Daniel Tong, a scientist at NOAA’s Air Resources Laboratory and George Mason University.
By forecasting dust storms and their severity, meteorologists can forewarn the public to stay inside. Dust storms not only carry the fungus that cause Valley fever, but also cause severe damage to aircraft engines, disrupt land transportation, and erode and damage farms already hit by drought. Realizing that dust storms are increasing, businesses and communities can plan responsive actions. Hopefully, the number of cases of Valley fever will decline.
Dig deeper into the science behind this investigation on the NOAA website. Learn more about spatial analysis techniques with scenario-based case studies.

September 15, 2017 |

August 28, 2017 |
September 21, 2017 |