October 24, 2023 |
Lain Graham | Mapping
Three stone maps survive from three separate continents, carved by cultures that never met. Each map uses circles for places, branching lines for water, and shaped relief for rising land. It is the same visual grammar, arrived at independently, thousands of miles and hundreds of years apart.
The impulse to compress a landscape onto a single surface, it turns out, is not a cultural invention. It is a human one. And what began as a tool of survival and power has become the most democratic technology on Earth—once the privilege of rulers, now updated by the second and carried by anyone.
Around 2,000 years ago, a San artist crouched over a flat rock in the Namibian desert and began to chip out a map. Circles with dots for the wells that never ran dry. Plain circles for the ones that filled only in the wet season. Curving lines tracing the routes animals walked between them. Anyone who could read it would know how to navigate dozens of miles of desert without walking a step of it first.
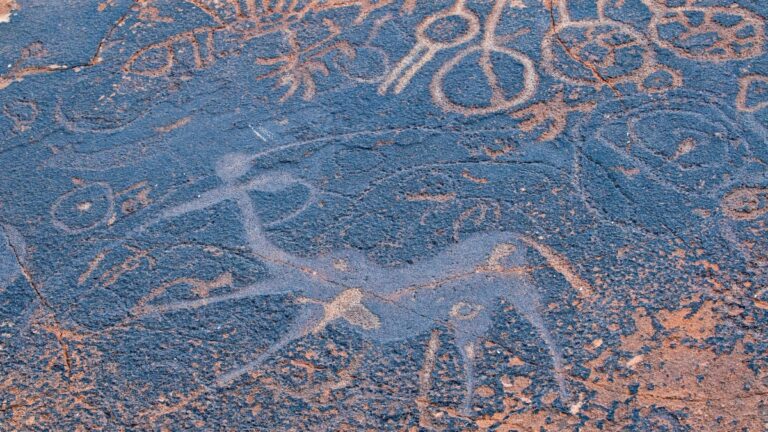
That rock still exists. It sits at Twyfelfontein in Namibia, a UNESCO World Heritage site. One of the oldest maps on Earth, it’s a guide through one of the harshest landscapes on the planet.
Half a world away and two millennia later, a very different map was made for a single powerful hand. In 1900, an archaeologist named Paul du Châtellier pulled a massive slab of schist from a Bronze Age burial mound in Brittany. It was engraved with circles, lines, cupules, and geometric forms he couldn’t quite explain. He noted it, moved on, and the slab disappeared into museum storage outside Paris.
In 2014, researchers Clément Nicolas and Yvan Pailler returned to it with photogrammetry techniques and 3D scanning. The sinuous lines carved across its surface matched, at 80 percent statistical accuracy, the river network of the surrounding region—the Odet, the Aulne, the Isole. A portion of the slab had been physically shaped in low relief to echo the valley’s own topography. The ancient mapmaker likely created the stone from a valley overlook; they could look up from the stone and see exactly what they had carved.
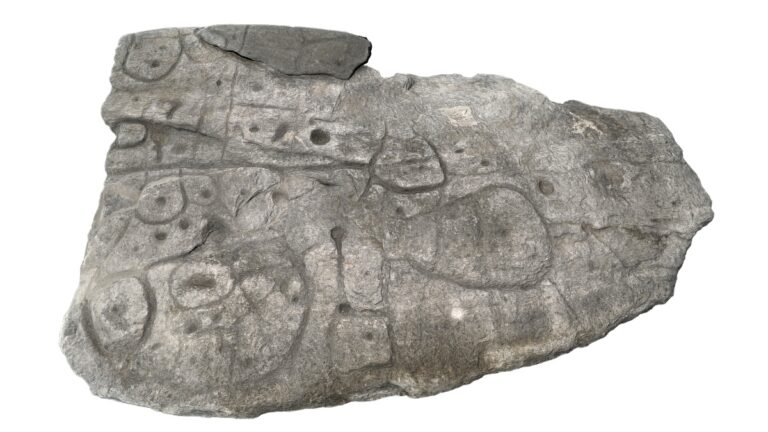
The dalle gravée de Saint-Bélec, dated to roughly 1900 BCE, is Europe’s oldest three-dimensional map—a Bronze Age chieftain’s territory compressed onto a one-ton slab of schist, a declaration of dominion. Around 1700 BCE, when that rule ended, the slab was broken and buried inside a tomb. The map was buried with the power it declared.
In Peru’s Apurímac region, a granite boulder the size of a small room sits on a hillside called Concacha, halfway between Cusco and Abancay. Its upper surface carries more than 200 carved figures—felines, condors, monkeys, pelicans, frogs, lizards, terraces, staircases, channels, ponds. Each animal marks a region: deer for the highlands, jaguars for the jungle, crabs for the coast. The Sayhuite Stone is a map of Tahuantinsuyo, the Inca empire, organized by region, rendered in relief.
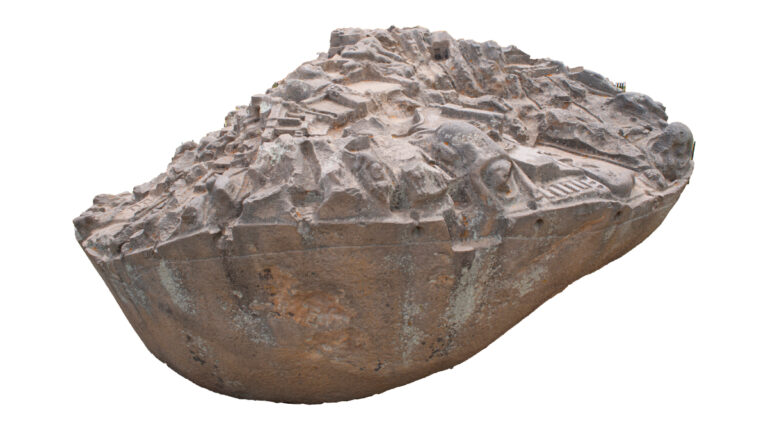
Rain falling into the carved channels animates the map—rivers running, ponds filling in, the whole empire flowing at once. Updated over generations as channels were added and removed, it was a working document that the priests kept current. The Sayhuite Stone wasn’t just a map. It was a simulation, a physical model of the empire that updated as the empire changed.
They built the concept of a digital twin in granite, two thousand years before we had a name for it.
Across all three maps, the symbols are remarkably the same. The makers held the conviction that vast landscapes could be understood on a single surface. The San carved knowledge for the collective, a gift to any stranger crossing the desert. The Breton chieftain carved a claim, collapsing territory into ownership. The Andeans built a simulation precise enough to engineer waterworks. Three maps served three different purposes, but the same visual instinct ran beneath all of them.
And yet all three hit the same limit. The Brittany slab died with its chieftain, buried the moment power shifted because the map and the ruler were one and the same. The San rock still exists, but it cannot tell you which wells are full this season. The Sayhuite Stone could be corrected. If an earthquake reshaped a valley, engineers could chisel the update directly into the granite. But every revision was a permanent act on an immovable boulder, and the map could only ever be as current as the last hand that had worked it.
Stone is permanent but static. Paper made maps portable but froze them at the moment of printing. For most of human history, the problem with maps was simple: the world kept moving and maps couldn’t keep up.
What GIS changes is precisely what the Sayhuite engineers were attempting with water: keeping the map current with the territory. But where the Andeans could manage one empire’s worth of channels, geographic information system (GIS) technology manages the whole planet at once, integrating satellite feeds, sensor networks, drone surveys, and streams of data from people with devices in their pockets.
When a road closes, a river floods, or a structure breaks ground, the map knows before the morning is over. In North Central Texas, where subdivisions of 2,000 homes can appear weekly across the Dallas-Fort Worth metroplex, a 9-1-1 agency flies drones over new construction so dispatchers are never routing first responders to what the map still shows as empty farmland. When catastrophic floods struck Rio Grande do Sul, Brazil, in 2024, a GIS team built dashboards tracking more than 200 road blockages within hours, routing rescuers around washed-out bridges. In Vilnius, Lithuania’s snow-prone capital, the city uses drones and AI to read the footage to assess which streets are clear and which still need crews, clearing a major storm within hours.
The ancient mapmakers had the grammar right but not the medium. Stone gave knowledge permanence at the cost of currency. GIS finally matches the ambition, holding every layer simultaneously, from terrain and infrastructure to climate patterns and population movement, in a way no single slab of rock ever could.
The Sayhuite Stone was a living model of place, kept true by those who understood it. What we build now works the same way, but at a scale and speed no stone could hold, kept true not by permanence but by the network of users that makes the map as up to date as the world it describes.
Learn how mapping in 3D creates deeper understanding, fuels insights with realistic visualizations, and enhances analytics.