
The possibility that these patterns resulted by chance is virtually impossible.
US EPA
Charles Lee
When Charles Lee first explored the topic of environmental justice in the early 1980s, he was in uncharted territory. “The whole notion that there are certain people who are disproportionately affected by environmental harms was something that nobody thought about,” said Lee, currently a senior adviser for environmental justice at the US Environmental Protection Agency (EPA). “It was prevalent, but nobody knew what to call it. It didn’t have a name.”
One reason for the disconnect was that modern environmentalism, which gained force in the 1960s, was mostly committed to issues around wildlife and conservation, with little attention paid to issues of equity and social justice. “People in the environmental movement said, ‘We’re all colorblind,’” Lee said. “That was the dominant ethos.”
At the same time, the modern civil rights movement was focused on racial disparities in education, employment, and economic advancement. And so, as they had throughout the 1970s, the two movements still occupied separate political universes.
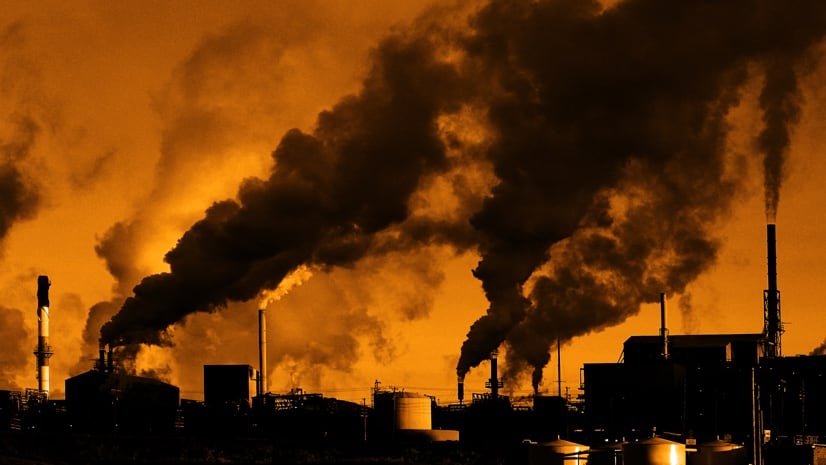
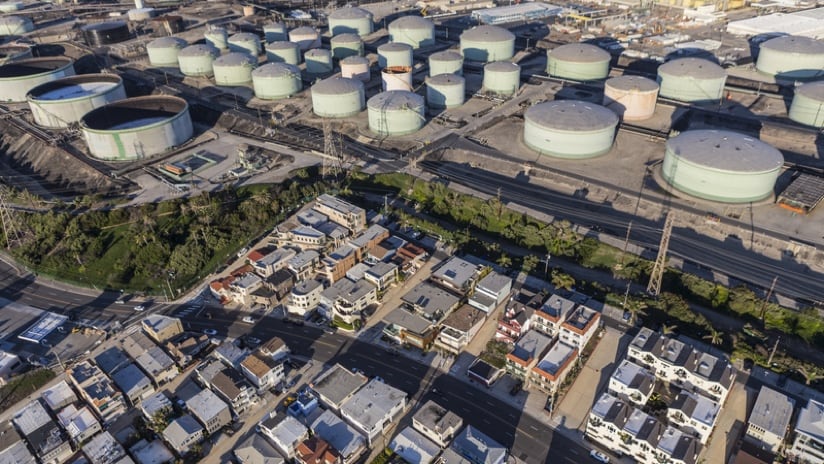
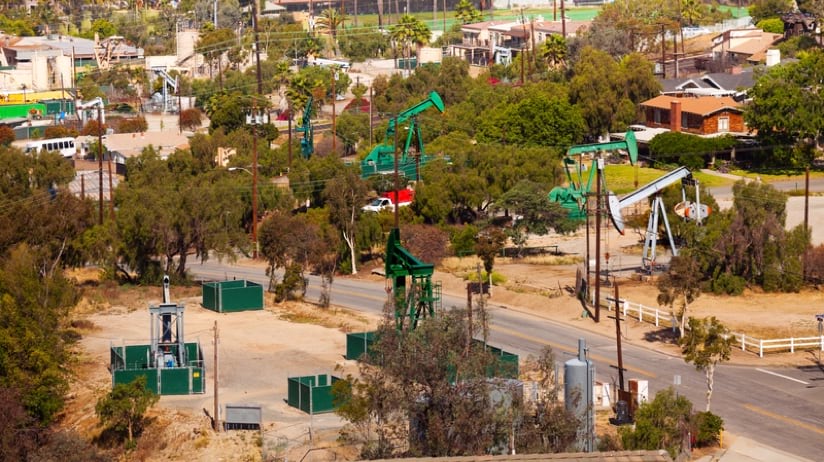
Today, experts have repeatedly established the link between environmental and equity issues. Communities of color disproportionately bear the consequences of excess pollutants and contaminated soil and water, including higher-than-average rates of diseases ranging from asthma to cardiovascular to cancer as well as birth defects and other health disorders. Scientists, policymakers, and activists often bolster the case by using geographic information system (GIS) technology, creating interactive fact-based maps to bring the issue into stark relief.
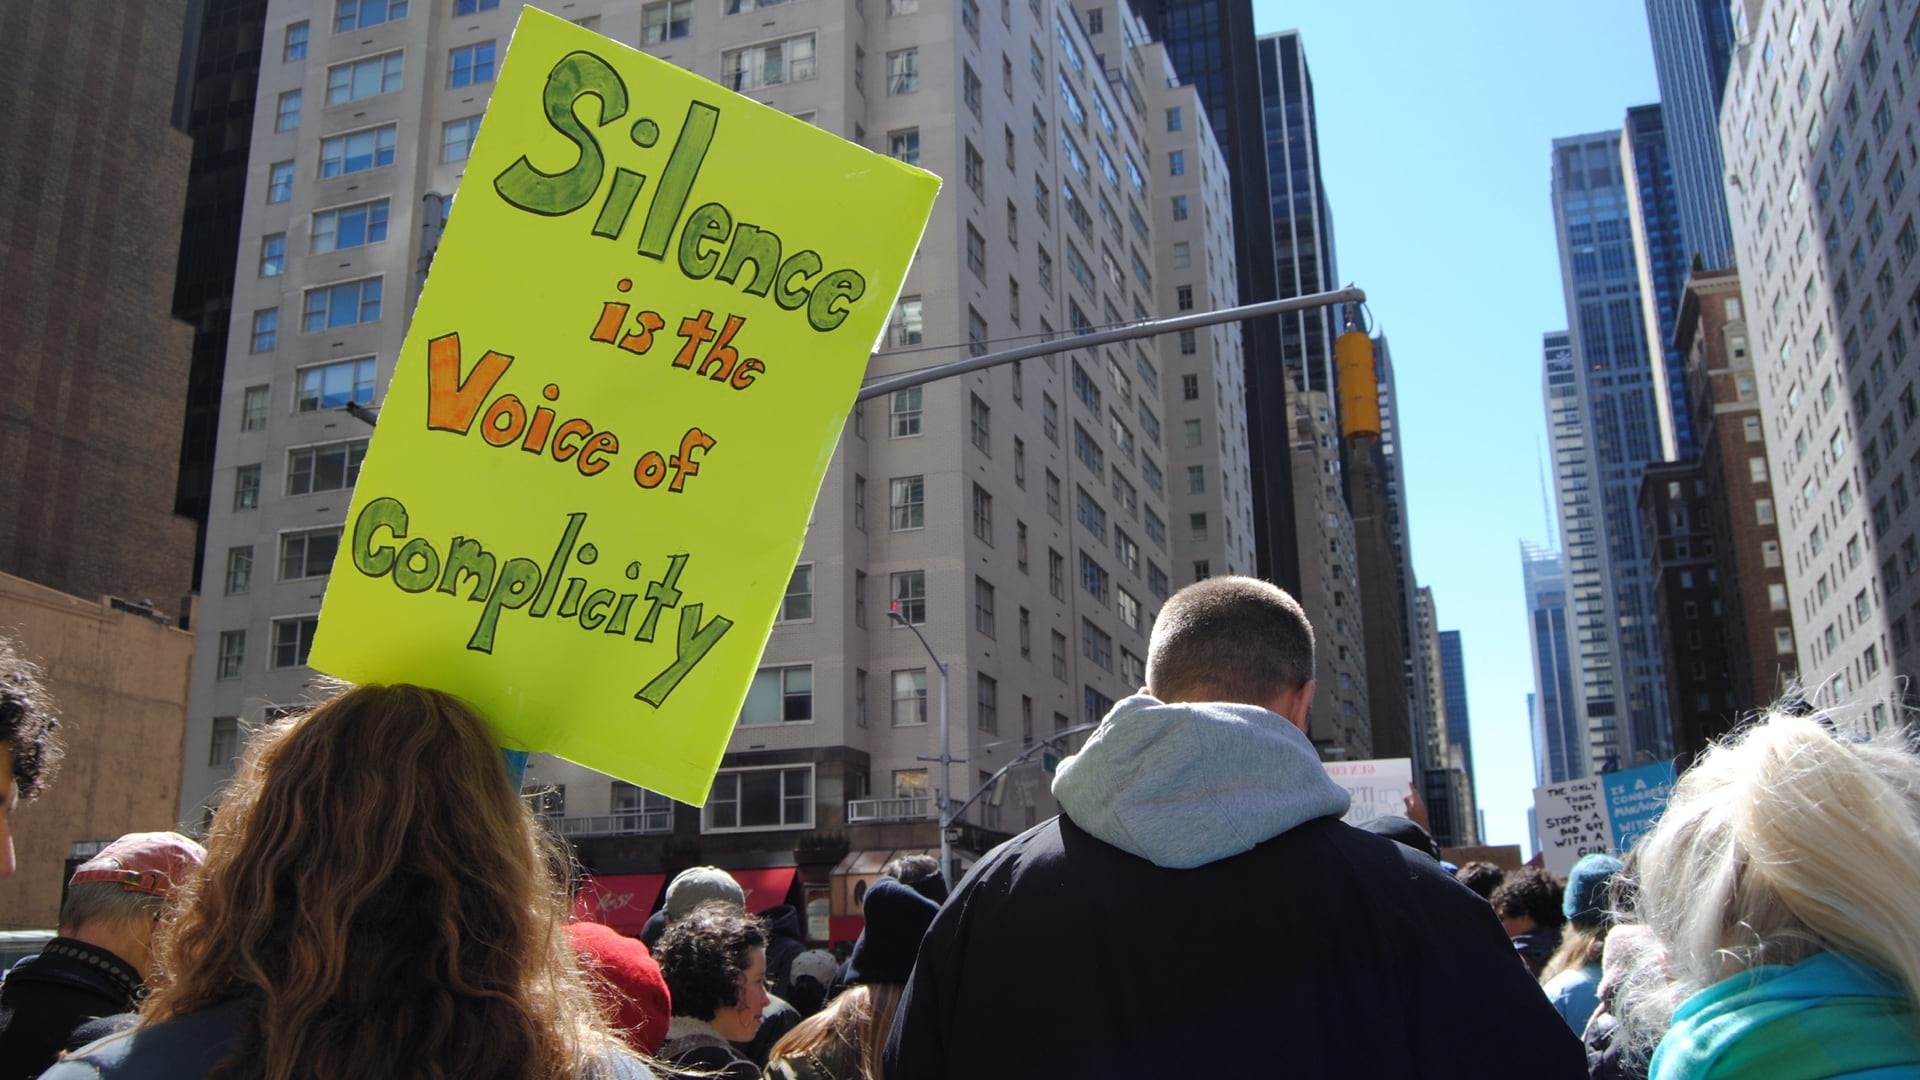
But the struggle continues. Early in 2021, activists in Chicago staged a 28-day hunger strike to protest the proposal to relocate a metal-scrapping facility to the city’s South Side. The industrial process, they pointed out, creates the kind of air particles that cause health problems such as asthma.
The activism in Chicago recalls the seminal moment in the history of environmental justice that galvanized people like Lee. In 1982, protests erupted in Warren County, North Carolina, over a plan, supported by the state’s governor, to dump thousands of tons of contaminated soil in a low-income, predominantly Black neighborhood.
For six weeks, the protests made international news. Although the demonstrations were ultimately unsuccessful in blocking the plan, they represented a critical union of environmentalism and civil rights advocacy, helping create the modern environmental justice movement.
In the aftermath of Warren County, the US Government Accountability Office (GAO) examined the demographics of hazardous-waste sites in the southeastern part of the country. The subsequent study revealed that three out of four sites were in Black-majority counties.
The possibility that these patterns resulted by chance is virtually impossible.
When the study was released, Lee was directing a project on environmental hazards in areas where low-income communities and people of color lived. Lee was working with the United Church of Christ’s Commission for Racial Justice, which had played an active role in the Warren County protests. The GAO study confirmed for him the widespread problem linking disempowered communities and hazardous waste sites.
“I was discovering more examples of how communities of color—from urban areas to reservations to the farm workers—were affected by environmental hazards,” he said. “I realized that if you could replicate the GAO study on a national level, that could really put the issue on the map.”
For the next several years, Lee set out to gather as much data as feasible, using maps to illuminate the racial disparities. The resultant landmark report, Toxic Wastes and Race in the United States, published in 1987, soon became the founding document of the environmental justice movement.
Working from a definition of racism as being “racial prejudice backed by power,” Lee’s team revealed, with extensive empirical evidence, just how much power was at stake. The report quoted an EPA estimate that the total cost of ameliorating the country’s thousands of uncontrolled toxic-waste sites could exceed $100 billion (adjusted for inflation, over one percent of the current US GDP).
Lee’s team found that 3 out of 5 Black and Hispanic Americans lived in communities near these sites, as did 2 million residents of Asian and Pacific island heritage and 700,000 Native American communities. This enormously expensive problem overwhelmingly showed up in the communities least equipped with the political and economic tools to demand a solution.
Lee’s team also discovered a strong correlation between the percentage of people of color in a community and the amount or volume of active hazardous-waste facilities. Race proved to be the most significant factor in predicting the location of the facilities.
“The possibility that these patterns resulted by chance,” Lee wrote, “is virtually impossible.”
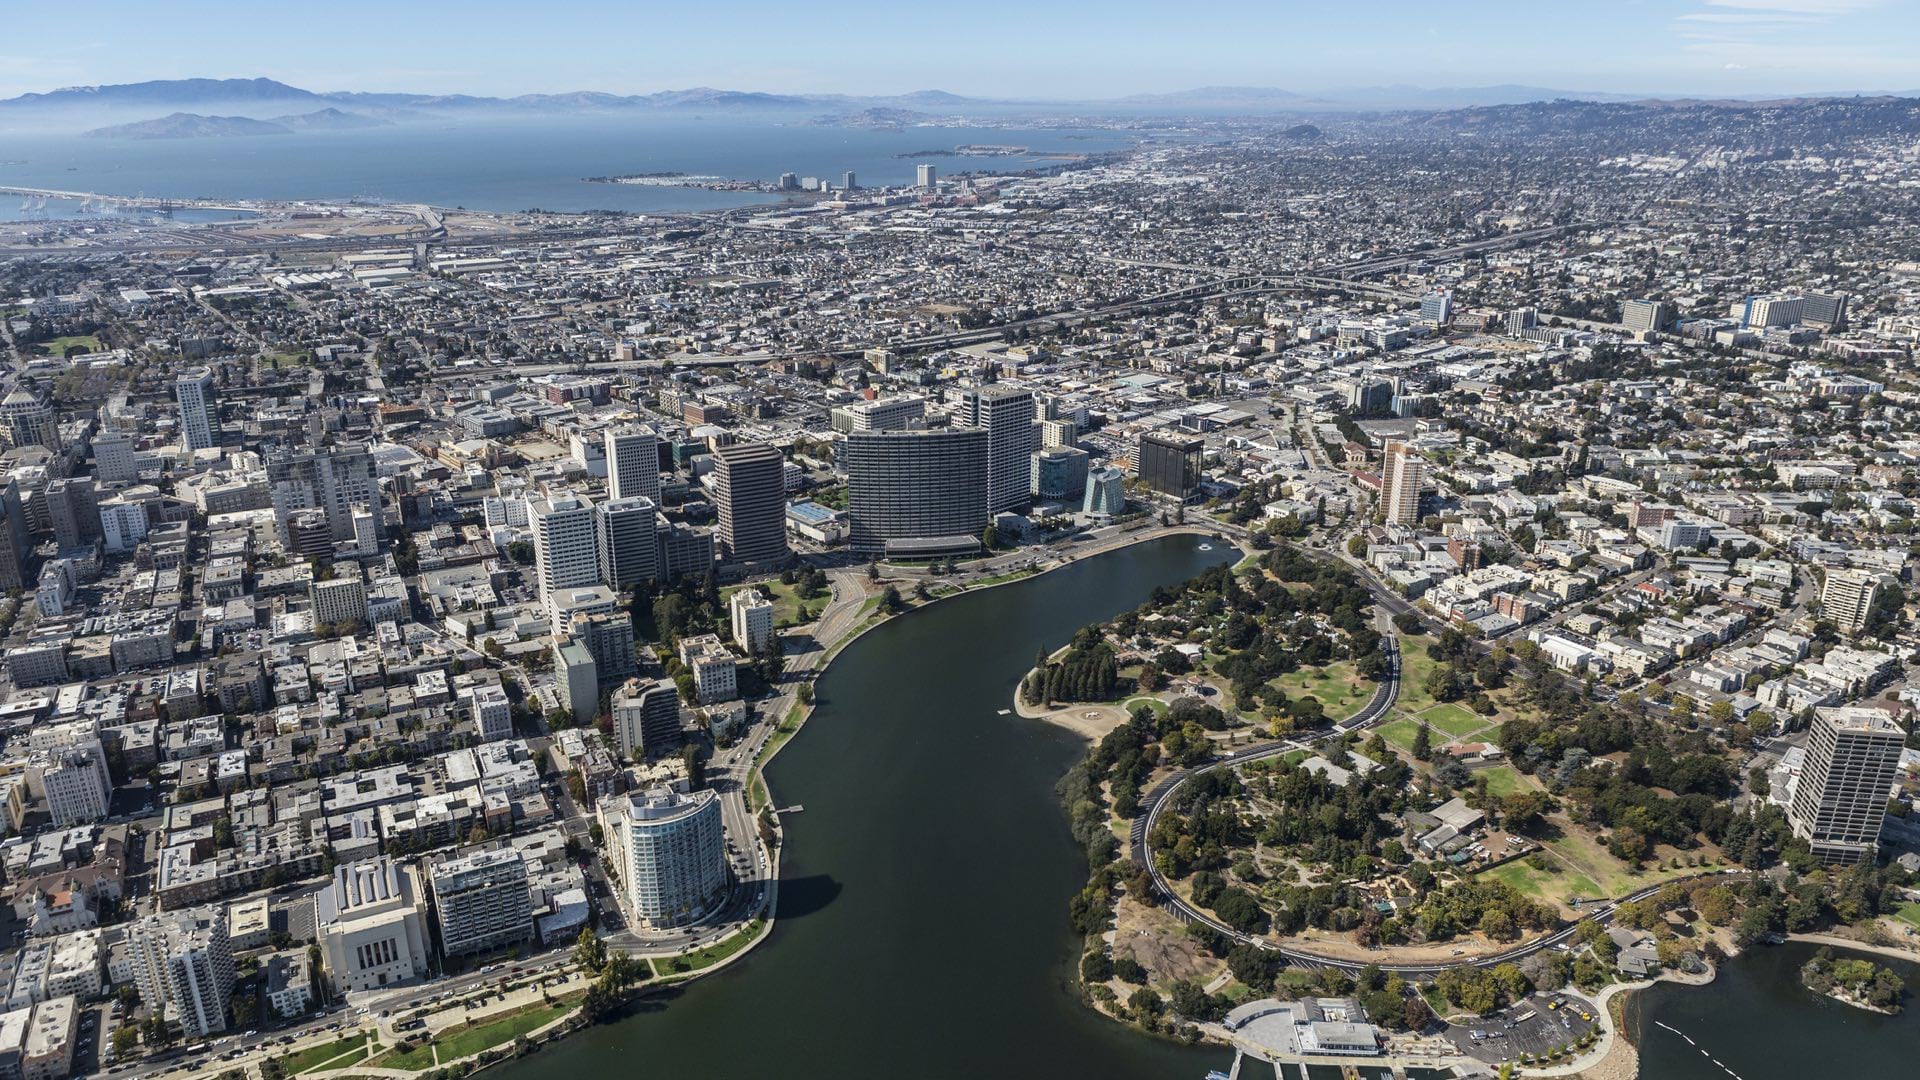
Environmental justice is fundamentally a matter of race and place, making geography fundamental to the solution. Practitioners must examine the connection between communities and their environments—the land people live on and the air they breathe. Maps turned out to be the most potent way to demonstrate these connections.
The rise of the environmental justice movement has coincided with the increase in capabilities and accessibility of GIS software that can process, aggregate, and display these connections on smart maps.
“The maps in Toxic Wastes and Race were all hand drawn,” Lee said. “GIS existed, but it was way beyond our means to get access to it.”
As GIS has become more commonplace, it has also become integral to thousands of environmental justice projects. It helps bolster arguments while also making evidence easier to communicate.
“If you talk to people who do community organizing with [GIS], they say what makes it so powerful is that it puts the issue in front of people as something you can’t contest,” he explained. “It gets people excited about talking about these issues, because it makes it so real.”
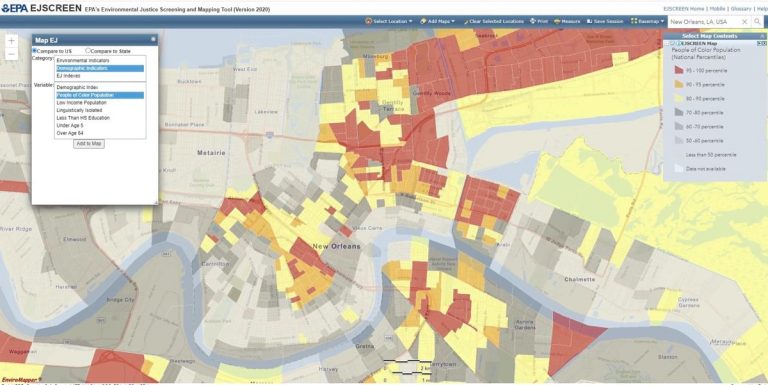
Tai Lung, a geographer who oversees the EPA’s environmental justice mapping and screening tools, agreed. “Being able to put GIS in the hands of people really democratizes the information,” said Lung, whose work was noted in the Justice40 Initiative . “There are communities that have lived in polluted conditions for decades, and they’ve often been ignored. But now they can come back and say ‘Look, we have all this data that we can pull from this really handy tool.’”
Environmental justice experts also found GIS useful as a means of providing a crucial temporal aspect to data, illuminating the historical entrenchment of equity-related problems. Lee pointed to the Mapping Inequalityproject developed by the University of Richmond, Johns Hopkins University, and Virginia Tech University in 2016. The project uses real estate redlining maps from the 1930s and 1940s to show how the neglect of certain neighborhoods is rooted in discriminatory real estate practices.
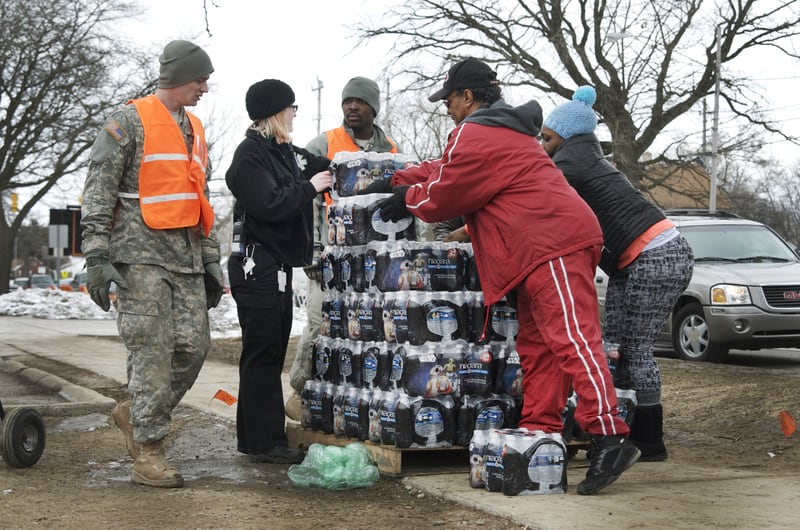
During the pandemic, epidemiologists used GIS to understand the spread of COVID-19, while environmental justice advocates used the technology to communicate related response disparities.
This innovation may ultimately prove to be how GIS can most help the environmental justice movement, by underlining the unnatural aspect of the impact of natural disasters.
“Natural disasters are always going to happen,” Lung said. “But who’s going to be impacted the worst? The people in the low-lying areas of New Orleans will get flooded—not the people in the Garden District. And mapping gives you a way to layer on demographic information and say, ‘This is where the Black folks live.’ You can layer it all together and see direct correlation between all the data.”
Lee echoed Lung’s assertion and underscored how maps continue to support the mission.
“Environmental justice is proving to be an increasingly powerful lens to understand a lot of the critical challenges of the 21st century,” Lee said. “GIS can help shape the conversation in ways that engage people, helping them to identify solutions.”
Visit the Racial Equity GIS Hub to learn more about how GIS users from around the world use the technology to address racial inequities.