What I always tell people is, if we can put a geotag on it, we can put it on a map. If we can put it on a map, we can do analysis on it.
FDA’s Office of Emergency Management
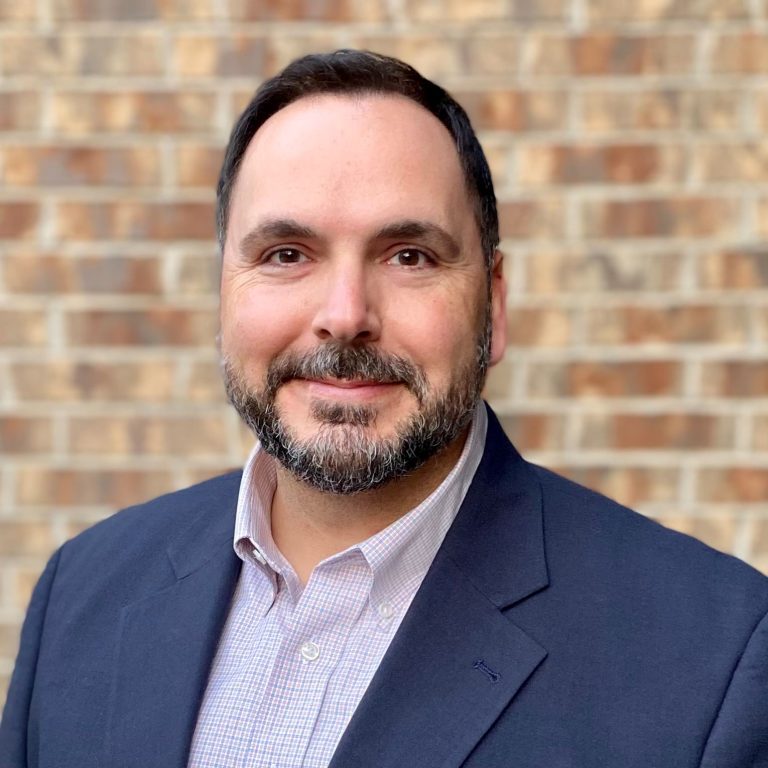
Wayne Gorski
May 7, 2020
A conversation with Wayne Gorski, the director of program operations and coordination at the Food and Drug Administration’s (FDA) Office of Emergency Management, about the increasing role of geospatial technology in tracking the global supply chain to safeguard food and drug safety.

Creating and enforcing safety standards is a core mandate of the US Food and Drug Administration (FDA), but the overall mission is more complex and often FDA teams must work against the clock. When people or animals get sick from food or medicine, the FDA takes immediate action often starting with the problem’s spatial component.
Following a report of tainted products, the FDA Office of Emergency Management works with internal subject matter experts to track the origin, how far it has spread throughout the country, and who needs help. Wayne Gorski and his colleagues use interactive smart maps for this monitoring, modeling and prediction.
As Gorski emphasizes in this discussion, his office also must work backwards to solve these problems. The FDA relies on geographic information systems (GIS) to analyze supply chains—tracing goods, foods, and ingredients to their sources. GIS gives the FDA total situational awareness. During these uncertain times, brought on by global outbreak of novel coronavirus disease 2019 (COVID-19), federal authorities are using this same GIS-based approach to help lessen the impact.
This interview has been edited and condensed.
Aside from its well-known safety mission, the FDA also handles crisis management. How does your agency approach this work?
I’ll start with an example from 2007, when we had a pet food incident. One of the raw ingredients in some brands was spiked with melamine to bring up the protein concentration. The problem was that when animals ingested it, they experienced kidney failure. Thousands of cats and dogs across the country died.
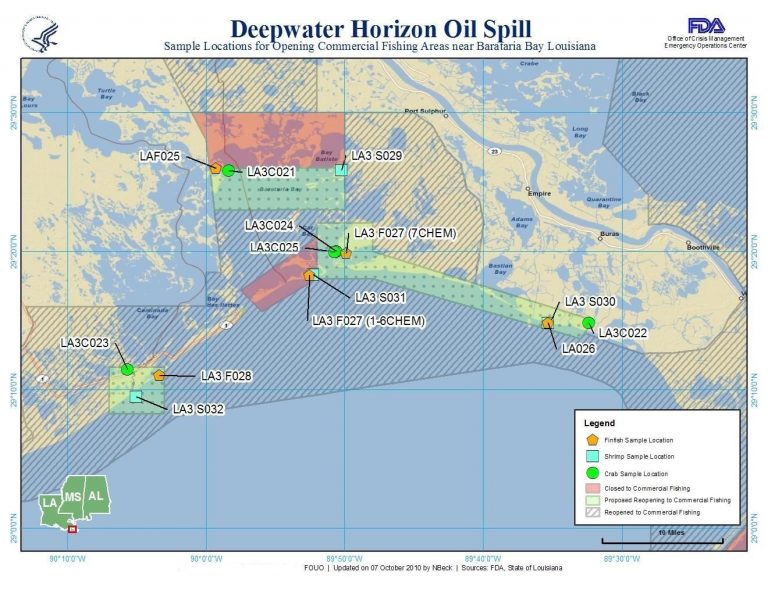
I started mapping out the incident—where the deaths were occurring, and from which brands—and we discovered the value of mapping distribution patterns. When we were inspecting a manufacturer, we would find out where they were shipping their products, and GIS helped us visualize the problem while planning our response.

Literally hundreds of different pet food products were being manufactured by one location in the Midwest. From there, we were able to trace back the ingredient to one supplier in a foreign country, coming through one port in the Pacific Northwest. We could use maps to demonstrate our hypothesis—that this is where the problem was originating from—and we were able to stop it.
After that, we realized there was a lot of value in GIS, and over the years I’ve been able to establish a team of three geographers and a program manager within the Emergency Management Office.
Are there other incidents where GIS helped find the source of contamination?
We once had a salmonella incident with tuna that had gone into sushi. In my opinion, it was one of the scarier situations we’ve faced. It turned out the product was what they call a “tuna scrape.” When tuna was processed in the plant, the pieces that were left after a fish was cut were combined with spices like sriracha, and then frozen.
With a frozen product, there’s an added danger. We thought the outbreak was from tuna, but if we hadn’t been able to identify the actual sources it could’ve sat in a freezer for months before being pulled out—and then, all of a sudden, you’ve got another salmonella spike.
We were able to trace the tuna back to the manufacturing plant in India. We got an investigator out there to do some environmental samples, and we got a positive hit. They had shipped another product to the US, but we were able to stop it at the border and avoid more illnesses.
Your view of the world is probably somewhat different, and perhaps more cautious, than the average person’s.
Yeah, it’s funny. There’s a beer-and-oyster festival in Baltimore I sometimes go to, and my buddies follow me around, because I look closely at the different places the oysters are from. If I decided to get them, so would they. I felt like the beefeater next to the queen. You know, “try this—if you don’t die, I’ll eat it.”
The FDA provides exactly that service for inaugurations, working closely with the Secret Service. And because these are always in Washington, we also work closely with the D.C. Department of Public Health. FDA provides up-to-date training on food safety and things to look for. And then we’ll actually assign FDA staff to be at the venues during the balls. One of the things they do in this situation is they create a “dead man’s plate.” If somebody dies or just gets sick, you have a plate of what was served at the dinner so you can analyze it.
It’s amazing how wide your scope is. In response to emergencies and disasters, what are you looking for?
We want to know the implications these events have for our employees, our facilities, and the industries we regulate. For these industries, we want to know if there are any “downstream” implications. For example, if there will be shortages of a certain product.
How did the use of GIS expand to emergencies?
We started to experiment with risk modeling, taking what might traditionally be considered dissimilar datasets and comparing them. For example, one of my geographers who is very interested in adverse event reporting uses data from a program called MedWatch. It allows anyone—not just physicians—to file a formal notification of an adverse event they’ve had with a medical product. That information goes to both the company and the agency.
The geographer started looking at some of these adverse events and noticed that in certain areas there were other environmental factors that had similar symptoms to adverse drug reactions. For example, the incidents of lead poisoning in water had similar side effects or medical indications as a certain product.
We were watching that product and found that the symptoms we were seeing were nationwide. This incident led the geographer to expand the use of GIS for postmarketing surveillance—because all possible side effects of a drug can’t be anticipated. GIS helps identify adverse effects that don’t appear in the drug approval process.
What I always tell people is, if we can put a geotag on it, we can put it on a map. If we can put it on a map, we can do analysis on it.
How does GIS help you see things that other tools miss?
What I always tell people is, “If we can put a geotag on it, we can put it on a map. If we can put it on a map, we can do analysis on it.” It’s beyond just looking at spreadsheets. Back in the old days, they would have huge trace-back spreadsheets. And after a while, all the numbers, rows, and columns look alike.
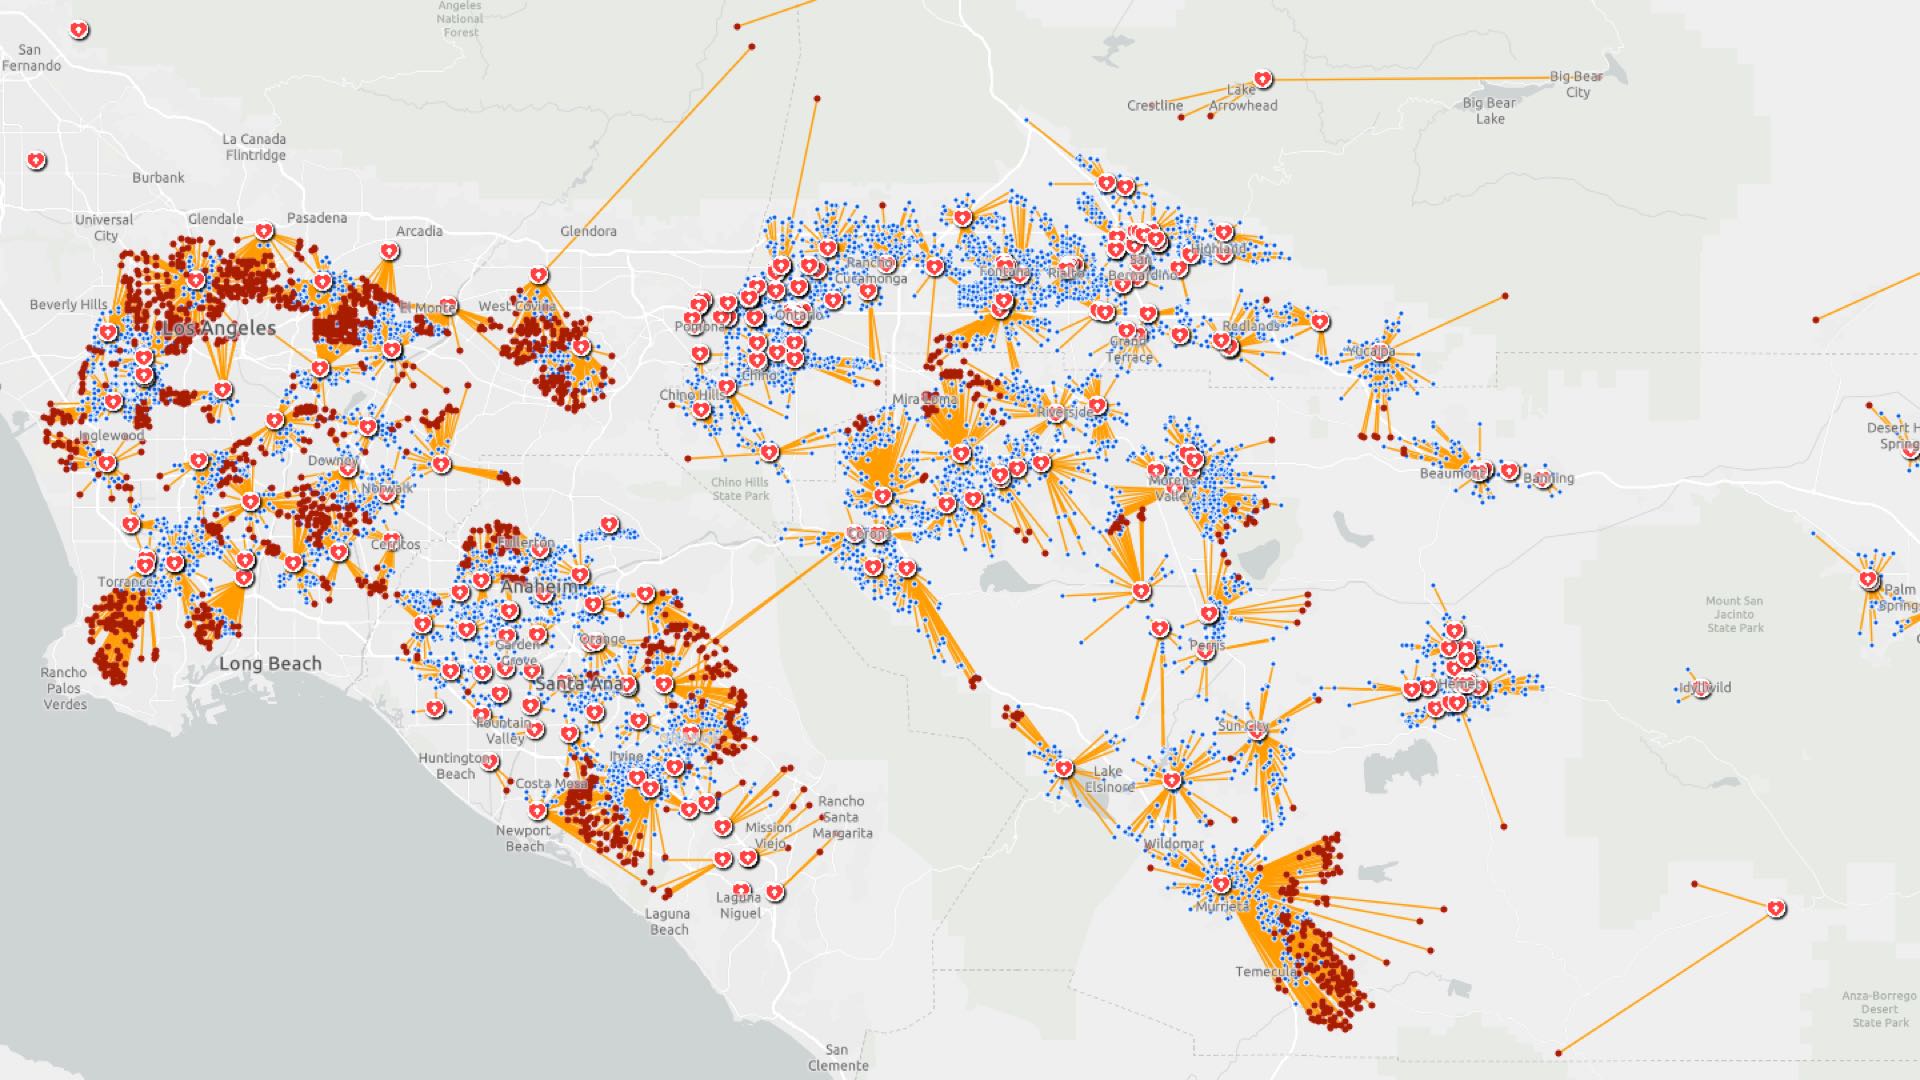
With the salmonella in tuna outbreak, that was a massive spreadsheet. But we were able to take that data and geotag it. And the cool thing about that is that we had the case counts from the Centers for Disease Control and Prevention. We could take those and overlay our data on distribution patterns and manufacturing sites and see the correlation.
That’s how we were able to say, “Wait a minute—that looks like a hotspot.” When we looked at that one specific area, we found out who the manufacturer was, and also who their supplier was.
It seems like one of the trickier parts about globalization is that we have flexible supply chains, but not always a lot of visibility.
Right. Like in the case of melamine and pet food, the manufacturer gets the raw material, they send it to their quality control lab for analysis, and the lab verifies the high protein content. They had no reason to believe it was being spiked.
In our interconnected globalized world, it seems as if you really need a good way to visualize the flow of goods.
Exactly. And our GIS program has grown by leaps and bounds. For example, whenever we can, we use story maps, which are very useful—especially for ongoing situations that are evolving, like wildfire season or hurricane season.
Do you use GIS to help you keep track of FDA staff around the world?
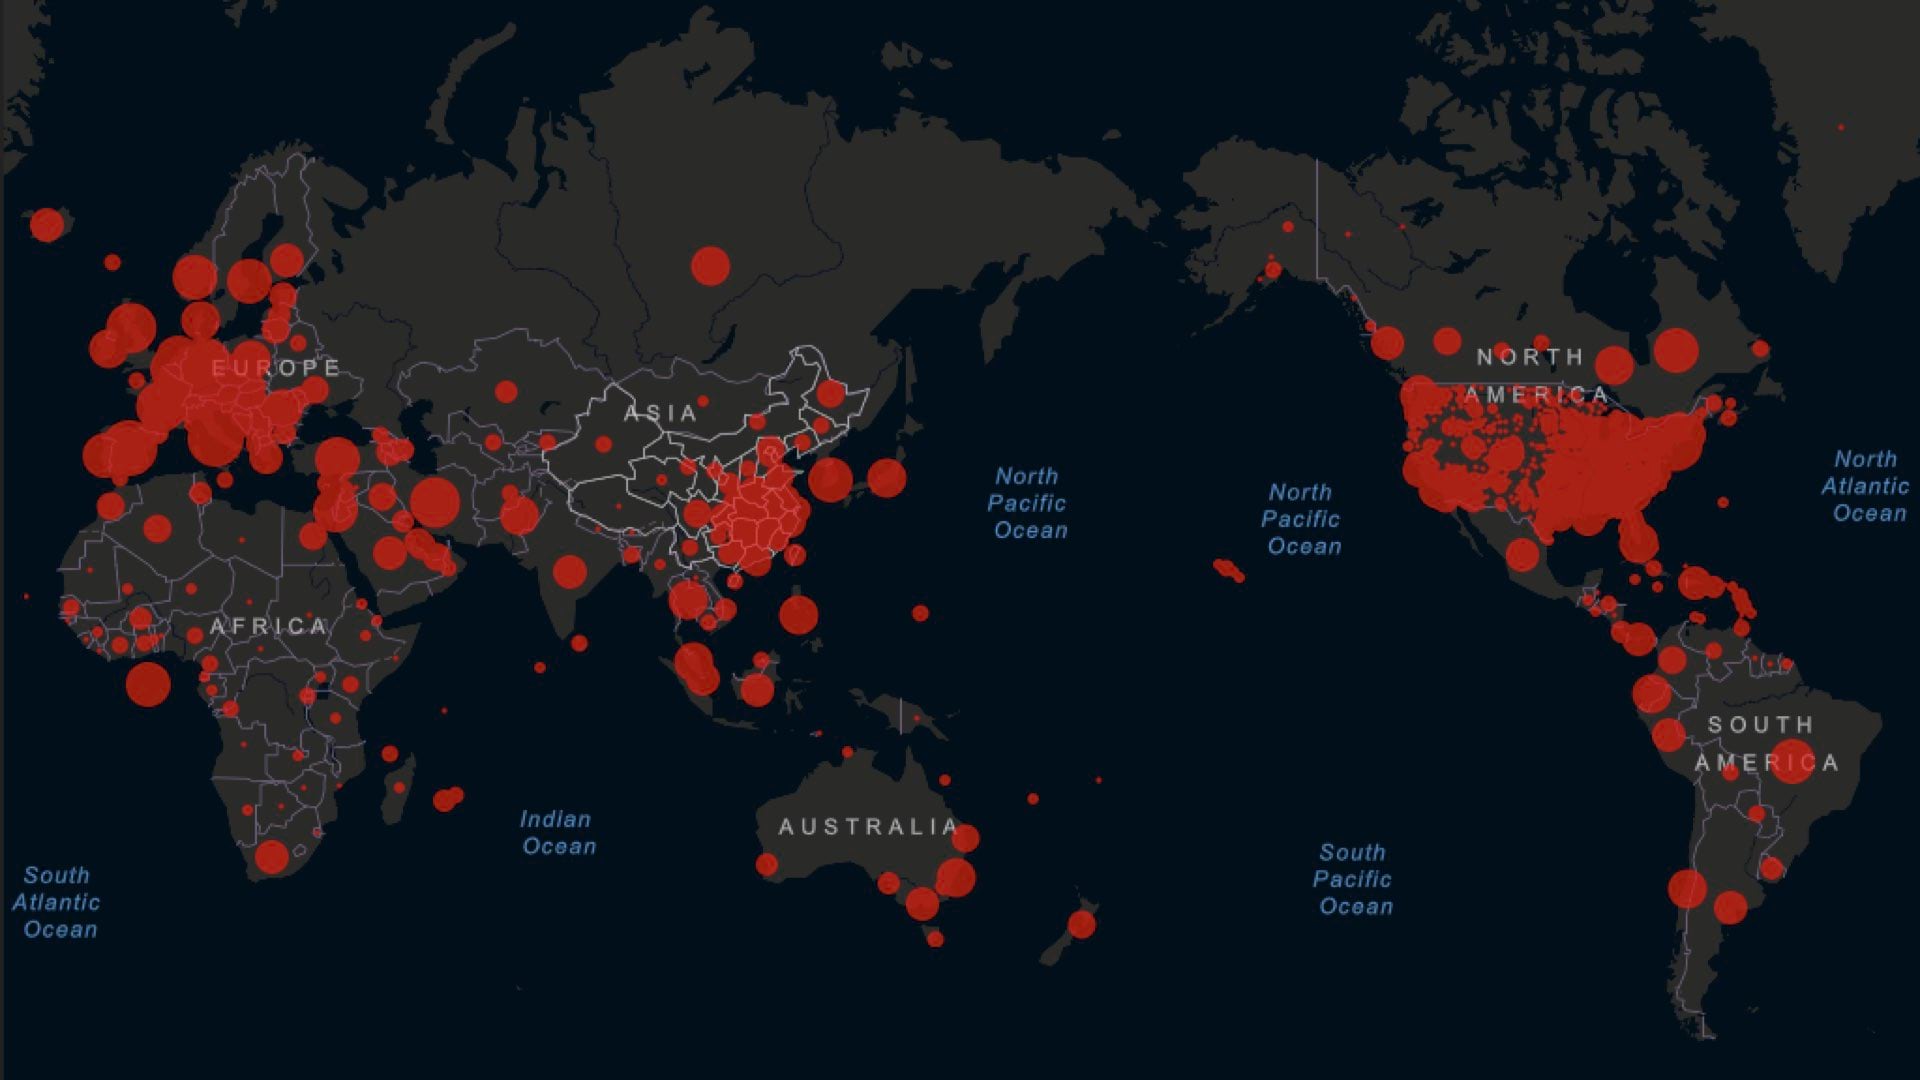
Definitely. As the latest COVID-19 outbreak began to occur we could provide agency leadership with data on where our foreign offices were located and mash it up with WHO data of reported cases. Then they could determine who needed to be recalled back to the States until the threat subsides.

April 7, 2020 | Multiple Authors |
March 17, 2020 | Multiple Authors |
March 31, 2020 |