
June 6, 2023 |
March 12, 2024
In Hurricane Alley, communities have long a history of weathering storms. Cities in the region take a proactive approach to storm preparedness with measures to respond to and recover from severe weather events.
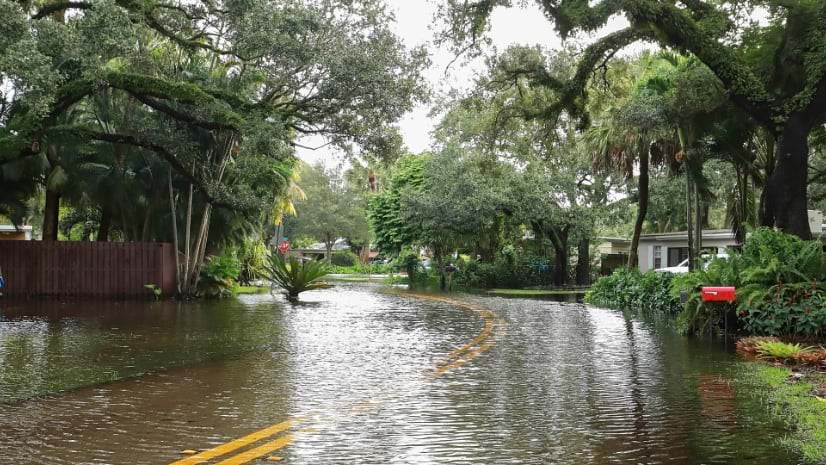
But the deluge that fell on Fort Lauderdale the night of April 12, 2023, came without a name and without a warning. Powerful thunderstorms from the north entangled a pocket of gulf moisture moving in from the southwest. The resultant atmospheric river dropped a staggering 25 inches of rain in about 12 hours.
The forecast for that evening had called for a few inches of rain, nothing major for the region. “To us it was just going to be another afternoon rainstorm,” recalls Jeff Lucas, Fort Lauderdale deputy fire chief. At city hall, where Fort Lauderdale’s geographic information system (GIS) team works, moderate rainfall started at around 3:00 p.m. A couple of hours later, the team members were navigating ankle-deep water in the parking structure. “It was a very quick, sudden, and unexpected event,” said Lucia Hogan, GIS team lead for the city.
By nightfall, the water was so high downtown that, during rush hour, people had to leave their cars and evacuate on foot to higher ground. Inland areas—far from storm drains designed for rain and tropical storms—were among the worst hit.
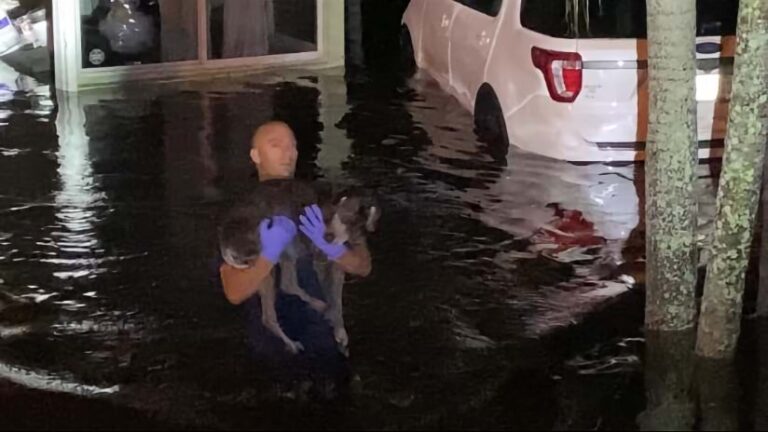
On a busy day, the Fort Lauderdale emergency dispatchers might receive 140 calls. On this evening, they had more than 600 calls after 6:00 p.m. People were stuck in their cars or trapped in their homes with water coming in. Additional personnel were called in to assist with the call volume.
Inundated, the fire chief reached out to crews from surrounding municipalities to join the rescue efforts. Dispatch directed the work, using a map to minimize overlap. Volunteers with high-water vehicles pulled stranded residents and motorists from areas where the water was too deep for fire engines.

Around daybreak, when the downpour finally subsided, the situation became apparent: “We need to get emergency management from the state involved,” Lucas said. “We need to get FEMA [the Federal emergency Management Agency] out here.”
The morning after the storm, bleary-eyed from overnight rescue operations, Chief Lucas met with the GIS team to plan how it would escalate storm response. Bringing in state aid isn’t as simple as calling the governor’s office in Tallahassee and asking for assistance. Florida city governments are organized to manage hurricanes, and the expectation is that they are equipped to handle a rainstorm.
“We were starting to get nervous about how we were going to do this,” Lucas recalled. “We knew they were going to ask us to go house to house to document damage.”
The storm had flooded six large neighborhoods, impacting thousands of homes. Lucas said, “We were under a lot of pressure from our residents to get the governor’s office something so staff could start contacting Washington and making declarations.” In disaster situations, FEMA offers guidance and resources when damages exceed what state and local authorities can manage. To build a case for FEMA involvement, local damage assessments are essential.
Coordinating damage assessments are just one way the GIS team helps orchestrate emergency response and recovery efforts for the city. “We support all the departments and try to streamline and integrate what they need in terms of information,” Hogan said.
In this disaster, the GIS team worked around the clock with Hogan and senior GIS analysts Carlos Cruz and Yaser Khouja, splitting shifts. The team pulled in data about the sewer system, the IT infrastructure, public works requests, and information collected in the field to help leadership make quick decisions. “The common denominator is geography,” Hogan said.
Everything starts with a map. The beauty of GIS is that it brings information together in a way that everybody can understand at a glance: different data sources shown as layers on a map.
LauderServ, the citizen response management platform for the city, allows residents to log service requests from a phone or computer. The GIS team has configured the system to serve data into a GIS software as a service platform, ArcGIS Online, displaying requests as a layer on the map.
The thunderstorms had caused localized flooding. To identify the problem areas quickly, the public works department looked for clusters of reported sewer and flooding issues on the map. Then the department sent pump trucks to vacuum standing water in these places.
Looking at service requests also provided a starting point for the fire department’s windshield assessment—a preliminary damage survey that’s conducted from a moving vehicle—which staff would use to plan recovery operations. Firefighters recorded levels of damage using a GIS application on mobile devices for data collection.
Results of the windshield assessment were pulled into GIS as a color-coded map layer that guided the work. “We gave public works staff the ability to say, OK, the flooding is less severe now, so let’s mark that area as yellow, or let’s mark that area as orange,” Hogan said.
“It was telling us where we needed to still go, and what areas we needed to concentrate on,” Lucas explained.
To declare a state of emergency requires photo evidence of at least 500 dwellings that have sustained major storm damage. For a municipal government working alone in a time crunch, collecting, and sharing this information was a daunting task.
But the deputy chief had an idea. Having previously worked with the State Emergency Response Team (SERT) assessing hurricane damage to fire stations in the Florida Panhandle, Lucas knew ArcGIS Survey123 could speed up the process.
“If we’re going to the moon, someone has to be smart enough to build the rocket,” Lucas said. “Fortunately, I have the best GIS team in the world to make that task easy.”
Working with the deputy chief, Hogan and her team created a survey that brought together all the state requirements for documenting storm damage. “It was a field solution we could deploy on iPads and iPhones and laptops,” Hogan said. “Essentially what we did is take screenshots of everything the state had in its application and mimicked it on our side for the inspectors to use.”
On Friday morning, at one of the fire stations that still had power, the chief called his inspection teams into the conference room and went over how to use the Survey123 app. He had about an hour to get them up to speed.

He started with the goals and processes. At each dwelling, they were to plunge a measuring stick into the water, snap a photo, and load the photo into the app. They needed to capture the address and record contact information for the occupant. Finally, they would create a clickable point on the map that linked to all the information.
“We put the phone up on the TV screen and just walked them through it,” Lucas said. “We did a practice run using the fire station as the point. Everyone did their survey; it was really simple and easy.”
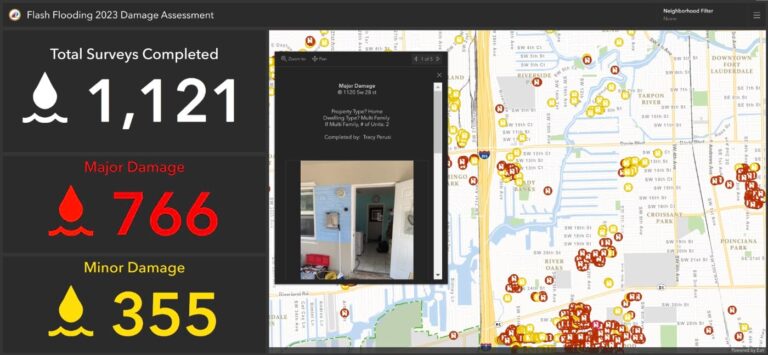
On the big conference room display, Lucas and city leaders watched as the map filled up with completed inspections.
The deputy chief directed his teams based on the patterns of destruction that were revealed. “Every time the chief saw a new cluster of damage he would go up to the board and click the inspections to see what his team members were submitting,” Hogan said. “It was just really cool to see how involved they were.”

To speed the process, the GIS division shared a link to the dashboard with SERT members so that they could follow along from Tallahassee. “They could see the projection that we would hit their threshold, and this helped them get ahead of the planning,” Hogan said.
“The live dashboard was just tremendous for us to get it done quicker,” Lucas added, noting that earlier in his career, these types of assessments would have been mailed to the governor’s office as handwritten notes and printed photographs. “They could see we had a real flooding problem and were ready to come down.”
With SERT—and, later, FEMA—routed to Fort Lauderdale, the GIS team added yet another layer to its map—directing aid to approximately 600 displaced residents.
“We had organizations contacting the city, asking how they could get in touch with people that needed their assistance,” Hogan said. “And that alone is a task that I think people take for granted sometimes.”
For this, the GIS team created the Neighbor Needs Assessment survey. The city circulated flyers with a QR Code, and in some places, went door to door inviting residents to respond using the app to request food, water, sundries, transportation, shelter, diapers, and other necessities. The city received about 800 submissions.
The city manager’s office filtered the results of the survey to connect nonprofit orginizations and volunteers with the residents in need. “The main thing is to understand the concentrations,” Hogan noted. “This makes it easy for people in city leadership to understand where the needs are. You know where to send the food trucks.”
In the aftermath of the unprecedented rainfall and devastating floods, the resilience and collaborative efforts of the Fort Lauderdale community shone through. From the tireless work of the fire department and GIS team to the swift response of the SERT and FEMA, these professionals rallied together to assess the damage, provide aid to displaced residents, and begin the process of recovery.
Learn more about how GIS is applied to collect, manage, and report disaster damage.
June 6, 2023 |
August 21, 2023 |
April 14, 2021 |