February 9, 2021 |
Brooks Shannon | Public Safety
April 14, 2021
It’s called the Great Flood of 2019 for good reason. It was the wettest spring on US record, impacting 14 million people as multiple storms hit and rivers overflowed, flooding the Midwest, High Plains, and South from January through June. New high water mark records were set in 42 different locations along the Mississippi River. The lessons learned then continue to this day—the flood was one for the record books across many areas of science.
Students at Western Illinois University (WIU) in Macomb had a front-row seat—Macomb sits between the Mississippi and Illinois Rivers and north of where the rivers meet—and they set to work monitoring impacts and identifying areas of need.
“The Mississippi River was having extreme flooding, and the Illinois River just couldn’t drain,” said Chad Sperry, director of the GIS Center at WIU and a member of the state incident management team.
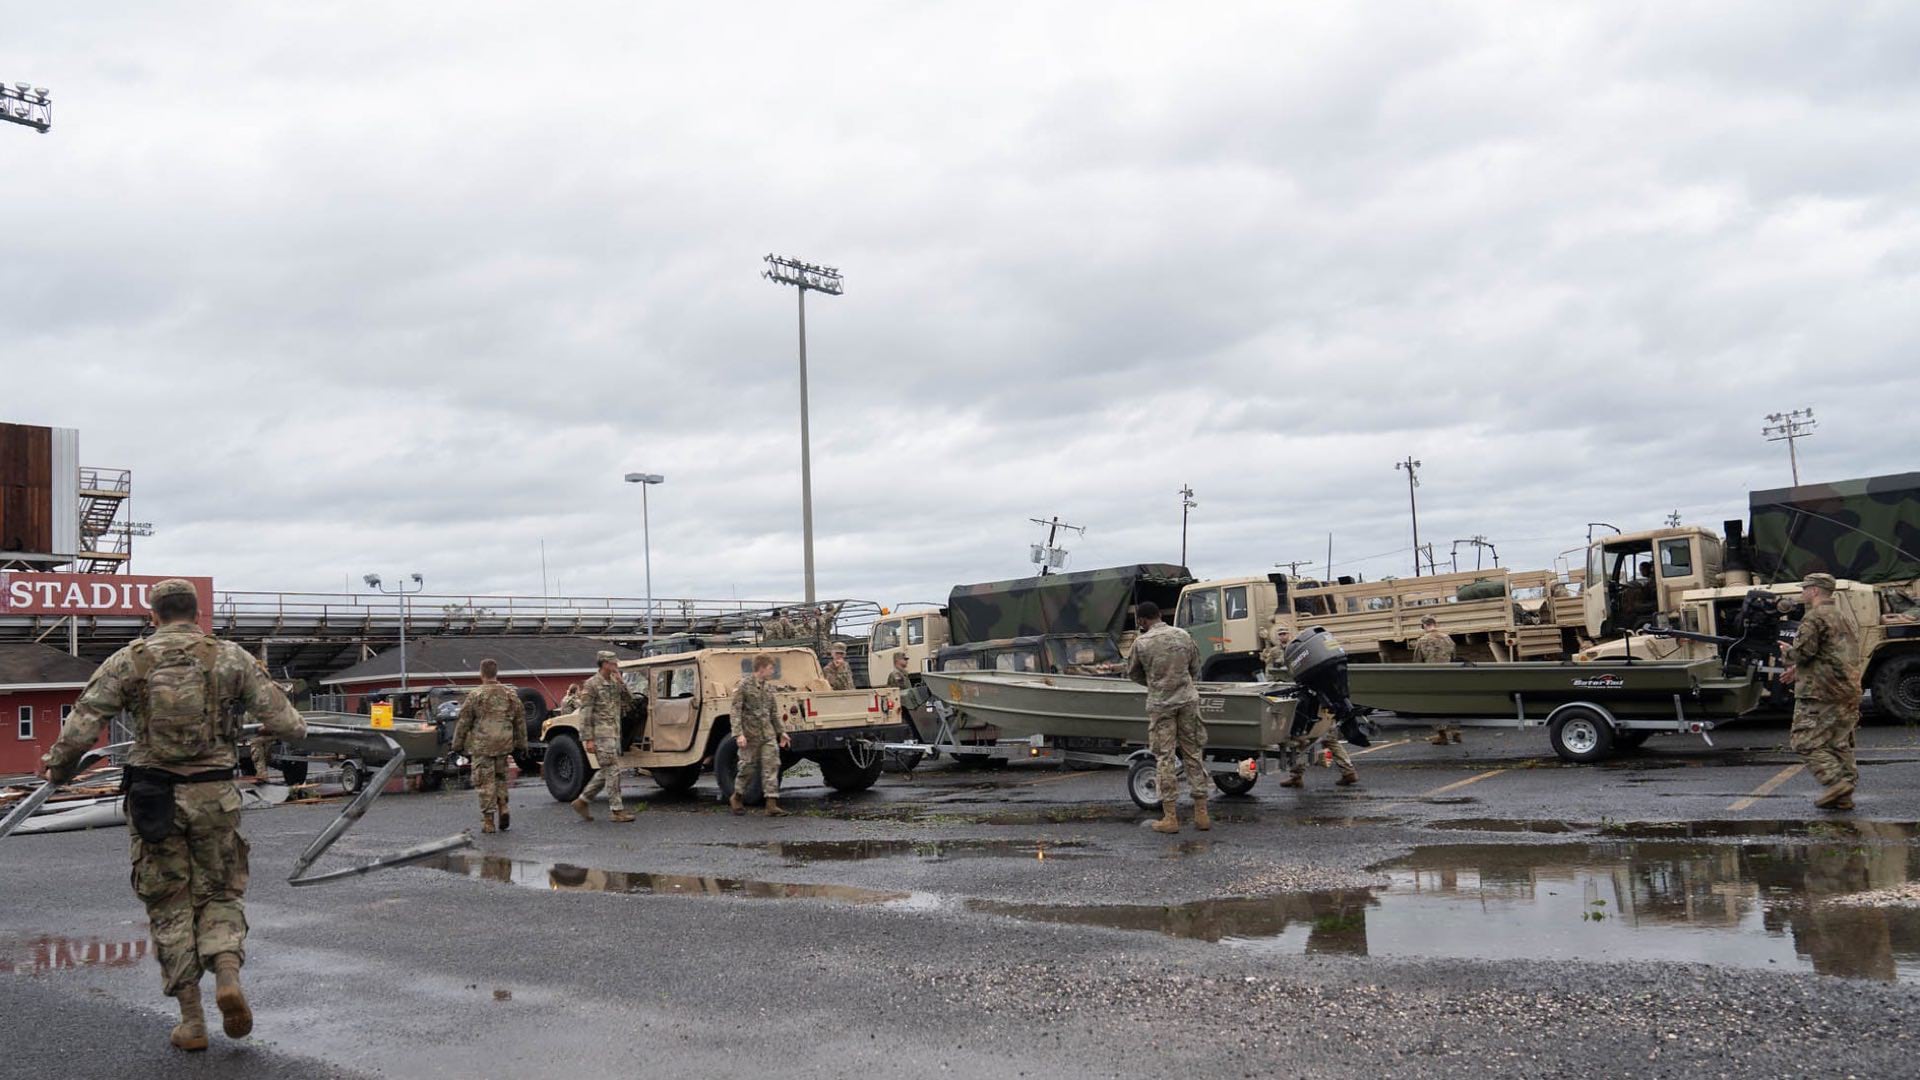
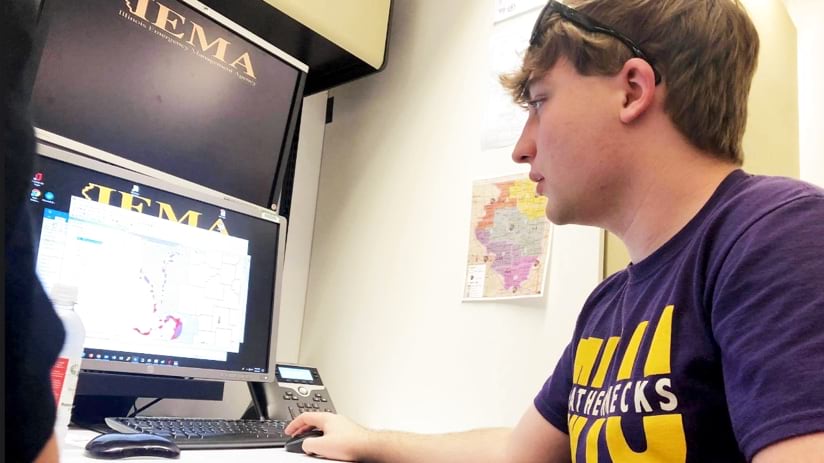
Sperry was dispatched by the Illinois Emergency Management Agency (IEMA) to the State Unified Area Command (SUAC) in Winchester. He brought a team of geographic information system (GIS) students to create maps that could help first responders from IEMA, the National Guard, Illinois Department of Transportation, Illinois State Police, US Army Corps of Engineers, and others.
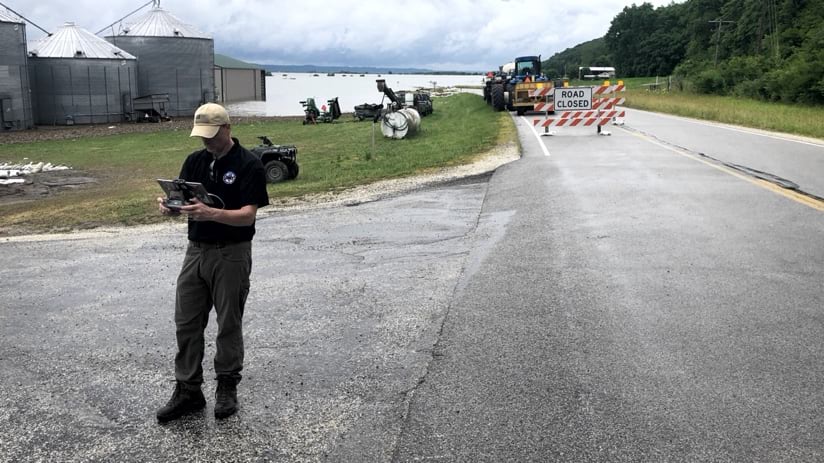
“There were a lot of road closures, so the students were involved in making detour route maps and other mapping products,” Sperry said. “We used drones to provide a real-time situational awareness capability. We were working 14-hour days for 16 days straight.”
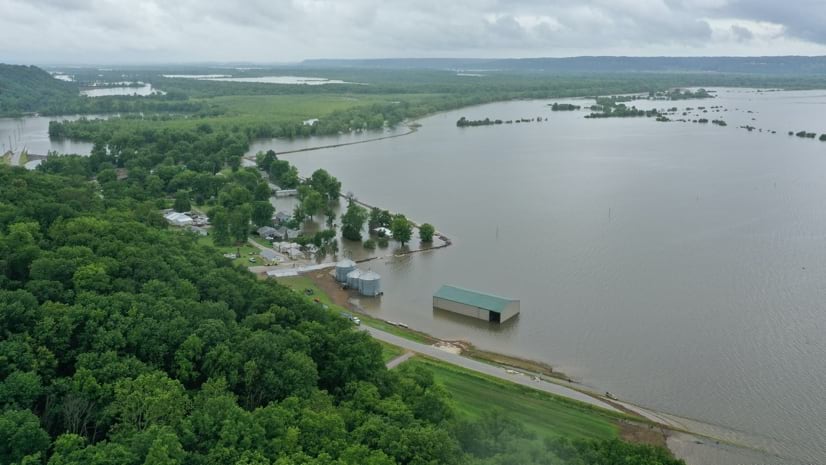
In many of the small communities along the rivers, flooding is a regular occurrence, but not to the extent and duration of these events. Beardstown, Illinois experienced 176 days of minor and moderate flooding. In nearby Havana, major flooding stretched for 37 days.
“The duration and the intense months of coping with flood response were exhausting,” Sperry said.
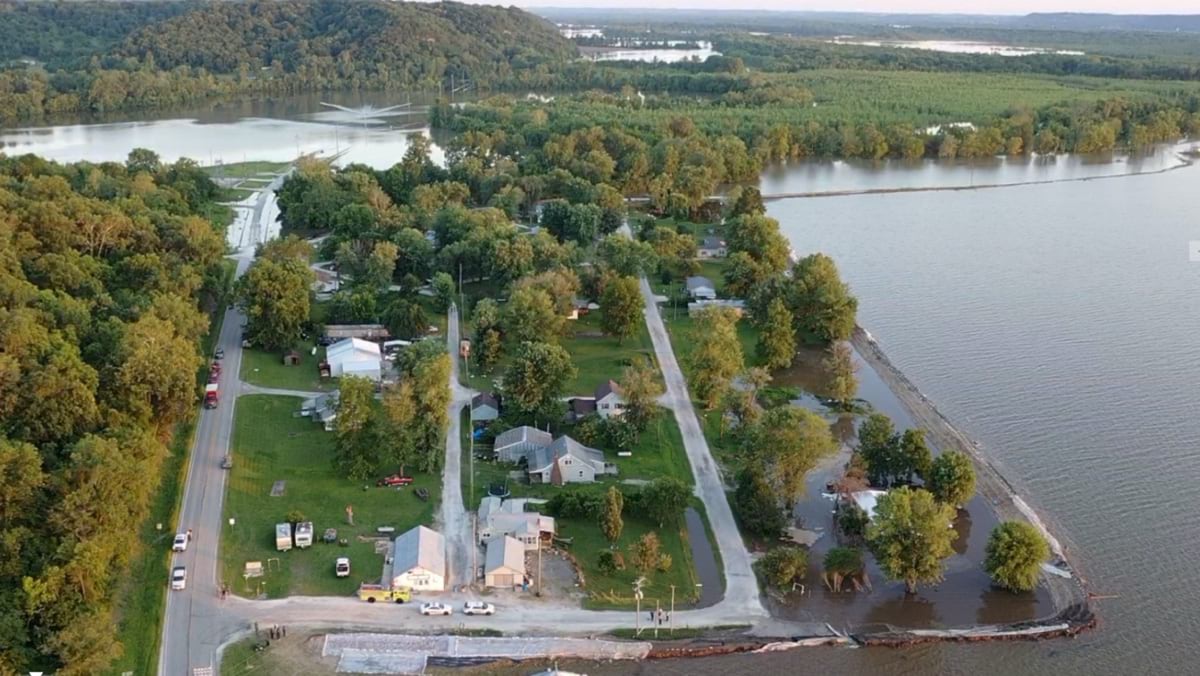
In the state’s unincorporated community of Nutwood, Sperry and his team monitored the main stem levee system a few miles away from town.
“Nutwood isn’t significant in terms of population, but very significant in terms of impact,” Sperry said. “It sits right at the bluff, so it’s almost out of the floodplain, but not quite. It became evident that this levee was going to fail due to the models that were run by the US Army Corps of Engineers and the National Weather Service using hydraulic forecasts and GIS to do predictive modeling.”
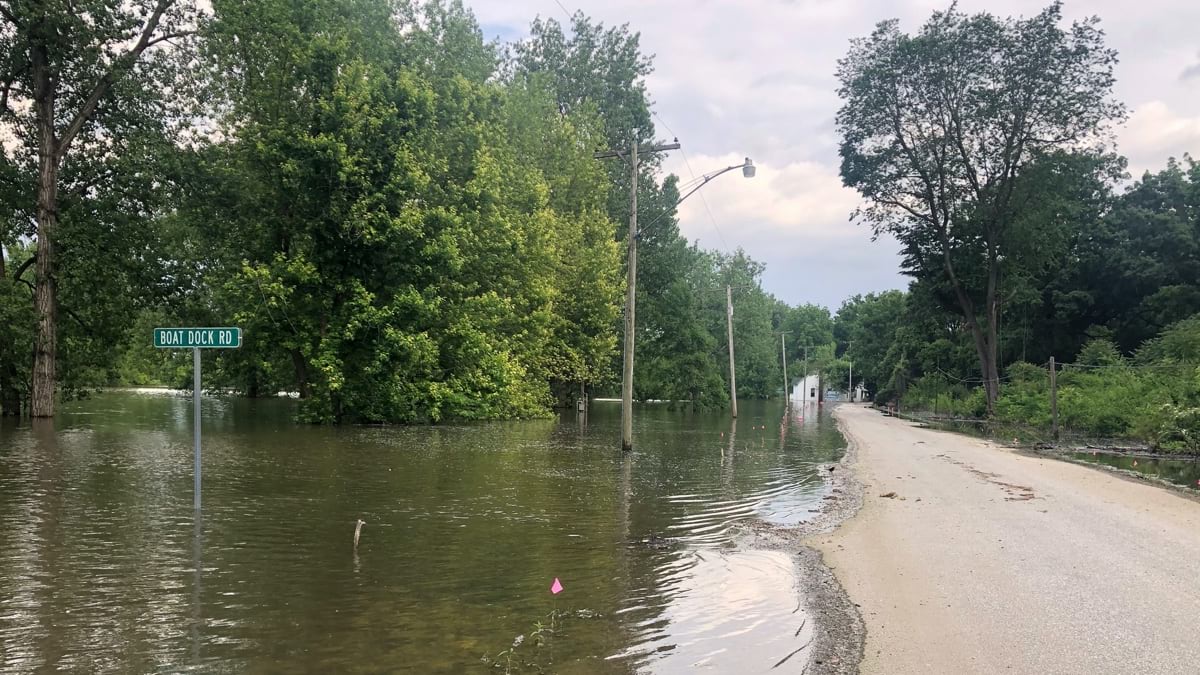
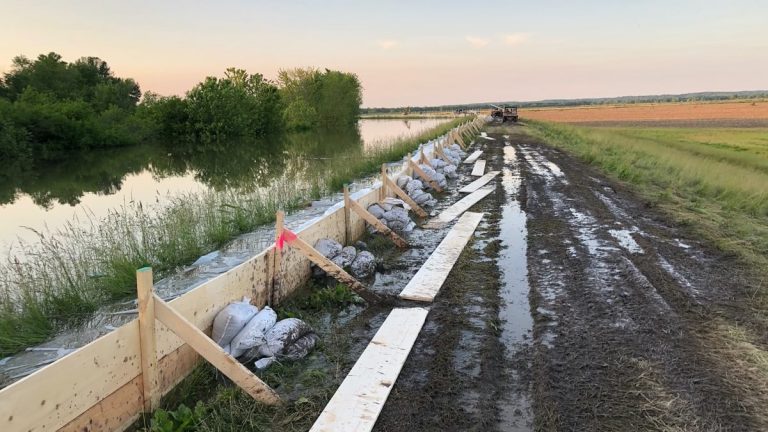
The townspeople built their own back-up levee using bulldozers to push dirt from the farm fields around town. Unfortunately, the main levee failed, and then the town levee failed. When the Nutwood Levee overtopped, it forced the closure of Illinois State Route 16 at the Joe Page Bridge near Hardin. And it took weeks for the waters to recede.
Sperry and his team were there over the course of the levee failure.
“We mapped Nutwood using drones and Drone2Map technology before the levee breach, during the levee breach, and after,” Sperry said. “Detailed drone mapping and elevation models were used by IEMA to inform evacuations.”
The team also used GIS tools to record the aftermath. They used ArcGIS Survey123 and ArcGIS Collector to do post-flood damage assessments, photographing everything. Collecting data on iPads, the team moved away from the paper-based system historically used up and down the Illinois and Mississippi Rivers.
Sperry helped train everyone and keep them on task. In some cases, this required guiding people through the discomfort of new work processes.
“When you have folks used to writing everything down on paper, the first little hiccup makes them want to ditch the iPad,” Sperry said. “We heard some of that. But when we got to lunch and hooked up all the iPads to a hotspot and pushed data to the cloud so they could all see their work on the map, the light bulbs started going on. It was one of those aha moments for a lot of damage assessment crews that had never used this technology.”
The work to map transportation routes was one of the more critical elements, with floods closing many roads and bridges, and people needing to evacuate.
“The Department of Transportation had an expert traffic flow modeler that was optimizing evacuation routes,” Sperry said. “We imported that information into geodatabases to take it to the next step, creating map products to provide the context of where all the people would ultimately end up.”
Many ferries run across the rivers due to a lack of bridge infrastructure, and road and bridge closures from the flooding made mobility even worse. Commuters to St. Louis even used their own boats to make the crossing, parking their cars across the river to avoid having to spend three additional hours each way driving around the flooding.
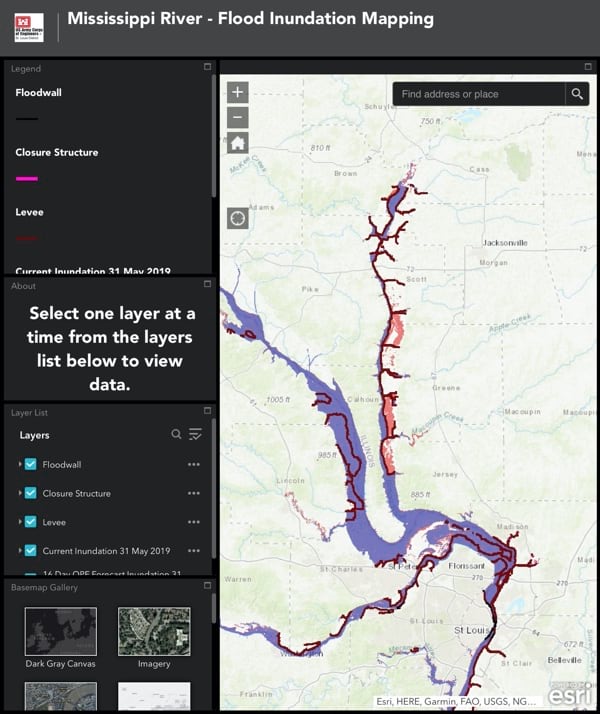
As the high water moved downriver over time, the team did some inundation modeling to help understand impacts as flooding neared St. Louis.
“There were some questions that if a particular levee breaks, what would we be looking at?” Sperry said. “We were creating flood extent maps to examine the realities if any one of these levees breached.”
Incident commanders and planning section chiefs studied the flood extent maps to create contingency plans. By looking at potential outcomes, they could determine which homes and roads would be impacted and prioritize evacuation areas should the levees fail.
“We used something like one million sandbags during the event,” Sperry said. “Levees are typically built with an earthen core with sand over the top of it. Over time, the sand and core get saturated, and that puts pressure and stress on the surrounding soils. We had boils popping up a half mile inside the levee where the river found a path, and they would put sandbags around those to equalize them with the height of the river.”
The US Army Corps of Engineers used ArcGIS Collector to mark and monitor the boils, any depressions in the levee, and anything out of the ordinary. That data about weak spots will then be used to inform future levee improvements.
The real-time data collected by different agencies and GIS students was fed into ArcGIS Dashboards and shared across the state.
“We built a dashboard with the National Guard to show where sandbag troops were being deployed,” Sperry said. “After that first briefing where we used the dashboard, they moved us into the main building and the dashboard stayed up on the main screen.”
Soon the dashboard was shared with the Emergency Operations Center in Springfield, and the National Weather Service in Chicago used it to see what’s really going on from a levee status standpoint. It was used to brief the governor, department heads, state senators, and US senators.
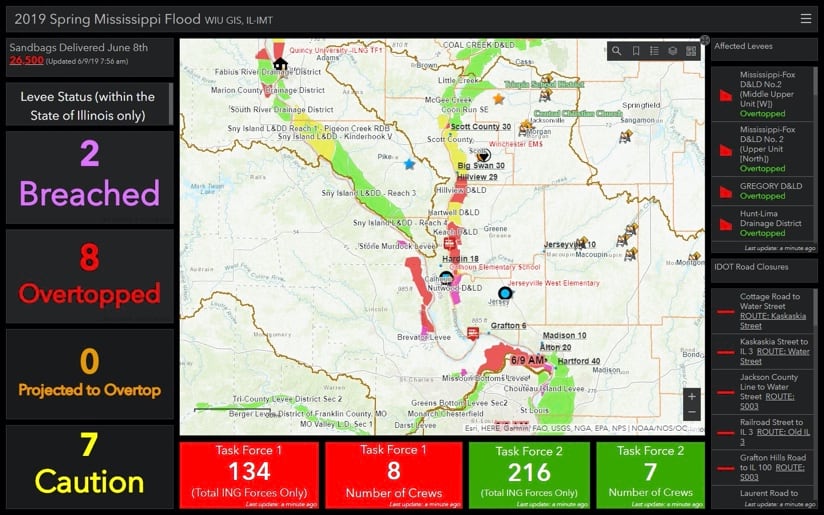
Eventually, the dashboard aggregated and consolidated data from 10 to 15 GIS analysts working for various agencies. WIU students worked alongside the experts. Pam Brooks, GIS specialist at IEMA, had already fostered relationships with GIS people from other agencies and was able to help coordinate the collaboration.
“Whether there’s a need for specific map elements to be created or various datasets to be updated, we all chip in,” Sperry said.
At daily morning briefings, the teams discussed any status changes on the dashboard. For instance, the representatives from the US Army Corps of Engineers would inform the group of any levee breeches or overtops, or levees in a state of caution.
The students kept track of details such as shelter locations because sometimes shelters would have to move if a levee failed. Keeping that information up-to-date was crucial to making sure evacuees had somewhere to go.
“We would get requests to add something, such as weather overlays for radar, and the students would research and find the best live data to add to the dashboard,” Sperry said. “There were many hands-on opportunities.”
The students gained a tremendous learning experience from these events, with immersion in the use of a wide variety of GIS tools and the need to deliver answers quickly during a crisis.
“We got a call one night just as we were getting ready to go home for the evening that a levee had just overtopped,” Sperry said. “So everybody just set their bags down and dug back in again. We were there for a couple more hours that evening.”
The flood events gave students crucial practice in the fast-paced, high-stakes world of emergency response using GIS—a common and important application of the technology.
“It was definitely the most stressful work environment I’ve ever had to work in,” said Ian Stearns, a WIU student majoring in meteorology who helped out. “Being able to learn how to control the stress of all the things going on, all the decisions you have to make, has been really helpful for me.”
At the time he joined the student team to respond to the disaster, Stearns had taken one GIS class and was working at the GIS Center for three months in a paid position that gives students real-world experience.
“When we flew over the temporary levee in Nutwood to identify places it might fail, that was really fascinating,” Stearns said. “The way we were able to create a detailed digital elevation model from the imagery—and Chad Sperry was able to model water height in relation to it and other buildings—was awesome. I had never even thought of that kind of application of GIS.”
In between events, the students would talk about GIS jobs and get to know the emergency personnel. The students’ real-time skills made an impression on their professional cohorts.
“One of our grad students had two different job offers from the US Army Corps of Engineers before he even got home,” Sperry said.
Today, in Stearns’ meteorology classes, he said students talk about the accumulated snowfall, and how the ground was still frozen when the snow was melting so there was no intake of moisture in the soil, and then there were above-average spring showers. So all those factors contributed to why this event was so historic.
Though the flood of 2019 set many new records—longer in duration with higher floodwaters—Sperry said the damages were less than what was anticipated.
“We had eyes in the sky and the ability to predict and not just react. Instead of waking up to find that a levee broke in the night, we deployed sandbagging efforts to where GIS predicted it would break. We knew what was coming with the rainfall models and the gauge models. And so technology was really given a lot of credit for minimizing the impacts.”