

February 16, 2023 |
Carrie Speranza | Public Safety
It’s time for every US state to update its five-year hazard mitigation plan—now with priorities around community vulnerability and climate forecasts. Mitigation managers in Florida are meeting this Federal Emergency Management Agency (FEMA) mandate in a new way, via interactive maps to make their plan more user-friendly.
“We met with local jurisdictions, and they told us they didn’t find the previous plan useful, which is a dagger to our heart for this huge five-year effort,” said Kristin Lentz, the mitigation planning manager at the Florida Division of Emergency Management (FDEM).
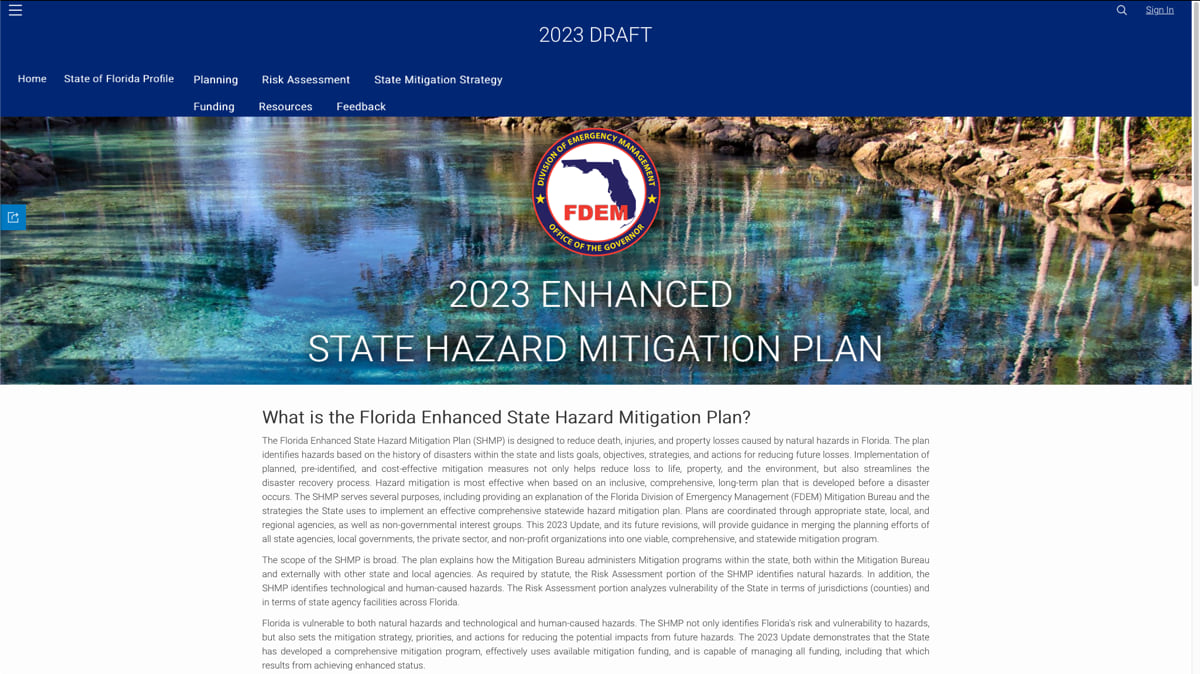
So Lentz and her team at FDEM used geographic information system (GIS) technology to build a more engaging experience. What was once a 500-page PDF is now a website with data-rich maps and insightful narratives.
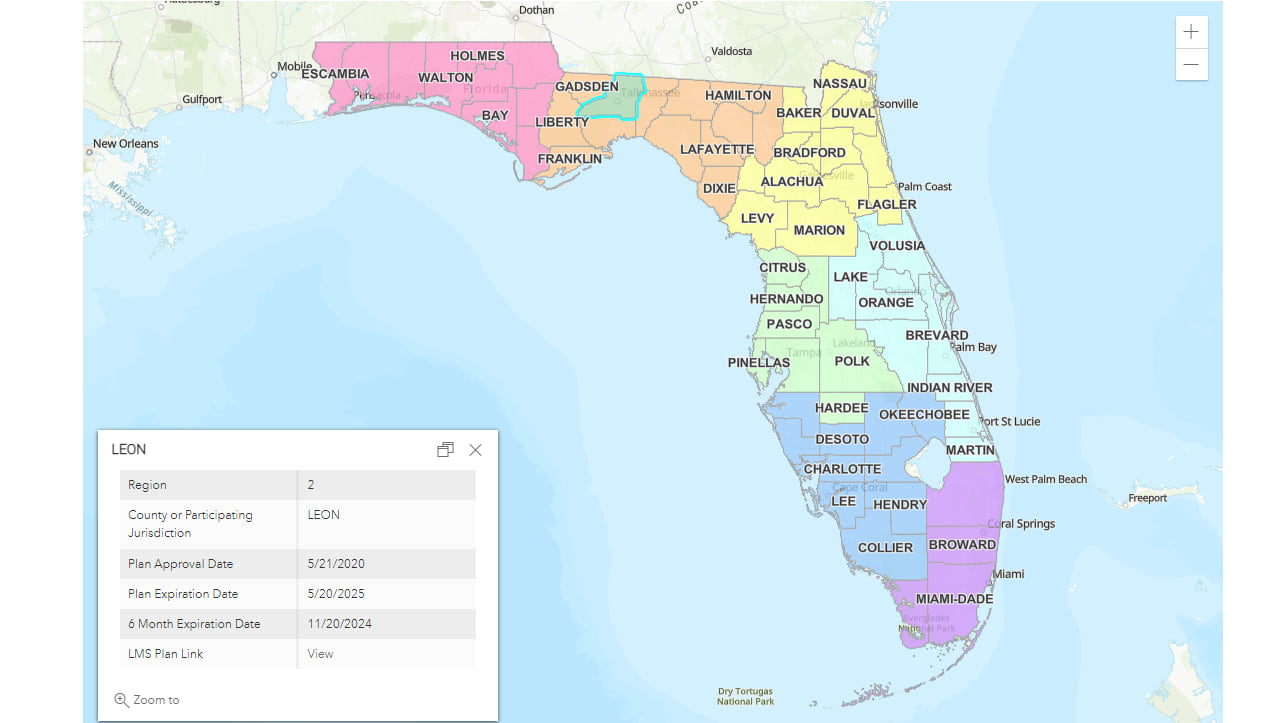
To meet FEMA’s directive by the August 2023 deadline, the FDEM team applied GIS analysis of hazards, climate, and social vulnerability. Then, to make the plan more intuitive, Lentz worked with Dan Rydl, GIS manager at FDEM, on incorporating digital maps. They built the site using ArcGIS Hub to organize information and ArcGIS StoryMaps for narratives. They will continue to update the site’s open data and analytical guides for counties and municipalities.
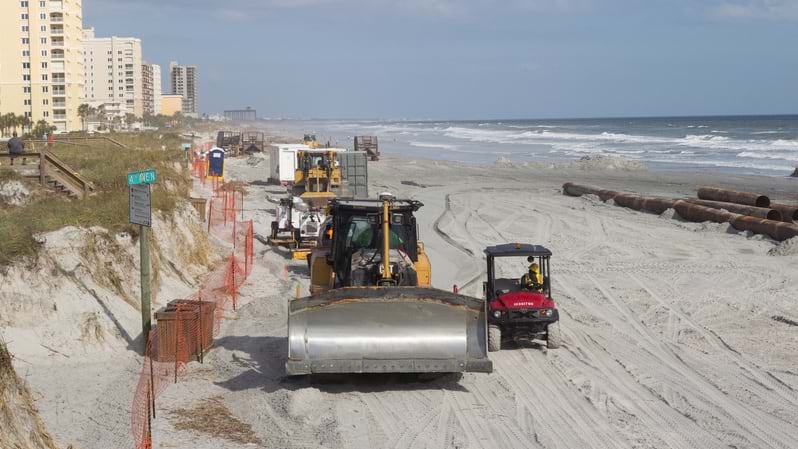
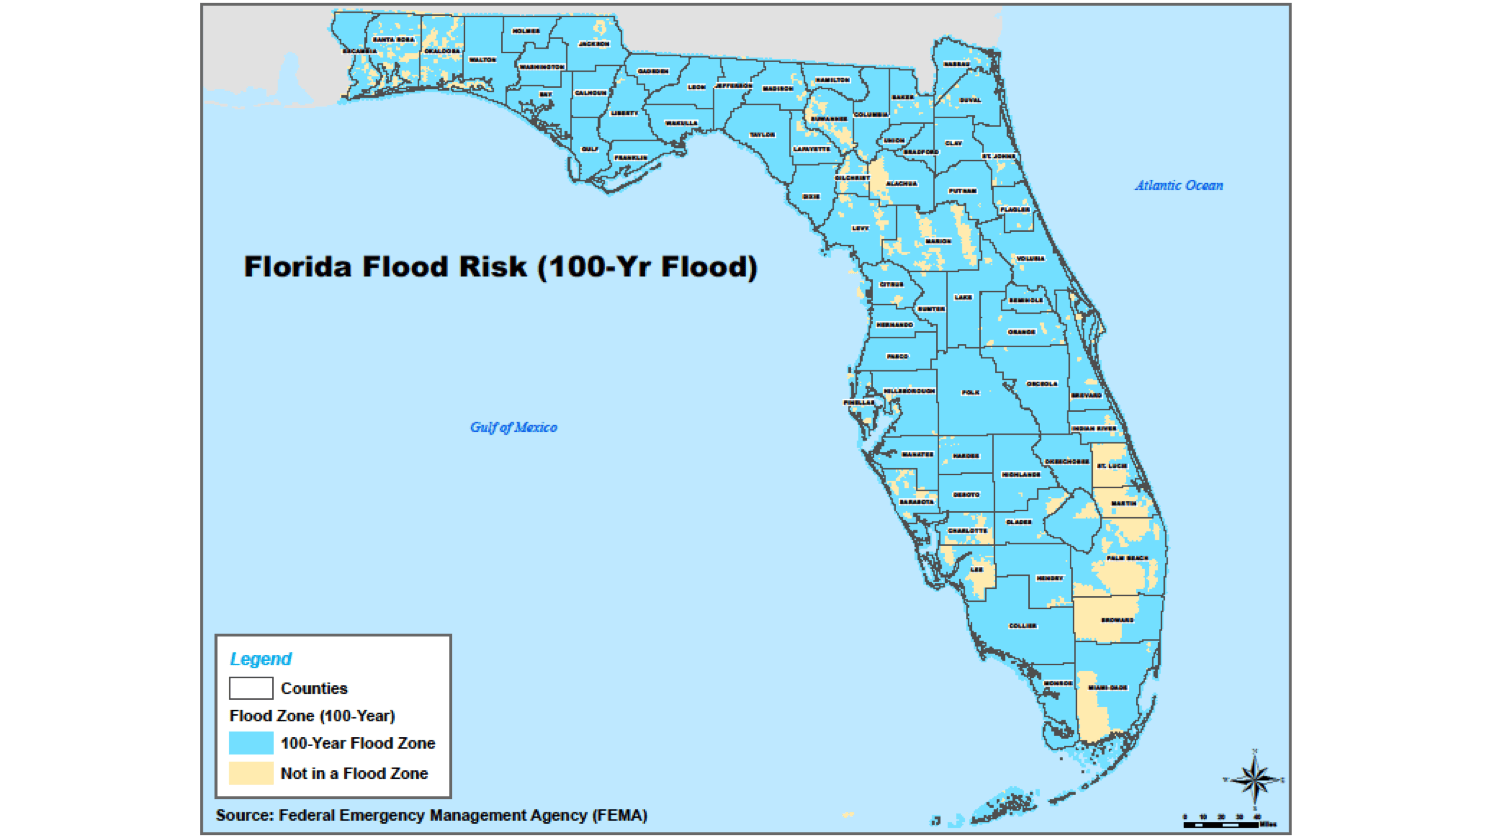
Hazard mitigation projects encompass retrofitting critical facilities such as schools and hospitals to better withstand hazards such as high winds, flooding, and extreme heat. The work entails hardening infrastructure such as electric and telecommunications networks to uphold power and internet connections. Other eligible projects include stormwater mitigation to increase drainage and, in some cases, elevating homes in areas that experience repeat flooding.

After a major event, FDEM assesses damages to determine how mitigation projects reduced property loss and saved people from harm.
“The loss avoidance reports help us with storytelling and getting buy-in for more projects,” Lentz said. “In mitigation, projects utilize effective resilience techniques to improve future outcomes, which can be highlighted through these reports.”
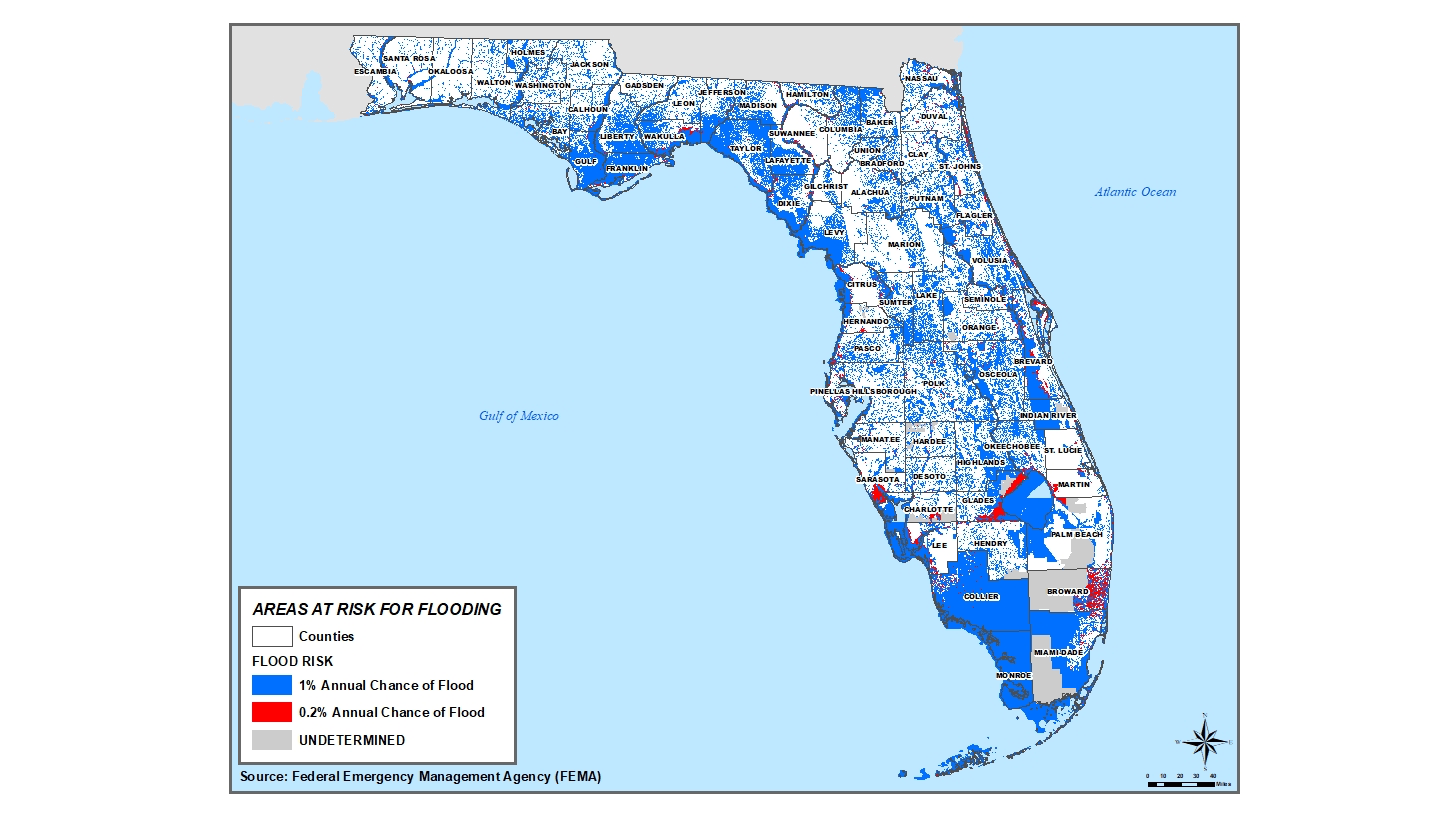
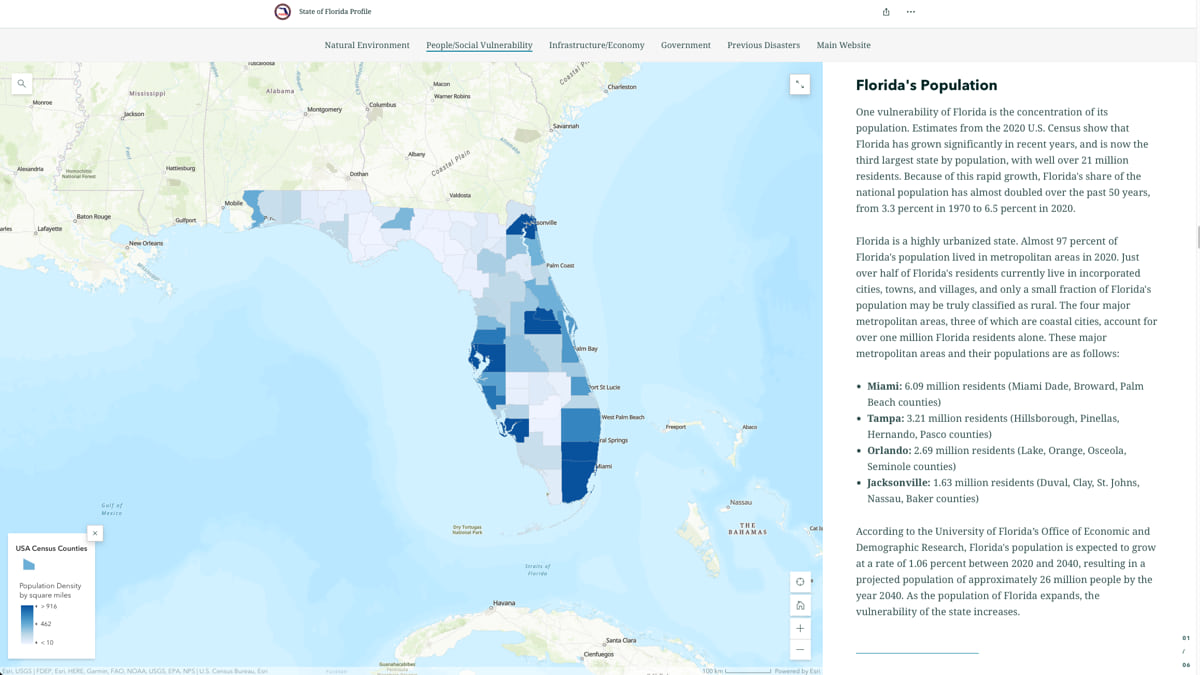
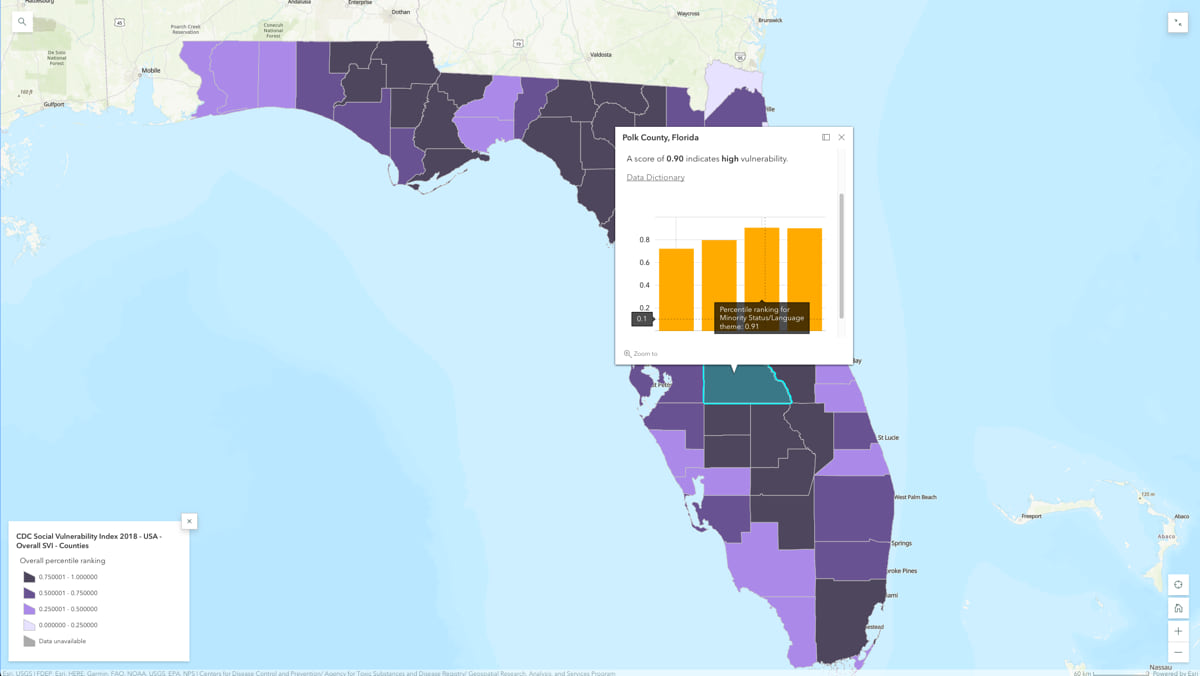
In a similar way, FDEM uses maps to show communities in need of more help and areas where hazard risks are highest.
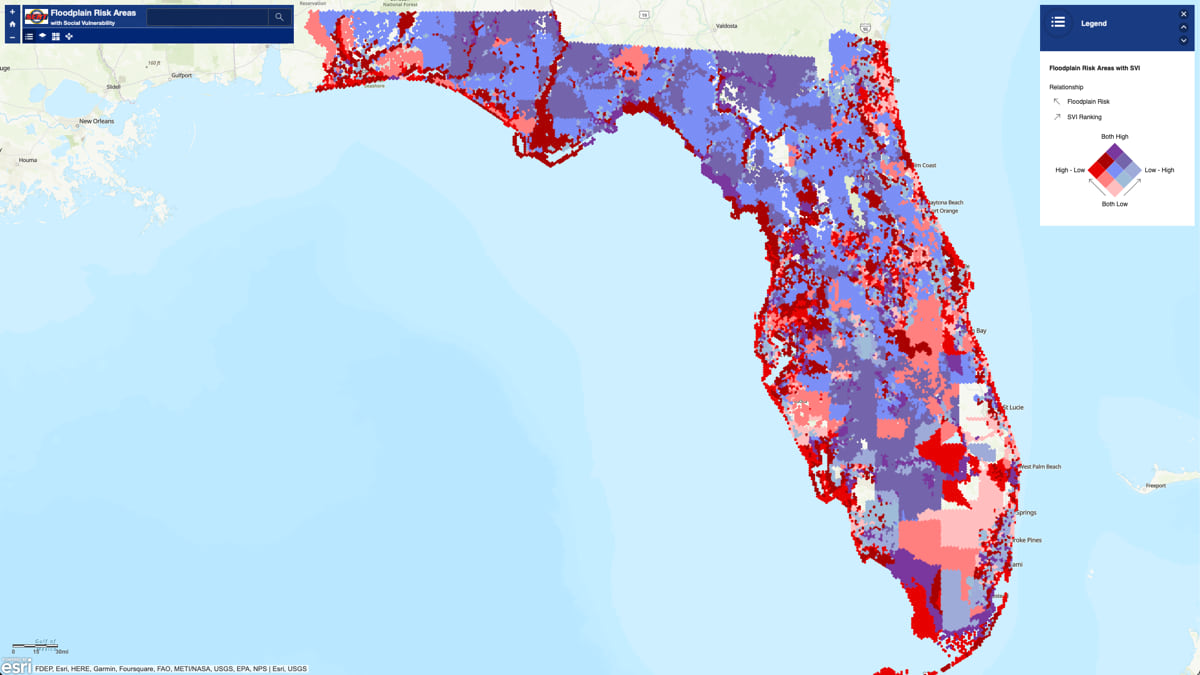
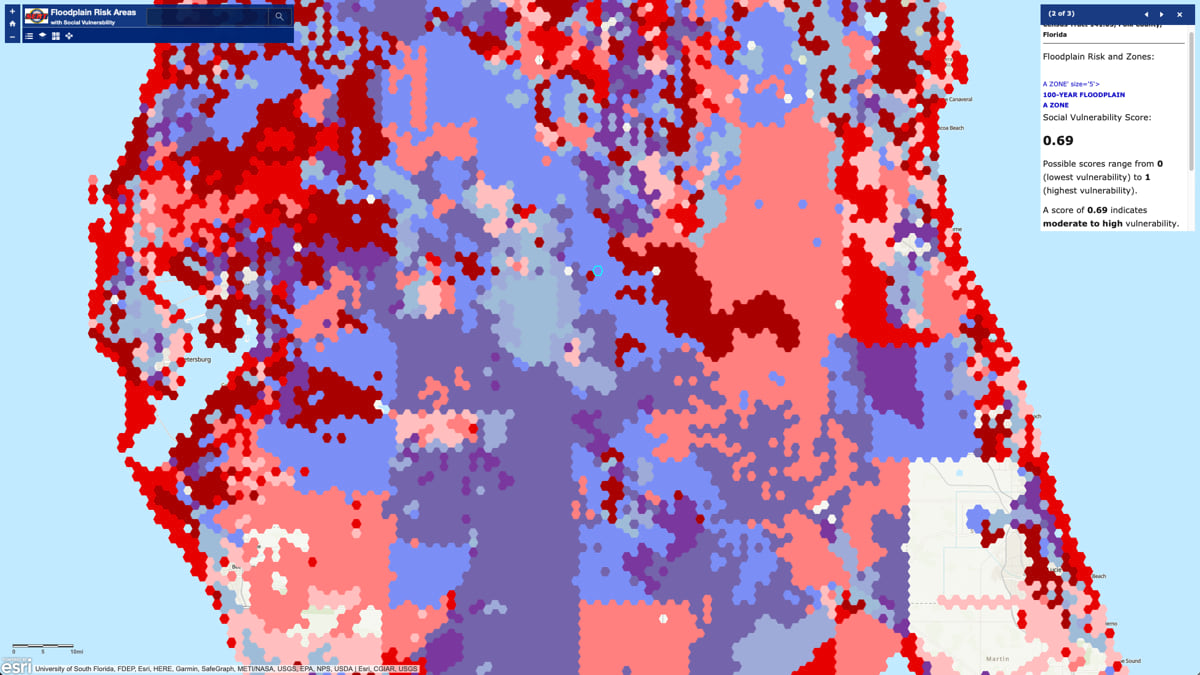
“We mapped risks and hazards and draped social vulnerability on top of that,” Rydl said. “Almost everybody that looks at the hazard vulnerability map pauses and wants to talk about it because they understand hazard risk in a new way.”
With more mapping, a more comprehensive picture of risk in Florida emerged. For instance, analysis of some natural hazards, such as extreme heat, revealed social vulnerability in the central spine of the state. “Diving deeper to ask, ‘Why is that?’ was helpful for us on the planning side,” Lentz said.
“Regardless of the hazard, it opens your eyes to the more challenged and impoverished areas,” Rydl said. “People assume that the coast is the most vulnerable, but that’s not always the case.”
On the previous five-year plan, Rydl and the FDEM GIS team provided maps. This time, he taught Lentz and her mitigation planning team how to make maps. They met every week for two years. Rydl trained the team on GIS basics, and they applied the technology to all of FEMA’s requirements.
Along the way, talents emerged on the combined GIS and planning teams. Some members were more comfortable making maps, others focused on narratives, and a few took on web development. “We picked up on that and built a really fun collaborative environment,” Rydl said.
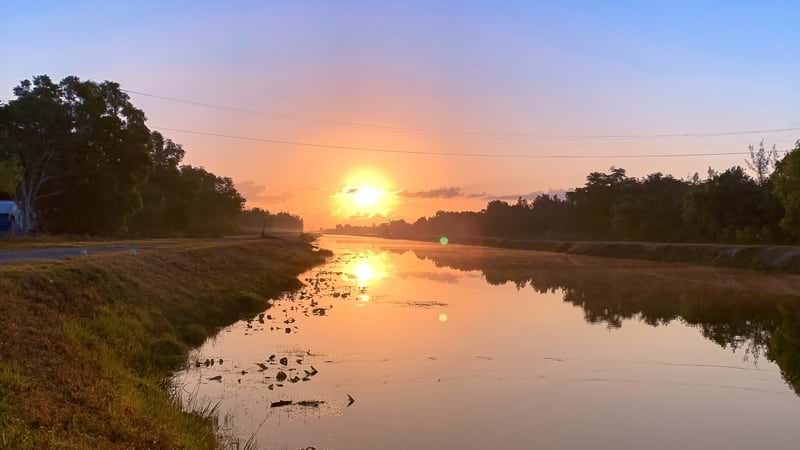
One area of focus was climate vulnerability. Florida currently feels increased impacts from more frequent and intense natural hazards. These hazards include wildfires, extreme heat, drought, storms, heavy precipitation, and sea level rise.
The state sees more natural disasters than most, particularly during hurricane season, which runs June 1 through November 30. For 2023, forecasters expect less activity than normal for the first time in seven years. If that holds true, it will pause an upward trend as extreme hurricanes have been on the rise over the last six years.
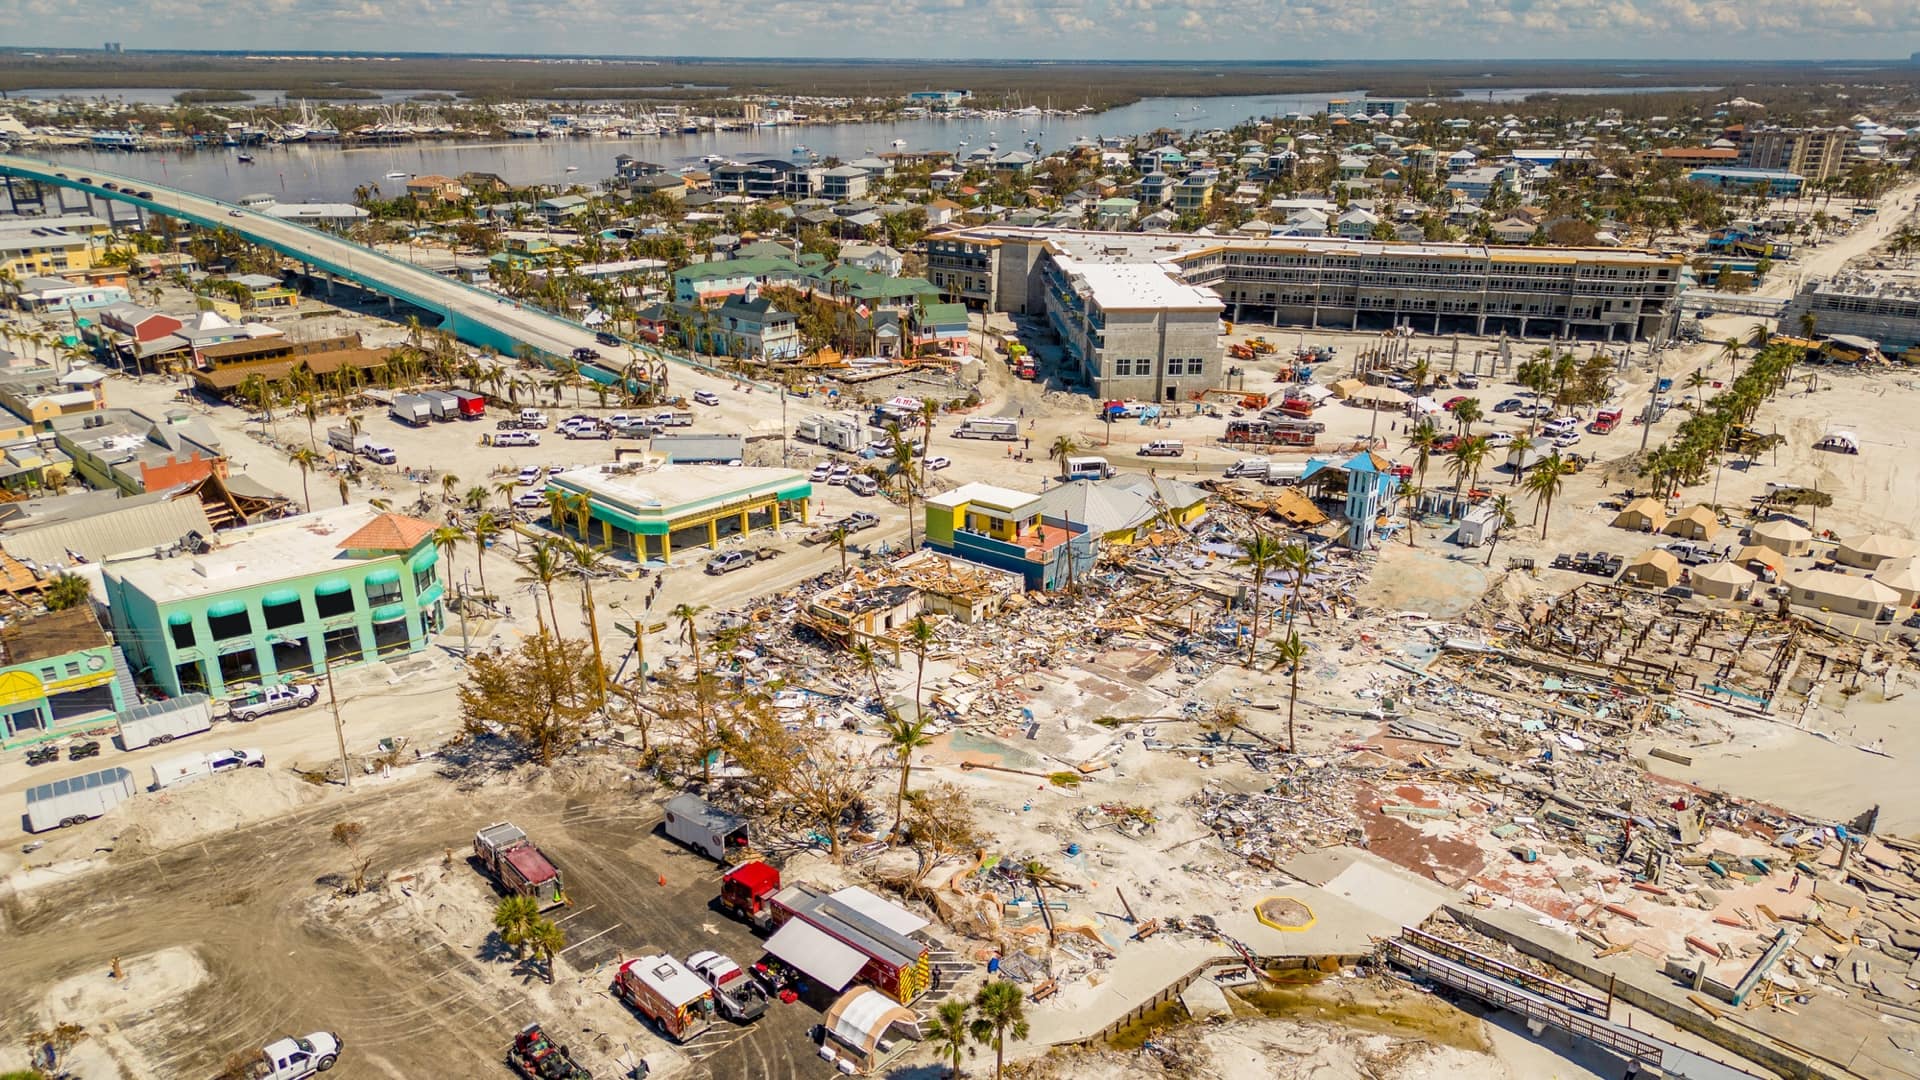
Hurricane Ian, which devastated southwest Florida in September 2022, is a sobering example. It caused $113 billion in damages and 152 deaths. A recent report ranks it as the third-costliest storm in US history. Without existing measures to mitigate damage, it could have been worse. And the damage that was felt is now guiding further mitigation.
While many states have considered climate forecasts in their hazard plans in the past, the FDEM team knows how tightly mitigation aligns with climate resilience.
“We’ve done the research to understand impacts, but I think we can improve on visualizing what future conditions will look like here in Florida,” Lentz said.
Rydl is looking into risk forecast models to understand what’s coming. Meanwhile, Lentz and her staff are on their way to becoming GIS experts. “I think the GIS team has become a little more mitigation-y, and I think mitigation got a little more GIS-y,” Rydl said.
This year, the FDEM team is confident it’s built a product that’s more useful to the counties and municipalities that design mitigation projects.
“We created a tool that allows local jurisdictions to ask where dollars will best be spent,” Lentz said. “They can look at how successful projects are, but also at where they haven’t yet implemented mitigation.”
Visit FDEM’s 2023 Enhanced State Hazard Mitigation Plan to interact with the new elements. Learn how GIS is used to understand risk and design strategies for mitigating future impacts.