
February 22, 2018 |
Keith Mann | Infrastructure
Key Takeaways
Departments of Transportation (DOTs) across the United States are shifting the way they operate in response to autonomous vehicles, rideshare services, and feedback from sensor data.
“Are we in the business of facilitating mobility or providing the expertise to build highways and transportation structures?” said John Selmer, director of the Strategic Performance Division at Iowa DOT. “Traditionally the emphasis has been on the latter, but I think that’s changing.”
With many twists and turns ahead for how people and goods will move in the near future, Iowa DOT is undergoing a digital transformation, one that will allow it to sense and measure changes and adapt plans accordingly.
Setting the Course
Iowa’s DOT is no stranger to transformation. The agency took the lead in 2012 when a change in executive management and a federal law called Moving Ahead for Progress in the 21st Century (MAP-21) placed an emphasis on performance and outcome.
The law required states to show the impact of their investments in infrastructure condition, safety, and system reliability (including metrics on congestion and travel time). Iowa DOT looked at the guidance and retooled, setting out to instill a measurement-oriented culture.
A first step was the creation of the Strategic Performance Division that pulled experts together from different divisions.
“A hierarchical structure makes it hard to drive change because it’s built for sustainability, consistency of product, and risk mitigation,” Selmer said. “We work on cross-departmental projects such as asset management, data governance, business analytics, and project management.”
Location Integration
DOTs use location, and the distances along the network of roads, rail, and runways, to guide most performance measures. The Iowa DOT was in good shape as it had already integrated its location intelligence platform, the geographic information system (GIS), with other enterprise systems. The integration ensures that data is maintained centrally in a GIS hub and shared with other systems as location-as-a-service.
“Creating the central GIS hub extended our reach into all other major business systems,” said Eric Abrams, GIS manager at Iowa DOT. “It allowed us to evolve.”
The Strategic Performance Division used the GIS hub to tap into data from the other business systems. This gave them the means to begin quantifying DOT performance as a whole, as divisions, and across the different field districts.
“A lot of people within business units look at data as the dessert or the salad,” Selmer said. “I look at data as the plate. Data is foundational, and it becomes exponentially more valuable when you combine it with other data.”
Iowa DOT now embraces open data, assuming that all data should be open unless proven otherwise. This philosophy makes the department nimble, able to combine key information within purpose-driven applications to address business challenges.

Sensing Conditions
Iowa DOT’s Office of Maintenance took advantage of its access to data by creating a simple dashboard to measure the amount of salt applied to icy roads each winter.
The salt measurement dashboard app showed DOT maintenance supervisors and other managers the quantity and cost of salt compared to prior years. Iowa DOT credits this simple comparison dashboard with saving the department $2.7 million a year within its first few years
Also tapping into the open data, the Strategic Performance Division used data from sensors aboard snowplows and along the road network to create a live map of winter driving conditions. The Iowa Track-a-Plow map was one of the first to offer this level of awareness, and it became an immediate hit with the public.
“There were concerns with more eyes viewing our work in a more intimate way,” Selmer said. “We have always felt responsible for the public’s safety because we’re the ones out there clearing roads. Ultimately the public plays a larger role in road safety and the real-time understanding of conditions helps individuals and businesses make better driving choices.”
With the data from Track-a-Plow, Iowa DOT created a dashboard view of additional metrics related to cost and performance. The statewide Winter Cost Calculator takes all data collected from individual plows, along with the cost of material, labor, and equipment, and aggregates it for each segment of the road network. The information is posted on an interactive map for DOT management and the public, putting the details from each storm and each year’s operations alongside historical records for perspective.
“Giving the public an understanding of the cost of a storm allows us to have more meaningful discussions,” Selmer said. “We can create a better dialogue about levels of service and what it takes to keep the roads clear.”
Tracking Pavement Performance
A great deal of work goes into building quality pavement. Smoothness, density, and physical appearance all factor into roadway safety, maintenance, and longevity. Iowa DOT continues to push the use of GIS into the field, recently adding an application to allow construction field inspectors to enter pavement inspection data on tablets rather than fill out paper forms.
Iowa DOT equips 157 full-time inspectors and 150 maintenance employees with tablets to view and collect data. They use one simple application to report inspections, reducing time spent from 30 minutes to just five minutes.
A digital workflow saves Iowa DOT hundreds of hours every year and makes it possible to immediately share data from across the state. Managers can view data from each pavement project. If a problem arises with a certain type of material, they can pinpoint where that material has been used. This added awareness increases the awareness of field crews and provides a new level of pavement asset management.

Staying Competitive
After taking steps to gain better insight into its own operations, Iowa DOT looked at the role transportation plays in a strong economy. The department hired a supply chain consultant to conduct research about the shipment of goods in and out of the state.
The analysis led to a few surprises. It showed a great deal of grain traveling north to bakeries in Minnesota rather than out of the country. Analysis also led to a reconsideration of fleet efficiency as the Iowa DOT learned that, on average, only 60 percent of the available truck capacity is utilized.
“The analysis is starting to inform us about how our system is being utilized,” Selmer said. “We’re looking at where we might place cross-docking and transloading sites so that truckers can combine loads and add capacity. That would make it much more cost-efficient for the shipper and we’d have less trucks on the road.”
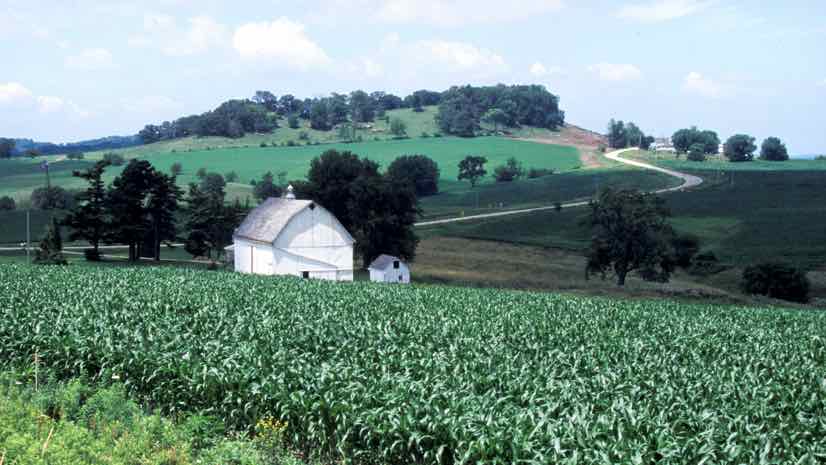
Agriculture accounts for roughly 90 percent of Iowa’s land use, and the biggest agricultural competition comes from Brazil. According to the U.S. Department of Agriculture, Brazil had record crops of both corn and soybeans in 2017. However, Brazil’s infrastructure still lags behind other countries.
“Brazil can produce crops cheaper than us and they can harvest two crops every year,” Selmer said. “But, our lower transportation costs provide a competitive advantage.”
In another effort, Iowa created a testing zone for self-driving fleet vehicles on a 20-mile stretch of Interstate 380 between Cedar Rapids and Iowa City. The state is using the exercise to gain a greater understanding of the data harvesting implications from the large amount of data these vehicles generate. Iowa is also exploring the insights that can be gained through analytics.
“Our initial guiding principle was really to get out of the mud and build infrastructure,” Selmer said. “Now, we’re looking at ourselves more as a mobility service provider, starting with a close look at how we operate on a 24/7 basis.”
Want to learn more about monitoring, managing, and planning complex transportation systems using GIS? Download the paper Data-Driven Decisions with Location Intelligence and explore how your DOT can leverage solutions for smarter project planning. Get tools and guidance for people-focused change management through Esri Change Management Consulting, designed to help you anticipate, manage, and minimize resistance to change.