May 5, 2020 |
Jeanne Flores | GIS for Good
September 29, 2020
In mid-January 2020, a man in Snohomish County, Washington was dubbed ‘Patient Zero’ of the novel coronavirus disease (COVID-19) in the United States. The diagnosis set off a countywide response effort.
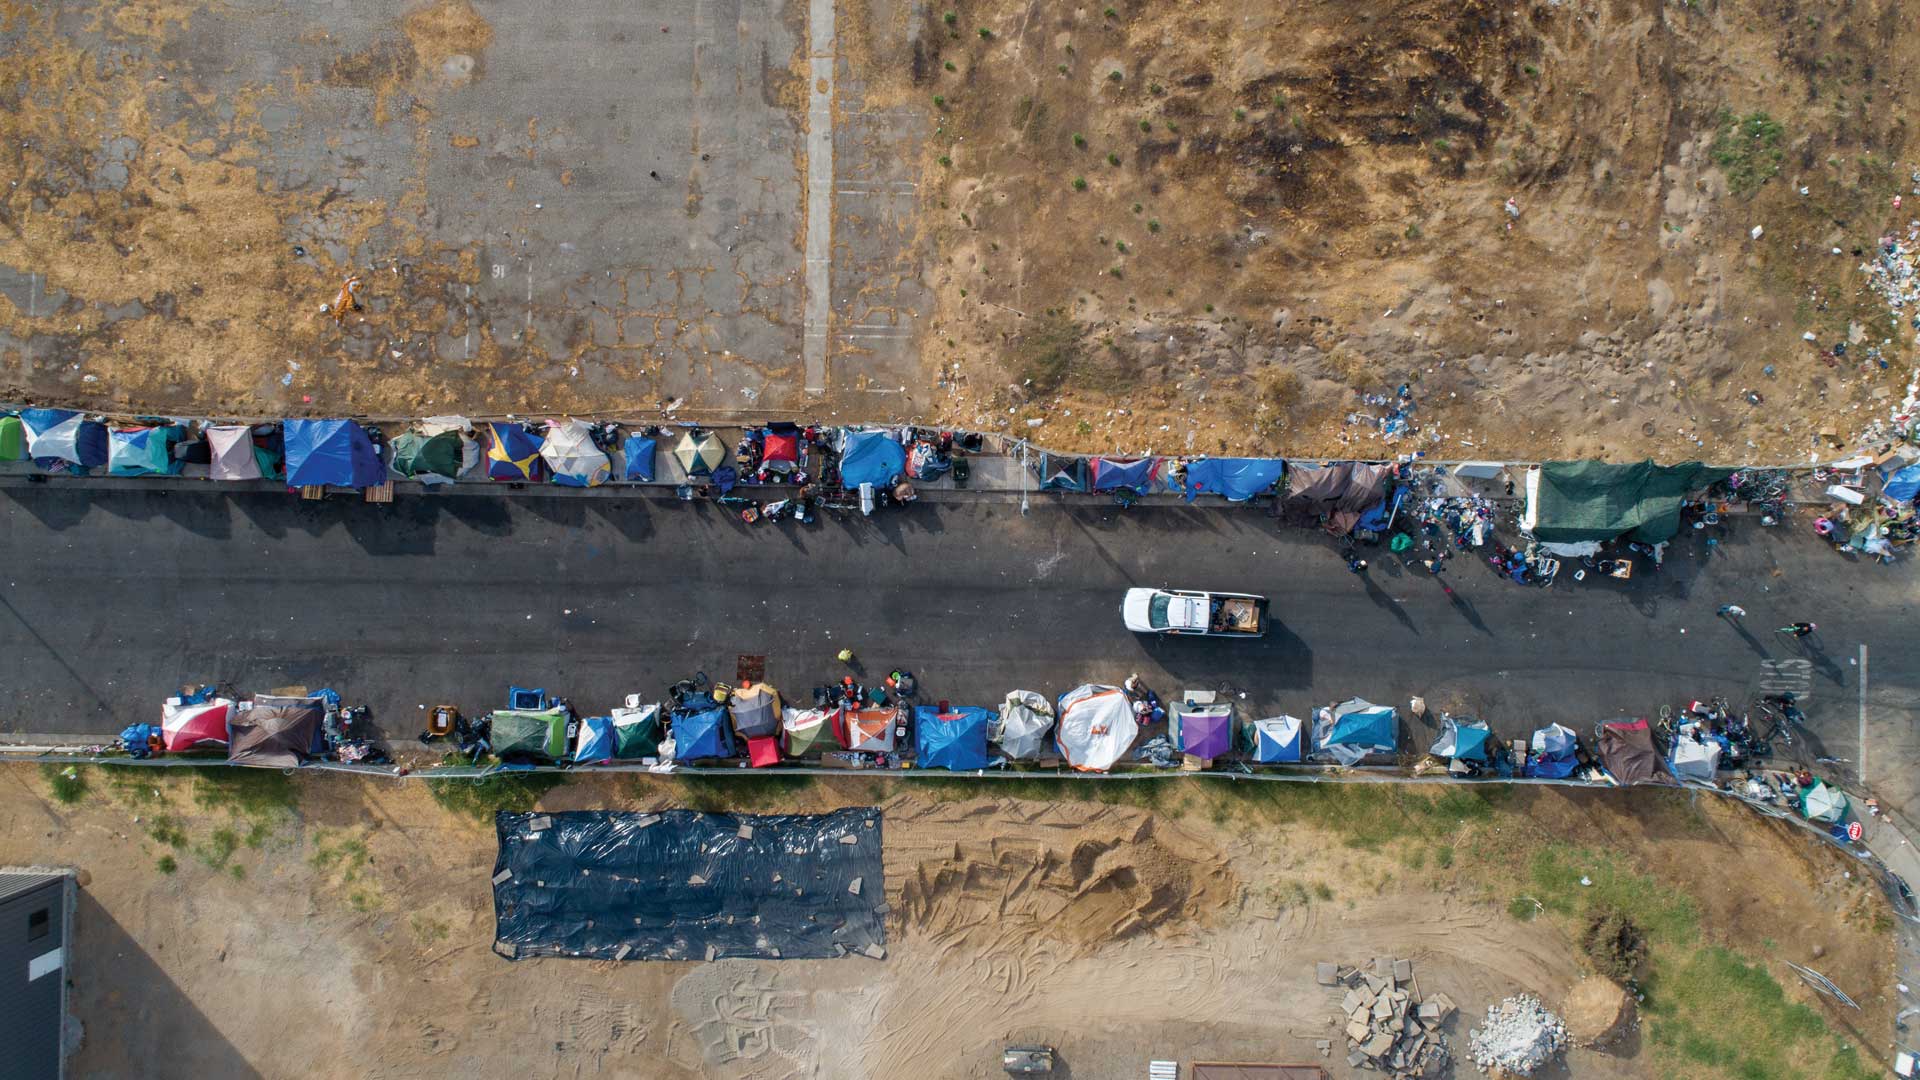
Officials scrambled to understand what was then a new threat and focused on vulnerable populations, including the area’s unsheltered population. As time went on and the true nature of the crisis became apparent, the county’s solution ended up helping reach hundreds of homeless people in need of shelter, essential resources, and medical services.
The work started in March when Alessandra Durham, a senior policy analyst with the Snohomish County Executive’s Office working in the Snohomish County Emergency Coordination Center, created the SnoCo Agencies for Engagement (SAFE) team to conduct outreach efforts. The SAFE team is composed of physicians, community paramedics, social workers, and law enforcement officers. The team spends time visiting unsheltered people to assess needs and connect to needed services.
To ensure success, the team took a targeted, data-driven approach supported by advanced technology. In the field, the SAFE team began using mobile apps powered by location intelligence from the county’s geographic information system (GIS) to identify exactly where specific services are needed. The information is shared in real time with other teams in any appropriate department for planning and decision making.
“A lot of times we’ll know what to do to help either mitigate or resolve issues, but having accessible real-time data has been really helpful in effectively deploying very limited resources,” said Durham. “Utilizing GIS has really helped us to better inform and target where we deploy evidence-based practices.”
In 2018, Snohomish County Human Services Department received a Data-Driven Justice Initiative grant. Launched in 2016 under President Obama, the initiative was designed to break the cycle of over-incarceration of vulnerable populations by aligning justice, health, and human services systems around real-time data. The goal is to identify frequently incarcerated persons and effective ways to divert them away from the justice system and into community-based services and treatment providers.

Nate Marti, planning and evaluation division manager of the Human Services Department, has been one of the key architects in developing a data-driven approach to community outreach. He says the grant opened the door for Human Services to begin leveraging location intelligence for the first time.
“The county has had experts using GIS products for years, but mainly within other departments,” Marti said. “Prior to 2018, human services really never touched the geospatial analysis that we’re using today.”
One of the first things Marti did was launch a pilot program to develop a baseline understanding of the county’s unsheltered population. They developed a field application that outreach teams could use to identify the locations and demographics of homeless encampments.
All the data collected was entered directly into the mobile surveying app, ArcGIS Survey123, and displayed visually on an interactive web map that could be shared with other teams within the Outreach Coalition.

For instance, the outreach teams collected information about potential hazards—such as needles or animals—at each camp, so support staff knew what to expect when visiting a location.
In another example, outreach teams would flag if any veterans were living in the camps. “Then we could deploy veteran outreach services to that encampment so they could receive the appropriate services,” Marti explained.
Any department could search for encampments that included the specific populations it served, such as the elderly; or it could filter for that information on the map to identify the encampments the department wanted to focus on.
When the pandemic hit Snohomish County in early 2020, staff within the Emergency Coordination Center knew they needed to act quickly to ensure the safety of one of the most vulnerable populations. “We were concerned about the spread of COVID-19 among our individuals experiencing homelessness, because oftentimes they’re living in tight situations like congregate shelters or encampments, where they don’t have access to sanitation resources or showers,” said Marti.
To properly deploy the right social services from the SAFE team, the first order of business was to understand the locations and demographics of the region’s current homeless population.
The outreach team included medical staff to provide assessment of any COVID-19 symptoms; a housing navigator to get people connected to housing resources; embedded social workers to link with behavioral health services; and staff from law enforcement, fire department, and emergency services.
The team sought a baseline understanding similar to what they gained from the pilot program two years earlier—but with an additional layer of data collected about how the population was being affected by the virus.
Marti said the previous experience proved key to getting the program off the ground quickly. Given the many different stakeholders, it was a feat that would have taken much longer without a collaborative technology like GIS.
“Because of our previous experience using Survey123 to collect homeless encampment data, we were able to develop a survey and deploy the application within five days,” Marti said.
Over two separate weeklong outreach periods in the spring, the team ended up contacting over 400 unsheltered individuals. The team members were surprised to find very few displaying COVID-like symptoms. Instead, the primary way they had been affected by the virus was in their access to essential resources like food, water, showers, restrooms, shelter, and medical treatment.
As parks, restaurants, and offices closed, the unsheltered population was left with nowhere to turn for basic amenities.

The outreach team used that insight to deploy specialized crews into the field to support people in need of behavioral health or housing assistance, for instance. The county’s Emergency Coordination Center also used that data to create hundreds of individual hygiene kits, which the SAFE team dispersed throughout the homeless community.
Marti says the app’s ease of use and real-time data-capturing capabilities proved essential during the early days of the crisis, especially among fieldworkers who had little experience using GIS.
“The team was able to easily input the information on a mobile app as it was being gathered,” he said. “And it’s real time, so there’s no lag in the data. Especially early on with COVID-19, we needed answers fairly quickly. This just provided a really easy mechanism to gather the information and then share it.”
Durham says that for those with a nontechnical background, one of the biggest attractions of GIS is its ability to democratize data. “The tools make information digestible and accessible to people like myself and to the county executive.”
The COVID-19 pandemic is not the first time the county has used GIS to support human services. The Snohomish County Opioid Response Multi-Agency Coordination (MAC) Group has also been using it to elevate understanding of how opioid abuse is affecting residents.
The MAC Group starts by collecting data from a number of different agencies including fire/emergency medical services (EMS), law enforcement, and social services. When any of those agencies responds to an opioid-related call, that data goes into a GIS-powered dashboard where it’s displayed on a smart map. If an emergency medical technician uses Narcan on an overdose patient, for instance, that data is automatically sent to the dashboard, so the team can see when the drug was deployed, demographic data about the patient, and where the event took place.
By using a GIS dashboard to analyze and display data, the MAC Group gains important insights about the extent of the opioid crisis in Snohomish County. The dashboard has also helped county officials effectively share information with the public, thanks to the universal appeal of maps. When actually seeing a map of the places where fire department and EMS or law enforcement staff have responded to opioid-related calls, people realize that no neighborhood is immune.
Durham said the biggest surprise for the public has been seeing exactly whom the epidemic is affecting. “It’s not only the geographic locations of opioid-related events but also the age range that this impacts. We see very, very young people and people into their 70s. Displaying the data visually helps the general public better understand the depth and breadth of the issue—that it’s not other people. It’s about them and their families as well.”
In addition to sharing information about the opioid crisis with the public, GIS empowers the county to be more proactive with response efforts. For instance, county leaders can identify locations with a higher incidence of use, and deploy intervention services to help prevent overdoses. With limited resources, targeted outreach is essential.
Marti believes that, given its wide breadth of capabilities, GIS has already become critical to the county. “It’s been two years since Human Services began using GIS, but I think we’re still just scratching the surface with the technology that’s available.”
Learn more about how cities use GIS to help the homeless.