


November 12, 2020 |
Patricia Cummens | GIS for Good
February 2, 2023
For many Americans, spotty internet access doesn’t just make it hard to stream a favorite TV show. Poor internet access is now an existential issue—grindingly slow access hampers school and work, makes it difficult to apply for jobs, and blocks access to basic services like banking and health care. The COVID-19 pandemic illustrated just how critical that access is, and how inequitable it is too: A system of private investment in broadband has historically left many communities out, creating stark divides often along racial and economic lines. Draw a broadband map of the US, and you’d see that the places with the worst and sometimes costliest connections often overlap with the poorest communities, where people already struggle with everyday needs.
As the bipartisan infrastructure bill promises to funnel billions of dollars to efforts to upgrade the country’s internet, a key first step is knowing where the upgrades are needed most. That means governments, nonprofit organizations, and advocacy groups have been busy making those broadband maps. To begin with, they help stakeholders—and the public—grasp where problems are worst.
“I go to the committee, and the first thing I put up are the maps,” said Selwyn Hollins, director of Los Angeles County’s Internal Services Department. “It’s one thing to say we know that people don’t have the internet, but when you look at where it’s happening that just speaks volumes.”
In Los Angeles County, the country’s most densely populated and the home of the nation’s second-largest school district, the problem is urgent. It’s estimated that one out of five students in the county still lacks high-quality internet connection at home, a problem that’s only exacerbated by existing economic, educational, and racial disparities. In LA, like many places, the pandemic brought the divide into stark relief, as schools closed, people worked from home and many others lost their jobs, all while trying to find social services and health care online.
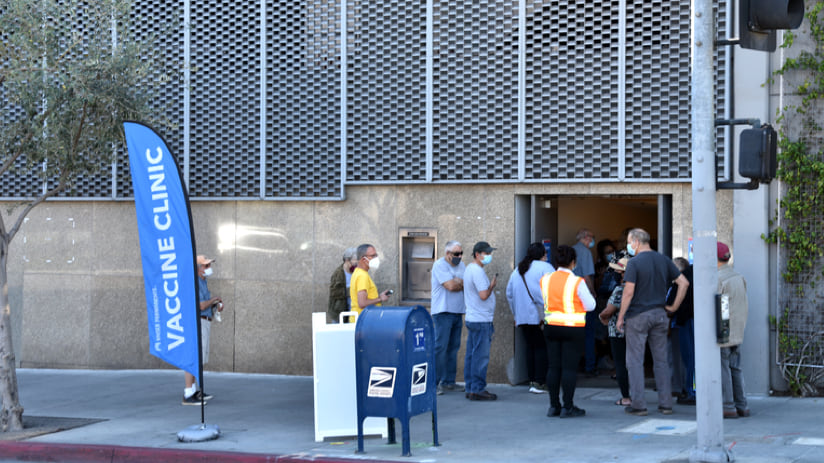
Last year, as local officials puzzled over lower vaccination rates in some poorer communities, Selwyn pointed to the map. “To register for a vaccine, you had to go online,” he said, “but they don’t have internet, or they’ll have internet on their phones, but they may have limited minutes, so they can’t spend a lot of time online.” A surge in unemployment led to more problems as people tried to find jobs. How do you do that? “You have to go on the internet.”

As COVID-19 further deepened the digital gaps and galvanized public awareness, Hollins’s department developed a county wide campaign called Delete the Divide, aimed at expanding access to computers and reliable, high-speed internet service. In presentations to lawmakers, he used maps to show why and where action was needed most.
“We took the areas where 20 percent or more of the households don’t have internet access, and then we layered that on maps with income level,” Hollins said. The overlap underscored that affordability is a basic barrier to broadband access. “In LA County, you have over 1.1 million households that earn less than $50,000 a year.”
For households with at least some access, the maps included geographic layers that show service quality and costs as well as demographics like income level and race. In Boyle Heights and Watts, more than one in four households is likely to experience similar struggles because they lack in-home internet connections, according to county census data. By contrast, all but about 3 percent of households in the heavily white and wealthy enclaves of Brentwood and Pacific Palisades are well-connected to the internet. In some cases, residents in lower-income communities tend to pay more on average than their wealthier neighbors.
“When I showed the maps to policymakers, everyone in the room was speechless,” Hollins said. “It’s like, here’s where it is, and it’s in your political district. How can we ensure that the efforts and the attention go to those gaps that you have in your district? And why is it like that? Spatial awareness enabled that conversation.”
Last year, the Los Angeles Board of Supervisors approved an unprecedented internet expansion plan, aimed at delivering wireless broadband to the hundreds of thousands of low-income households in Los Angeles County that currently don’t subscribe to high-speed service. As part of the multi year plan, the county is also laying the groundwork for administering a fiber network in partnership with existing providers and with the help of state and federal grants, a daring approach that would ensure reliable and affordable broadband for the county’s most vulnerable residents over the long term. Across the country, the hope is that public-oriented municipal networks could boost competition among internet providers, improve service, and drive down prices, without costly regulatory action. But that’s assuming they can get off the ground.

The ambition and scale of the project is larger than any existing municipal broadband effort. LA County contains 88 different municipalities with 9.8 million residents; 3.5 million live in the city of Los Angeles. One goal is to be able to provide 100 Mbps monthly service at no cost or low cost for low-income residents, and further offset that with a $30 discount from the FCC’s Affordable Connectivity Program, which is already helping residents pay for service. By next winter, the county hopes to switch on a part-fiber, part-wireless network across several neighborhoods, bringing low-cost or free internet to as many as 40,000 households. Eventually, a larger network will reach some 400,000 households who currently lack reliable, affordable internet.
Hollins’s department is in charge of coordinating the effort, leading a growing coalition of partners from government, education, business, and each of the local communities the network will encompass. Throughout the process, his team is using digital maps and geographic information system (GIS) technology to orchestrate, prioritize, and accelerate an unprecedented broadband build-out.
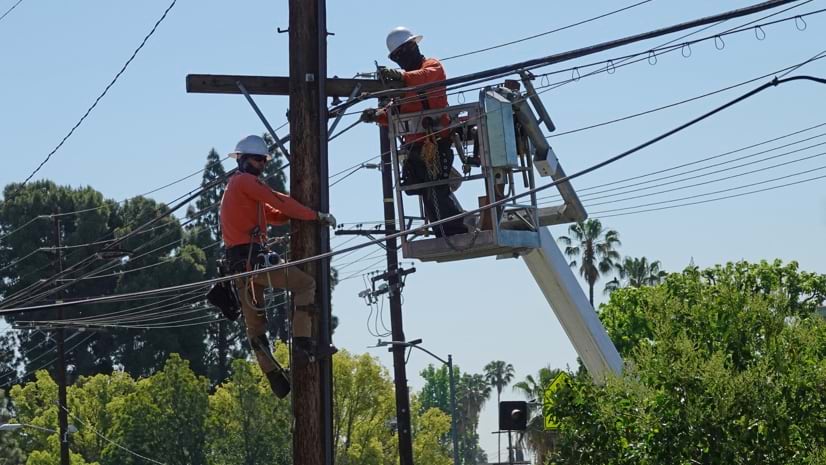
Along with rates of internet adoption and indicators representing the county’s racial equity and inclusion objectives, the maps show areas of opportunities for public-private partnerships and shovel-ready construction. By highlighting the locations of public assets across the county, managed service providers can place antennas and other broadband equipment on existing light poles and other municipal infrastructure and buildings, eliminating cell tower leasing costs and reducing construction costs and disruptions.
“All the consultants said we need $8 billion to do this. And I said, ‘No, you can do it for a fraction of that. Here’s the community, here’s what the map shows, these are the reasons why, and here’s how we’re going to do it. How can you lose?’” Hollins said.
Broadband, according to US estimates, is in the homes of more than 70 percent of people. But in the country that invented the internet, around 24 million people still can’t access it at high speeds or at all. And even more can’t afford it. Gaps in broadband service may be much wider. The FCC maintains a nationwide map of broadband access, but its data—mostly provided by ISPs—is notoriously slow and spotty. Many industry insiders believe the FCC’s method of counting underestimates the digital divide by as many as 20 million people. The result is that federal funding could bypass the areas that need upgrades the most and even further deepen the divide.
A multimillion, multi year federal mapping effort, based on a patchwork of data from around the country, will help inform the distribution of some $65 billion earmarked for broadband expansion that’s affordable, reliable, and equitable. But in many places, officials like Hollins aren’t waiting.
Detailed broadband maps help the county spend $56 million in new funding recently allotted for the networking project and will help officials request funds from California’s new $7 billion broadband expansion plan, $3.25 billion of which will go toward constructing a statewide middle-mile fiber network. Hollins expects the maps will eventually make the county more competitive for millions more in federal dollars, by showing how carefully it plans to spend on upgrades. “We will know what the real costs are,” Hollins said.
To begin engaging private partners and better understand those costs, Hollins has been working with his office’s GIS specialists to enhance the map to show where a public-private effort could build broadband fastest and with the greatest impact. By keeping track of a constellation of variables—like the physical extent of fiber-optic lines, service areas, the incumbency of various providers, the level of service provided, and the county’s physical assets—GIS helps show the optimal places and ways to build the basic network infrastructure. Maps like this, illustrating important nuances about how broadband service is distributed, can also bring more ground truth to conversations with incumbent providers.
Other local broadband mapping efforts have also shown how low-income residents often pay more for the same or worse service than neighboring communities in higher-income areas. A new report by the California Community Foundation and Digital Equity LA, a coalition of local community groups, found that, on average, a resident in a neighborhood with a poverty rate of more than 30 percent would pay $70 a month for 500 megabytes-per-second service while a resident in a neighborhood with a poverty rate of less than 15 percent would typically pay $54 per month for the same level of service.
The county’s broadband push may already be sparking more competition. In March, Spectrum, LA’s biggest internet service provider, launched in 41 states a new free and fast internet service plan identical to the one LA County plans to offer low-income residents.
Eventually, Hollins said the maps will be crucial for construction and upgrades, helping coordinate the complex orchestra needed for a once-in-a-generation build-out. GIS systems show the physical terrain, to help situate infrastructure most efficiently, with the least amount of material and digging. GIS will also help the department negotiate with the county’s corporate partners and track grant applications, bids, and other funding requirements while chronicling work progress, materials, and operation of the networks.

The spatial planning component of the public-private project, with its holistic view, will also better position the county to apply for federal grants, Hollins said. “Timing-wise, it couldn’t be better because of the infrastructure bill.”
Even before government funds roll in, Hollins’s department is using maps to engage the public, and bring more help to those who struggle to afford high-speed internet. More than 534,000 households in LA are currently enrolled in the federal subsidy program, but it’s estimated 1.6 million households are eligible. The department built a Delete the Divide website that offers residents guidance about how to apply for subsidies and resources like a map of open hotspots and an ArcGIS StoryMaps story that illustrates the county’s digital gaps. On a map dashboard, anyone can input an address and see the digital divide in real time, equipping residents with the information they can use to impact their path to a better internet.
“It gives citizens a tool where they can go to local politicians or schools and say, ‘Hey, this is what’s going on in my neighborhood,’” Hollins said.
No infrastructure projects can proceed without geospatial awareness. But in making the case for and charting LA’s unprecedented effort, Hollins said digital maps have been transformative. “I would say this was a game changer.”
Learn how carriers and governments plan equitable broadband expansion with maps and spatial analysis.