
September 24, 2020 |
After the approval of two COVID-19 vaccines in December, US states had to develop plans for distribution. The work started with determining who would receive the first doses while dealing with limited vaccine supply, overwhelmed and overcrowded hospitals, and a shortage of staff to administer shots.
In Pennsylvania, Kansas, and Montana health officials used geospatial technology to centralize all key information, map vaccine sites, and analyze data to plan an efficient, equitable rollout.
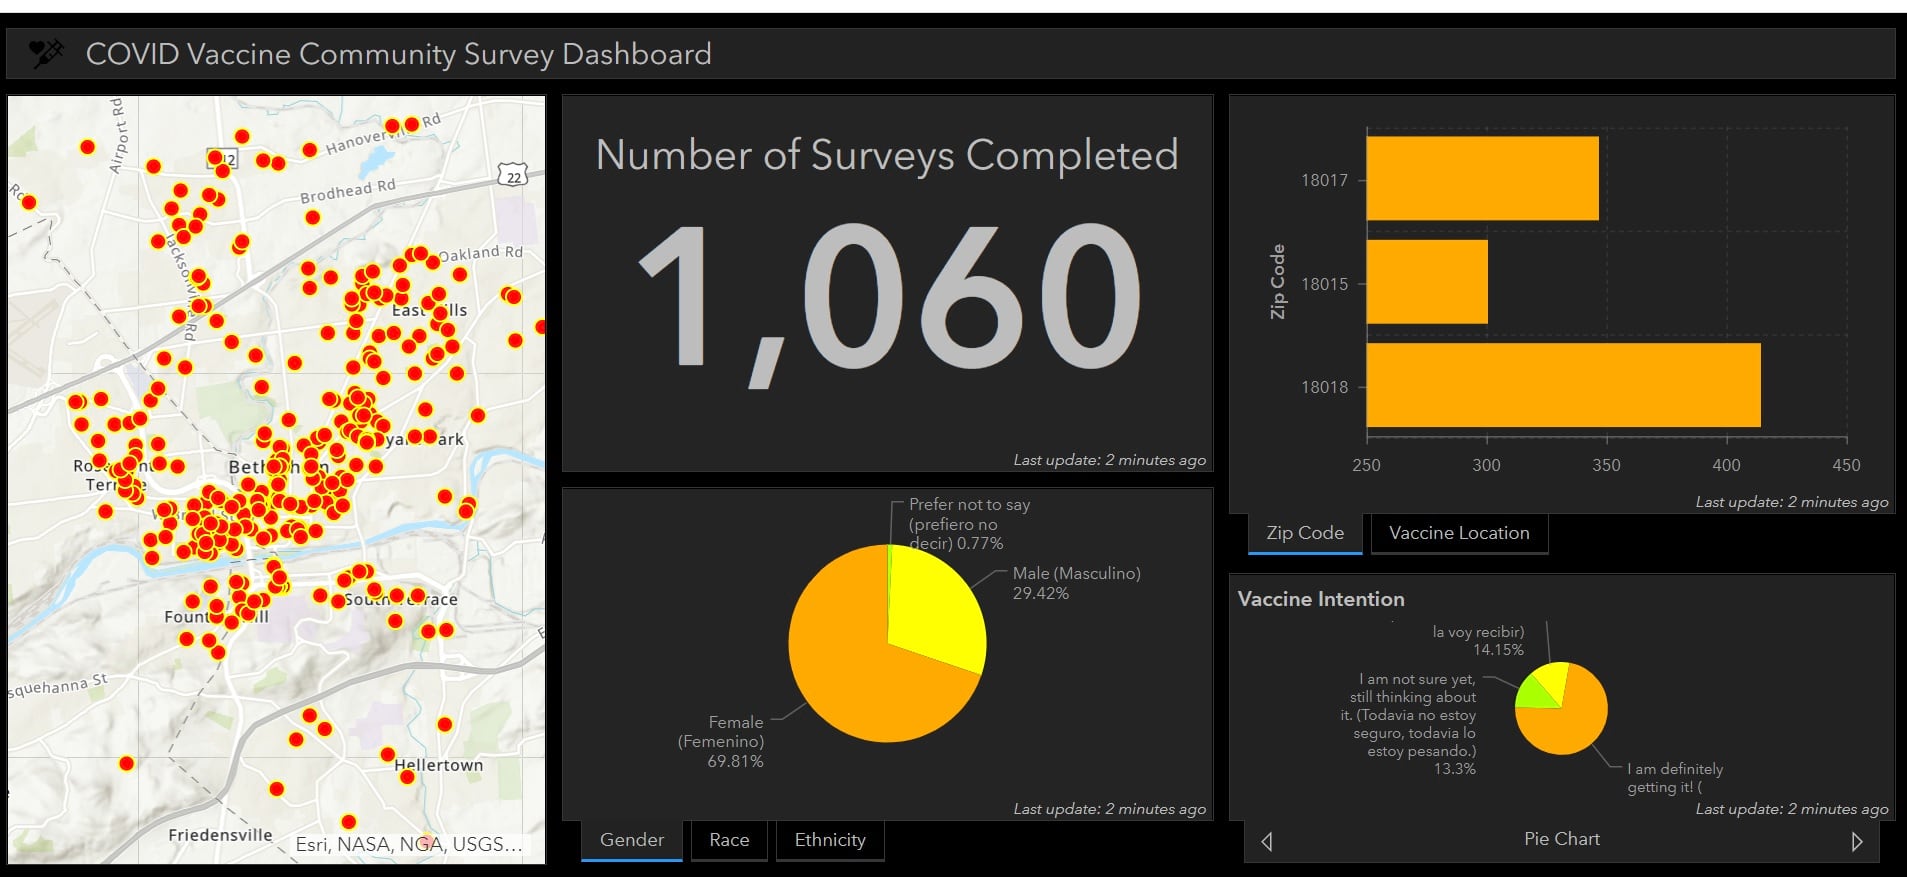
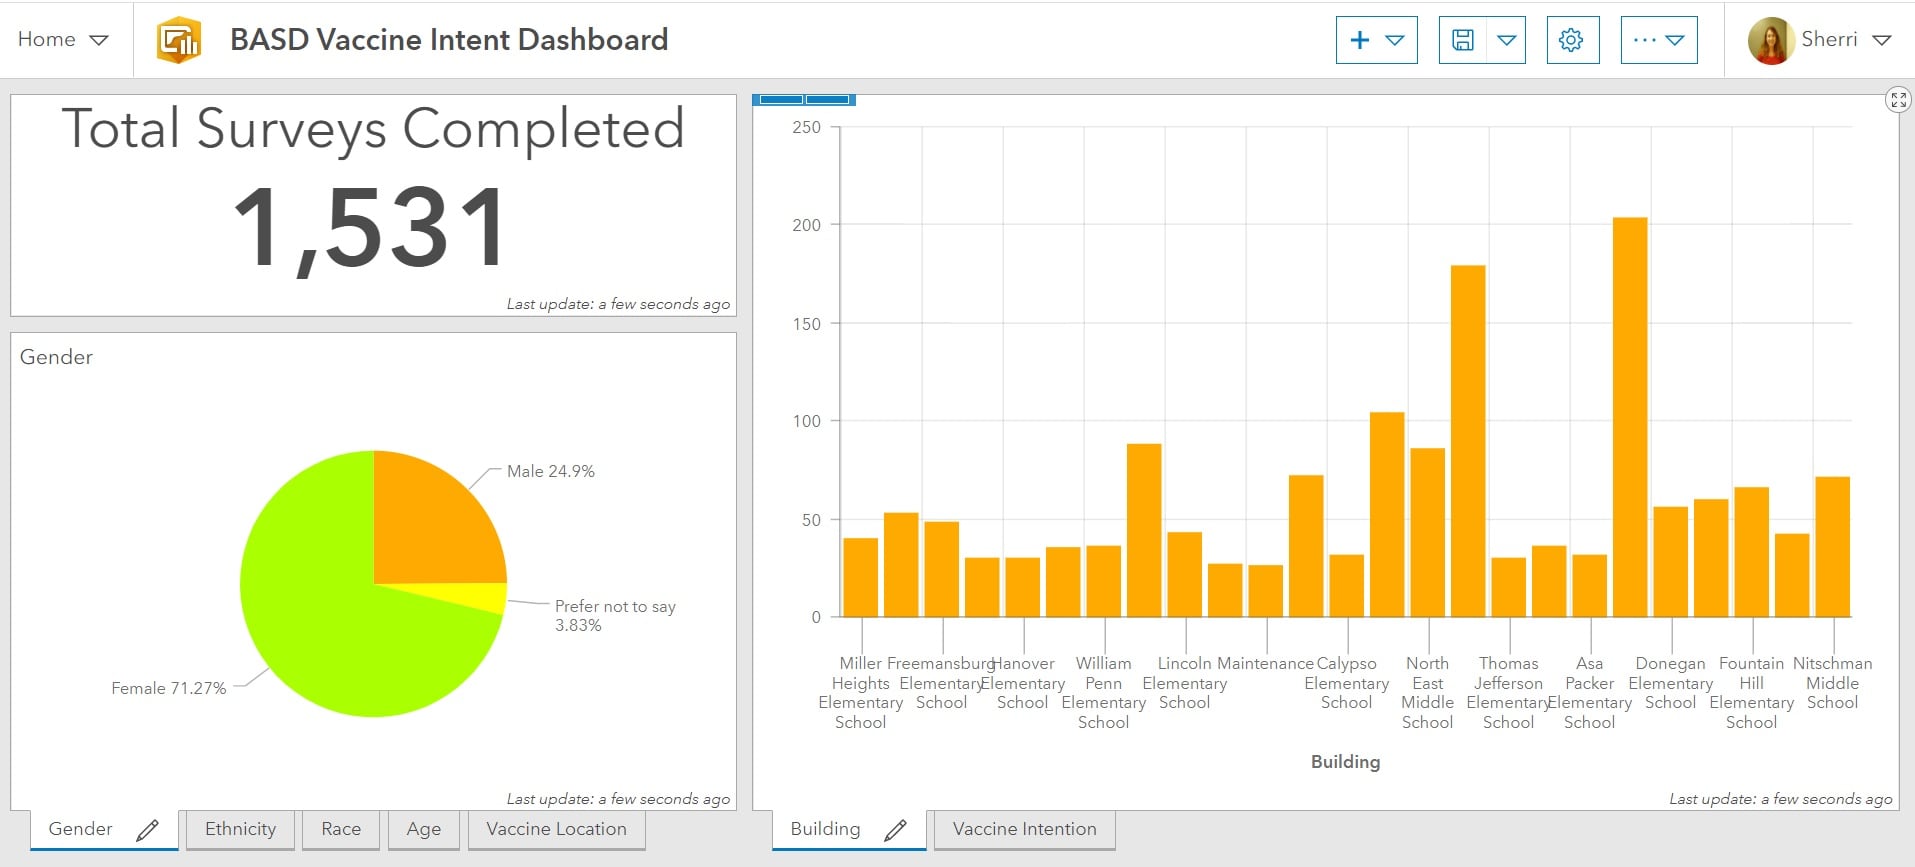
When Pennsylvania’s Bethlehem Health Bureau began receiving its first shipment of the vaccine for Northampton County, staff had a lot of work to do—set up vaccine clinics, communicate with residents, target eligible priority groups, and understand how many more doses to order. Sherri Penchishen, Health Bureau director of Chronic Disease Programs at City of Bethlehem, rallied her COVID-19 vaccination team to create dashboards and a survey to support this high-stakes effort.
“Successful distribution of the vaccine means mitigating this virus with herd immunity and returning life back to normal,” said Penchishen. Mapping county data with a geographic information system (GIS) is playing a critical role in distribution, giving Penchishen and everyone involved a holistic view of the situation.
To gauge local intentions to take the vaccine, Penchishen and her COVID-19 vaccination team created a community survey using ArcGIS Survey123. Survey data was fed into smart maps where it could be easily visualized to guide the Health Bureau in determining the size of vaccine clinics and deciding how much vaccine to order.
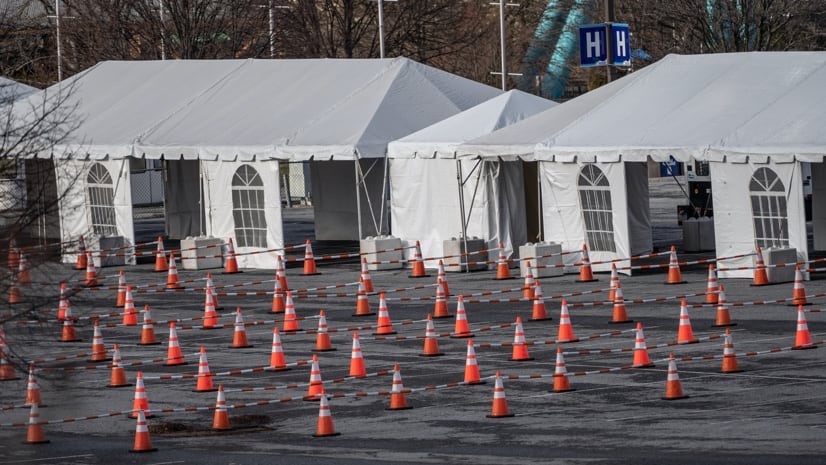
Bethlehem has both indoor and outdoor vaccine centers, with plans to have the outdoor locations administer the vaccine via a drive-through. Any potential vaccine site had to be able to accommodate an organized, efficient flow of people from registration through vaccine stations.
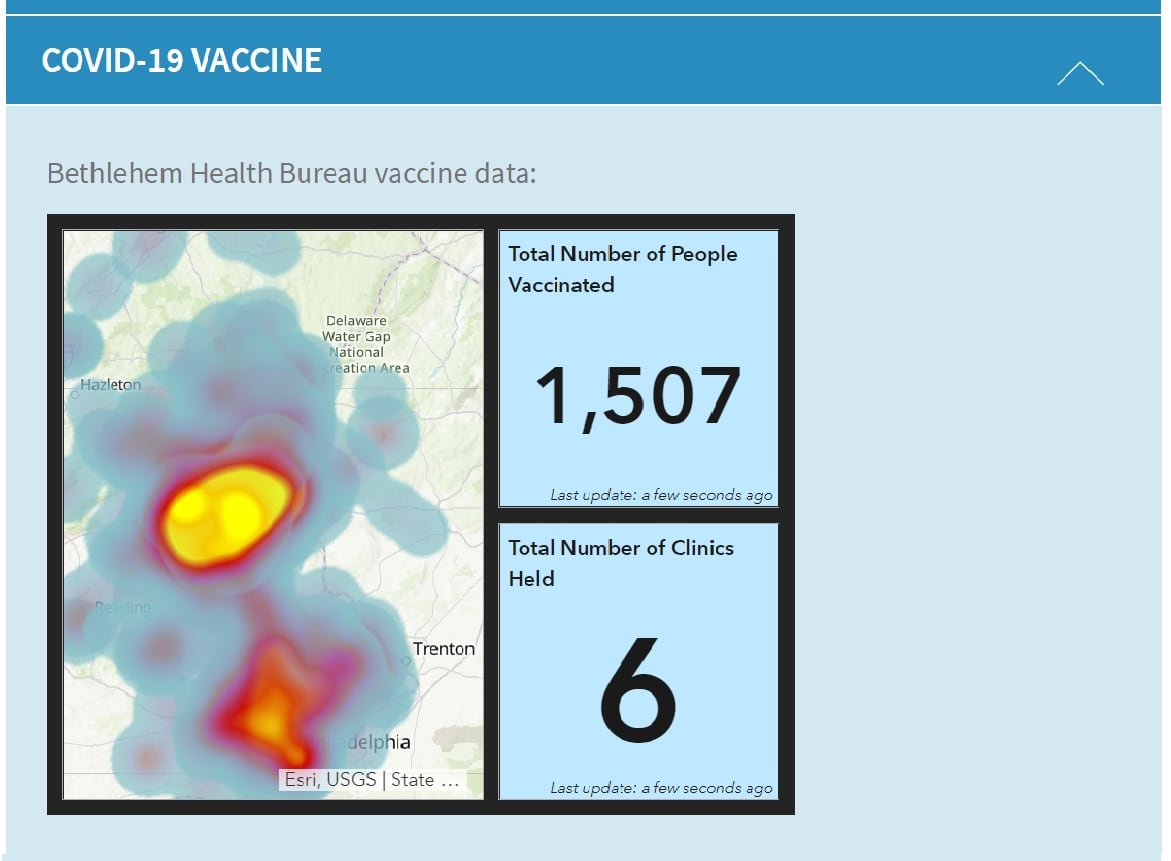
Penchishen and her COVID-19 vaccination team also created a GIS dashboard to show the number of people vaccinated, total number of doses administered by every clinic, as well as a map showing the locations of vaccine recipients. Penchishen recently added the second dose count to let the public know how many people have completed the series.
Another dashboard was created to inform the public of available vaccine sites—how many clinics are open along with how many doses each site has available.
“Geospatial data is important in this endeavor to assure all pockets of the population are identified and the vaccine is distributed in a timely fashion,” Penchishen said.
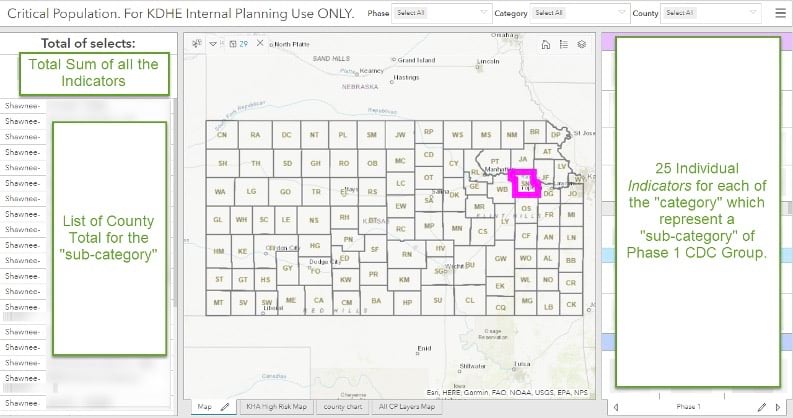
Throughout the COVID-19 pandemic, the GIS team at the Kansas Department of Health and Environment (KDHE) helped drive public awareness by creating maps of local cases and testing sites. When KDHE received its first vaccine shipments, the GIS team was tasked with helping to quantify who would be prioritized for doses.
“Because of the unknown factors in the allocation of doses, which is determined through the federal system, the vaccine staff needed a very quick and flexible manner to view the populations for priority vaccinations,” said Nolita LaVoie, GISP, a GIS database specialist at KDHE.
In response, the GIS team built a dashboard using ArcGIS Dashboards and hosted in ArcGIS Hub that quickly became a centralized resource for scenario planning. Vaccine staff use the GIS dashboard to locate priority populations and run what-if scenarios for specific counties or groups. This ensures distribution strategies account for a multitude of variables, key to encouraging participation from residents.

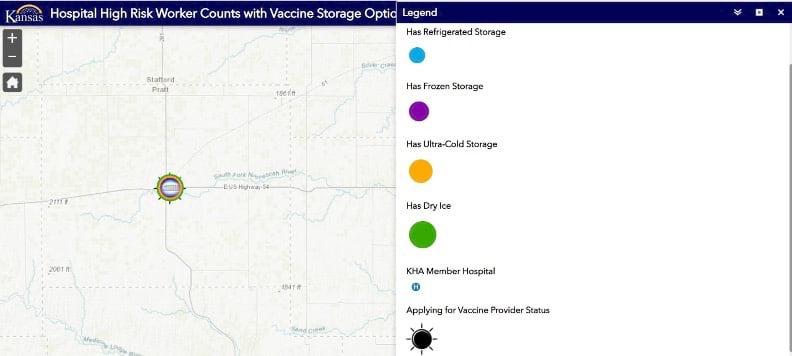
One challenge state planners encountered was that close to 26 percent of Kansans live in rural areas. Since the initial vaccine received by the state required ultra-cold storage and significant storage space, the decision was made to pre-position the vaccine at select locations.
The locations were selected based on their ability to manage the vaccine until it could be redistributed broadly across the state, including both rural and urban locations. The goal was to ensure vaccine availability to high risk healthcare workers across the entire state. Using the GIS dashboards, the immunization team was able to select appropriate locations and map redistribution routes for vaccine delivery.
“It’s tough to overstate the impact that geography has on vaccine distribution,” said Amy Roust, GISP, geospatial database administrator at KDHE. “You never want someone’s physical location to be a disadvantage when it comes to equitable access to healthcare.”
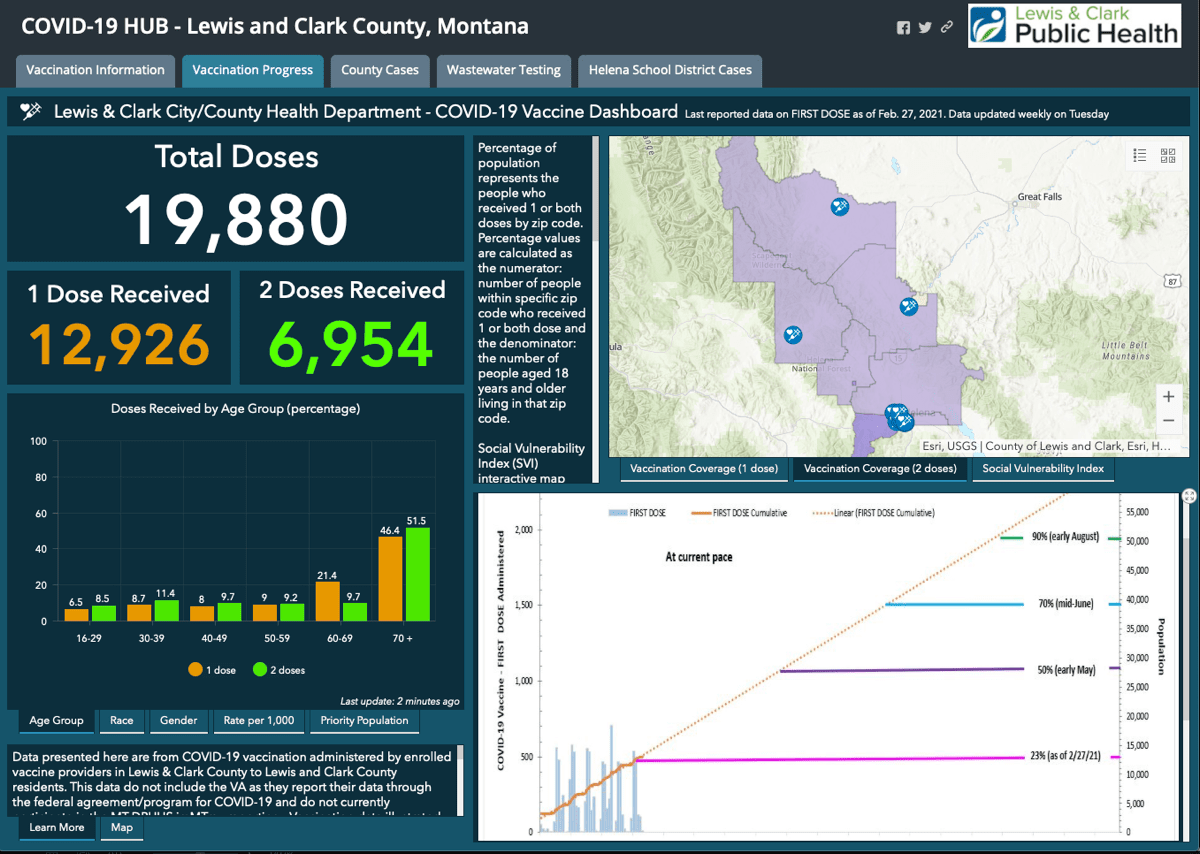
In Helena, Montana, the Lewis and Clark County Public Health (LCPH) department is striving to make data-driven decisions and proactively build an efficient process for getting “shots in arms” of its more than 69,000 residents.
“We want to make decisions with transparency about priority groups and the challenges we face as a county with opening vaccine access up to everyone,” said Tom Richardson, pharmacy clinical manager with St. Peter’s Health and county vaccination team member.
LCPH partnered with key stakeholders and local agencies for the rapid distribution of the 975 doses of vaccine it receives per week, identifying facilities ready for the task. LCPH staff carefully select dispensing sites and drive-through or mobile clinics, considering the unique needs of the community including limited access to technology and mobility challenges.
“Given the ongoing issues with limited vaccine supply, our local vaccine planning team has always understood the importance of being prepared for today and this week,” says Eric Merchant, administrator, Disease Control and Prevention Division, Lewis and Clark Public Health. “We have built capacity by establishing more than adequate point of distribution (POD) infrastructure and staffing.”
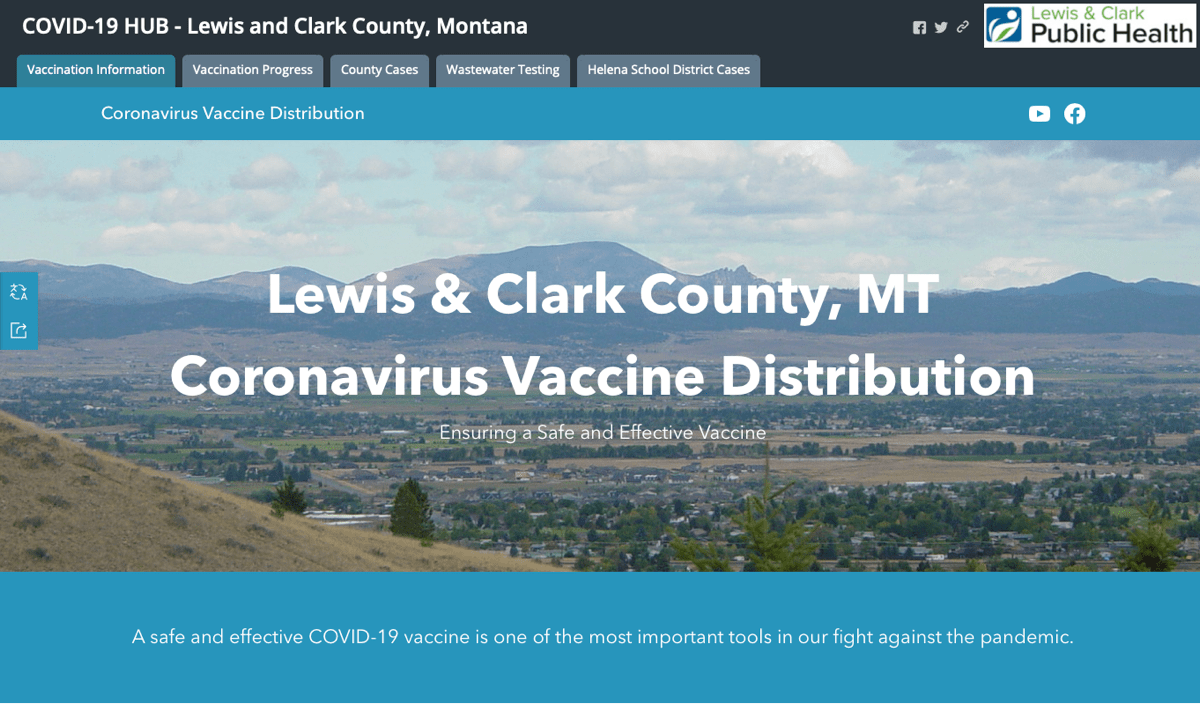
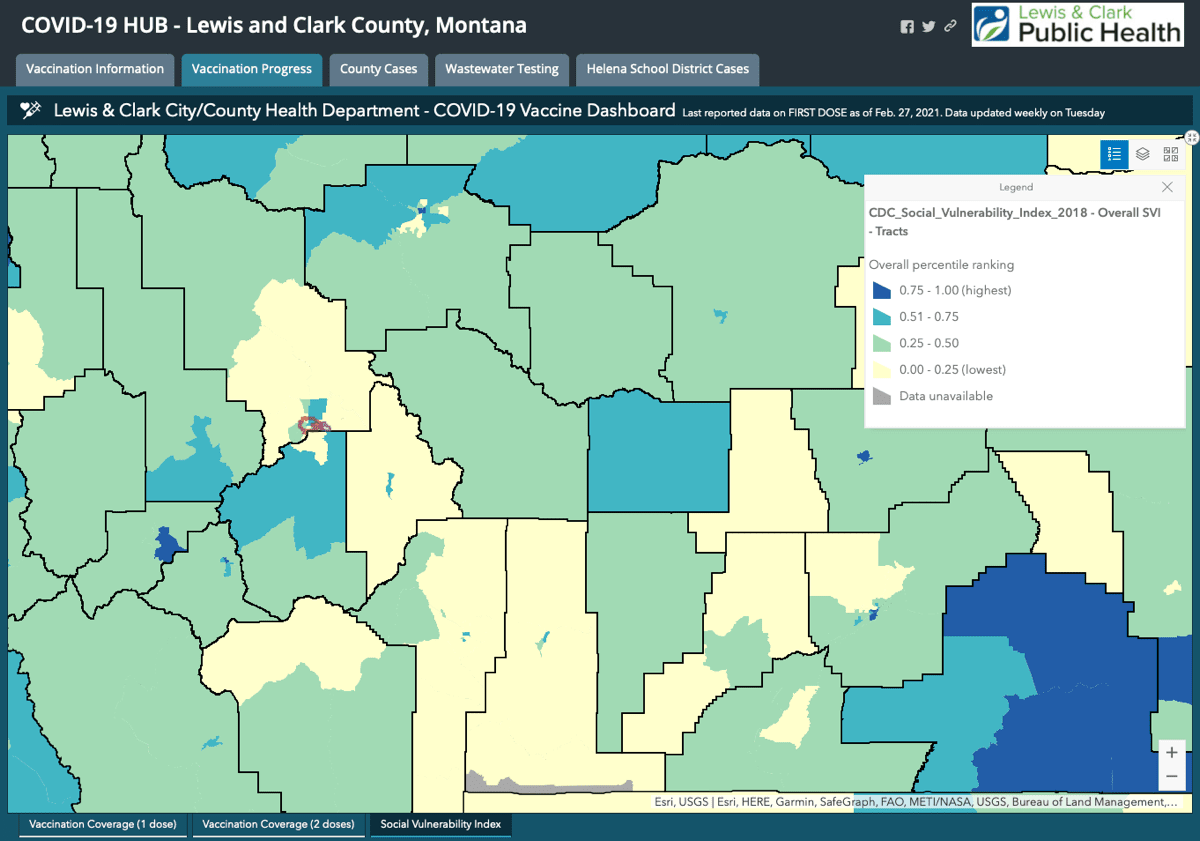
In mid-December, the LCPH team used ArcGIS Coronavirus Vaccine Outreach solution to create a vaccine distribution information website. The site became a one-stop source for all information related to the vaccine activities in the community, including tracking those who have received the vaccine and where. Data from the 2010 US Census is used to estimate the percentage of population that have received the vaccine by zip code in the county, explains Dorota Carpenedo, LCPH Epidemiologist, and data is displayed in map to get information at-a-glance.
“We display this information via interactive mapping application visualizing the vaccination reach for the first and second doses administered. This allows us to assess vaccination gaps in rural communities or communities that may be disadvantaged because of various economic factors,” Carpenedo said.
“We feel the importance of geospatial data is in our ability to show results,” adds Eric Spangenberg, GIS coordinator at Lewis & Clark County. “Showing the numbers on a map has an immediate impact on the reader.”
The communication hub site features maps to give county and health department officials a real-time picture of what’s going on in their area and make decisions accordingly. County officials can use the hub site to prioritize vulnerable residents.
“Just like in other parts of the country, Montana’s data clearly shows that people of color—specifically Native American and Alaska Native, and Native Hawaiian and Pacific Islander—have been disproportionately impacted by COVID-19, with higher rates of morbidity, mortality, and transmission,” Carpenedo explained. “The importance of the vaccine is hope.”
Esri provides a suite of COVID-19 vaccine distribution resources, including solutions, data, and information.

September 24, 2020 |

December 14, 2020 |

January 26, 2021 | Multiple Authors |