South Carolina National Guard Ramps Up Vaccine Support after a Year of COVID-19
By Ryan Lanclos and Este Geraghty, MD, MS, MPH, GISP
The South Carolina National Guard has been deployed for over 300 days supporting the state’s COVID-19 pandemic response efforts. In South Carolina, as with the rest of the world, there’s great urgency to distribute the COVID-19 vaccine quickly to bring an end to the pandemic. To that purpose, the leadership and troops are supporting vaccine administration in the state after having worked on related missions—distributing food and personal protective equipment (PPE), aiding correctional facilities, and supporting mobile testing sites.
“The South Carolina National Guard recently added mobile vaccination sites to our capabilities,” said US Army Major General Brad Owens, Assistant Adjutant General overseeing all of the South Carolina National Guard COVID-19 response. “We recognize that the faster we expand the public’s access to the vaccine, the sooner we can begin to see a reduction in the number of COVID-19 cases in the state—our healthcare infrastructure, economy, and overall way of life in South Carolina is depending on it.”
In addition to providing medical and logistical expertise, heavy equipment, and on-the-ground personnel, the South Carolina National Guard has engaged its analysts to guide COVID-19 response by using a geographic information system (GIS) to create maps, dashboards, and perform spatial analysis.
“Initially vaccines are controlled at the hospital level,” said US Army Lieutenant Colonel Garrick Messer, MD, South Carolina Army National Guard State Surgeon. “When we’re ready to start vaccinating the entire public, we’ll look at high-risk populations that should get the vaccine first. We’ll overlap that with case data to get down to the nitty-gritty on where to locate vaccination sites.”
The approach to vaccine distribution will follow a model similar to that of COVID-19 testing and medical supply distribution. “One of the first questions we asked was ‘where are the high-risk populations across the state?’” Messer said. “We looked at health factors such as diabetes and heart disease, access to care, those on Medicare.”
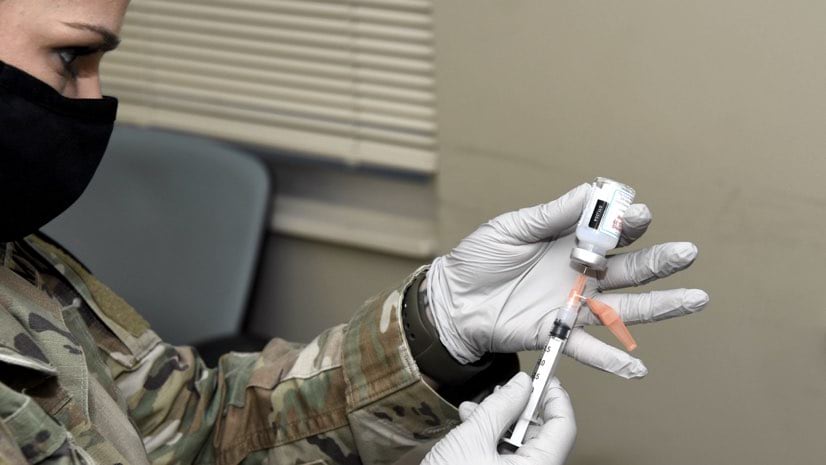
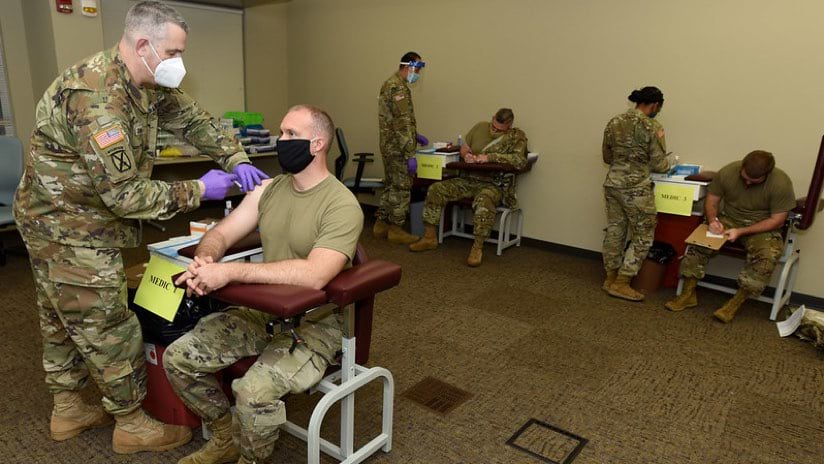
Troops received their first of two COVID-19 Moderna vaccinations on Dec. 30, 2020. (Photo by Senior Master Sgt. Edward Snyder, South Carolina National Guard)
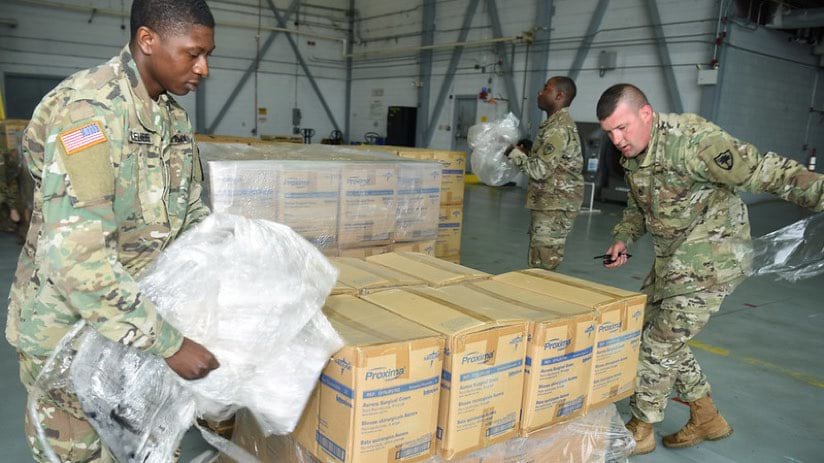
Soldiers unload a shipment of medical personal protective equipment received from the Strategic National Stockpile in March 2020, to be sorted and distributed to the 46 counties in the state in support of the COVID-19 response efforts. (Photo by Senior Master Sgt. Edward Snyder, South Carolina National Guard
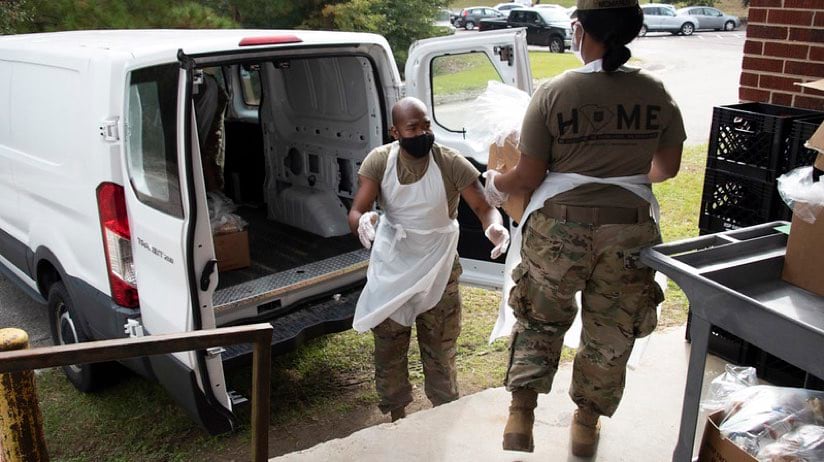
Troops help distribute food to support food banks. (Photo by Sgt. Chelsea Baker, South Carolina National Guard)
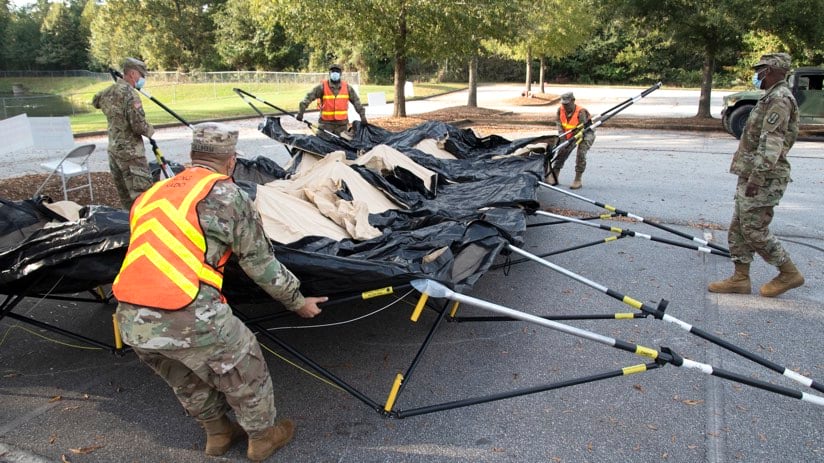
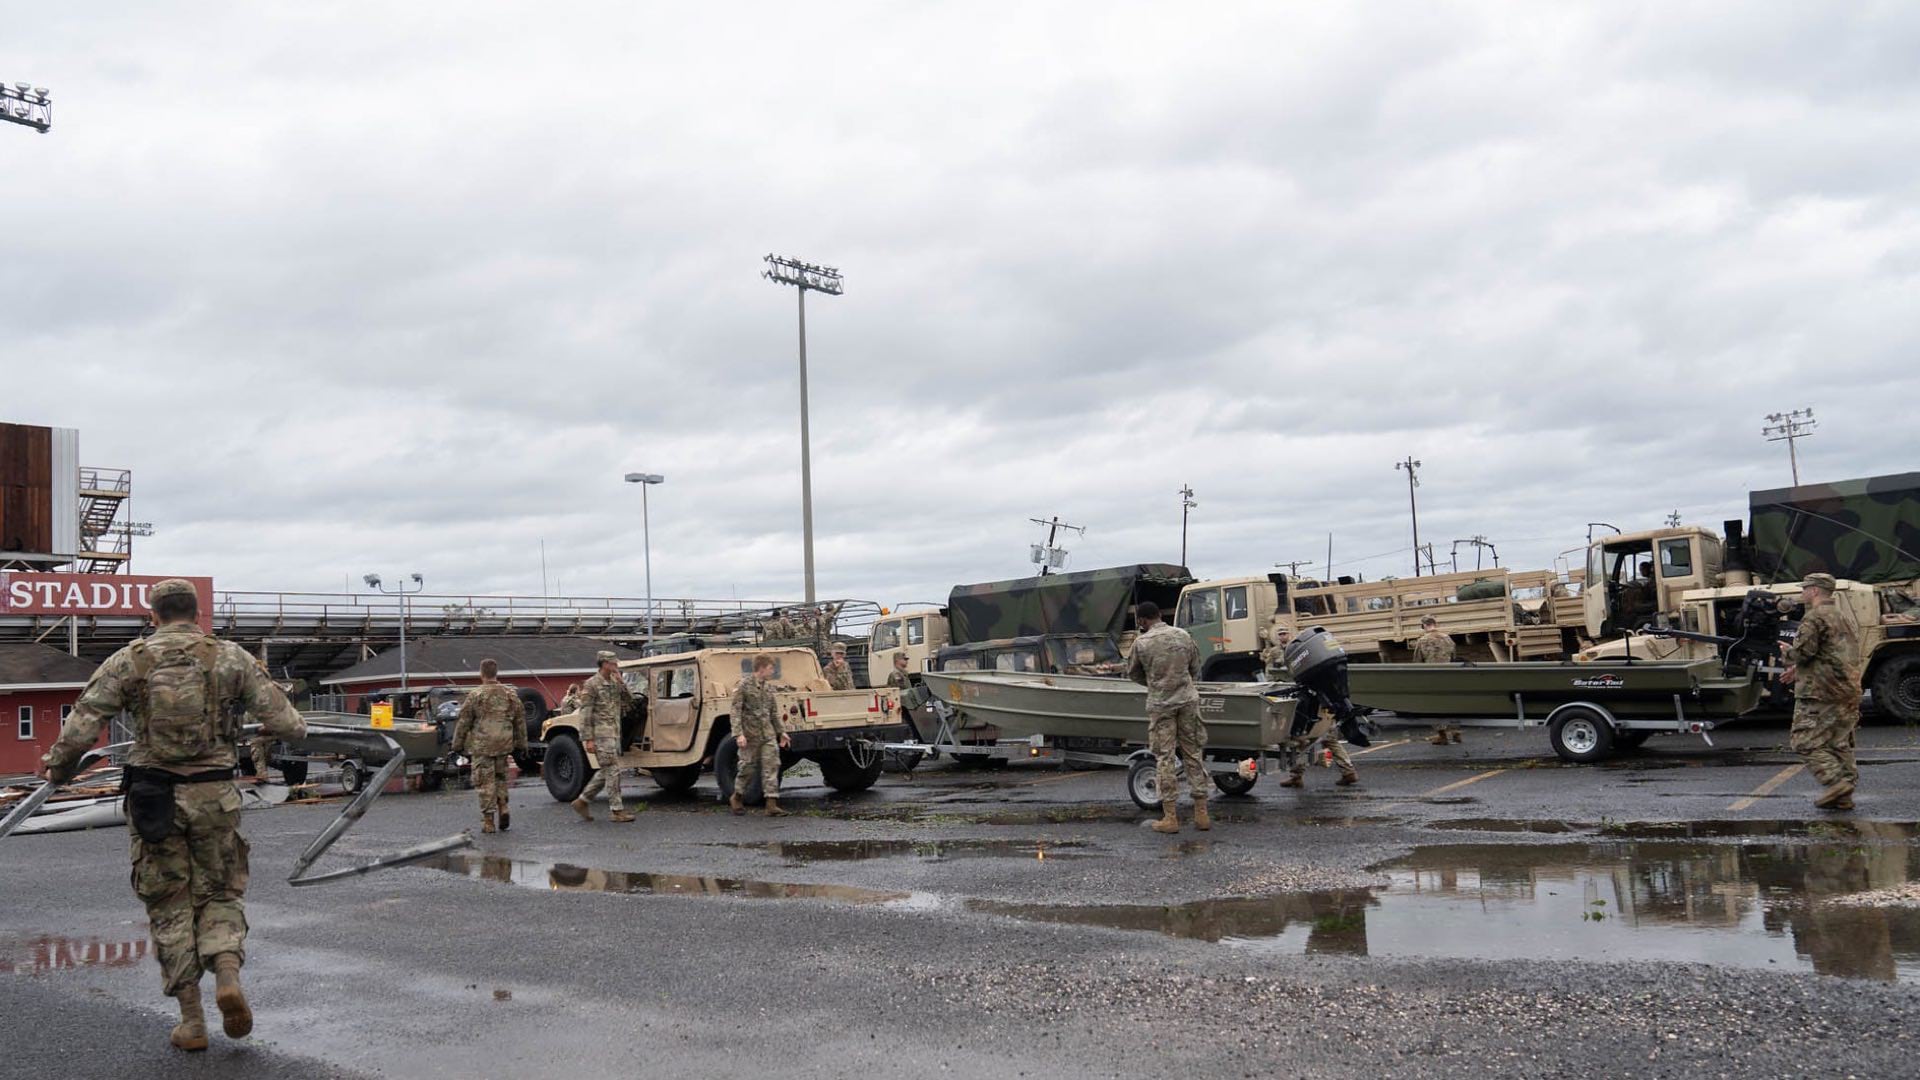
Troops set up tents, canopies, tables and chairs to help medical personnel at a COVID-19 testing site. (Photo by Staff Sgt. Brad Mincey, South Carolina National Guard)
When the pandemic hit in 2020, civilian GIS professionals Christy Jacobs and Kevin Haynes used GIS to create maps and dashboards to study many factors across four regions of the state—Lowcountry, PeeDee, Midlands, and Upstate—as well as individual counties to identify potential problem areas. Armed with that analysis, troops and medical teams were prepared when a surge hit the PeeDee region in the summer of 2020. They knew which areas had the fewest number of hospital beds per person and the highest risk populations in the state, and they quickly dispatched medics where they were needed most.
Operational Experience
South Carolina National Guard leadership has used GIS for more than 30 years for hurricane response, emergency situations, and even in combat.
“I was in Iraq in 2003 and 2004 in Al Anbar province—Fallujah and Ramadi—keeping the electrical grid safe and secure,” Owens said. “That province is bigger than the state of Texas, so it was quite a chore. GIS was used to see and reference impacts across the province, which was essential.”
GIS provides a similar situational awareness for South Carolina in its COVID-19 response.
“The only way we can sustain the fight is for us to have dynamic disease modeling,” Owens said. “Using the input from the CDC [Centers for Disease Control and Prevention], DHEC [South Carolina Department of Health and Environmental Control], and our own inputs has allowed us to really synchronize, collaborate, and coordinate the operation.”
Spatial analysis has been a key part of the South Carolina National Guard’s pivot from being expert emergency responders, responding mainly to storms, to its longer-term role as pandemic responders.
I’m being briefed three times a week, but I’ve relied on that dashboard almost hourly for more than 300 days.
Assistant Adjutant General overseeing all of the South Carolina National Guard COVID-19 response
Major General Stephen B. (Brad) Owens
“We’re good at hurricanes. We can alert 1,700 Soldiers in a couple hours and we can reverse lanes and move everybody off the coast in a matter of 36 hours,” Owens said. “For the pandemic, we’ve had to very quickly get to know some new partners.”
Knowing Hospital Capacity
Hospitals in South Carolina share details on capacity and bed usage in a central system. Jacobs, the South Carolina National Guard GIS program manager, led an effort to extract information from this source and display it on a shared dashboard.
“Multiple state agencies and outside entities are using the dashboard to determine which hospitals are reaching critical capacity and may be in need of assistance,” Jacobs said.
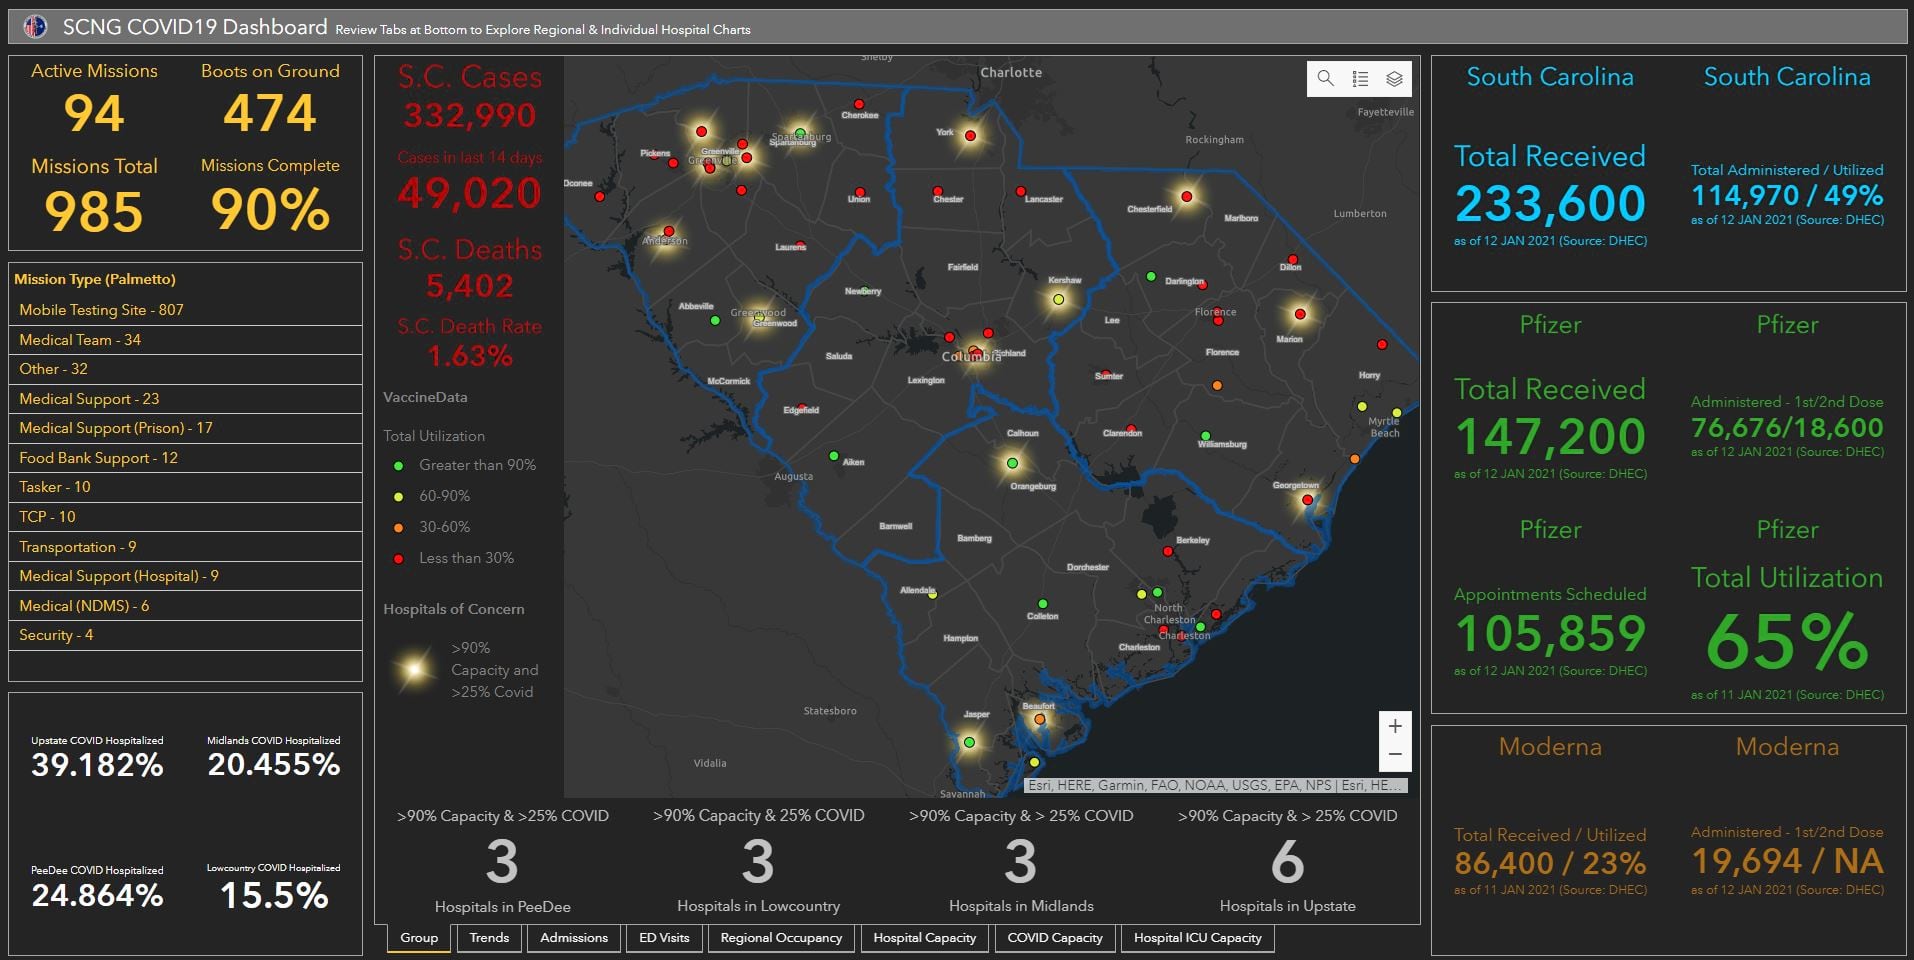
The hospital dashboard includes details about the numbers of patients versus the capacity of hospitals in different regions of the state.
A view of critical care facilities shows that capacity was almost full in the Pee Dee region in late April.
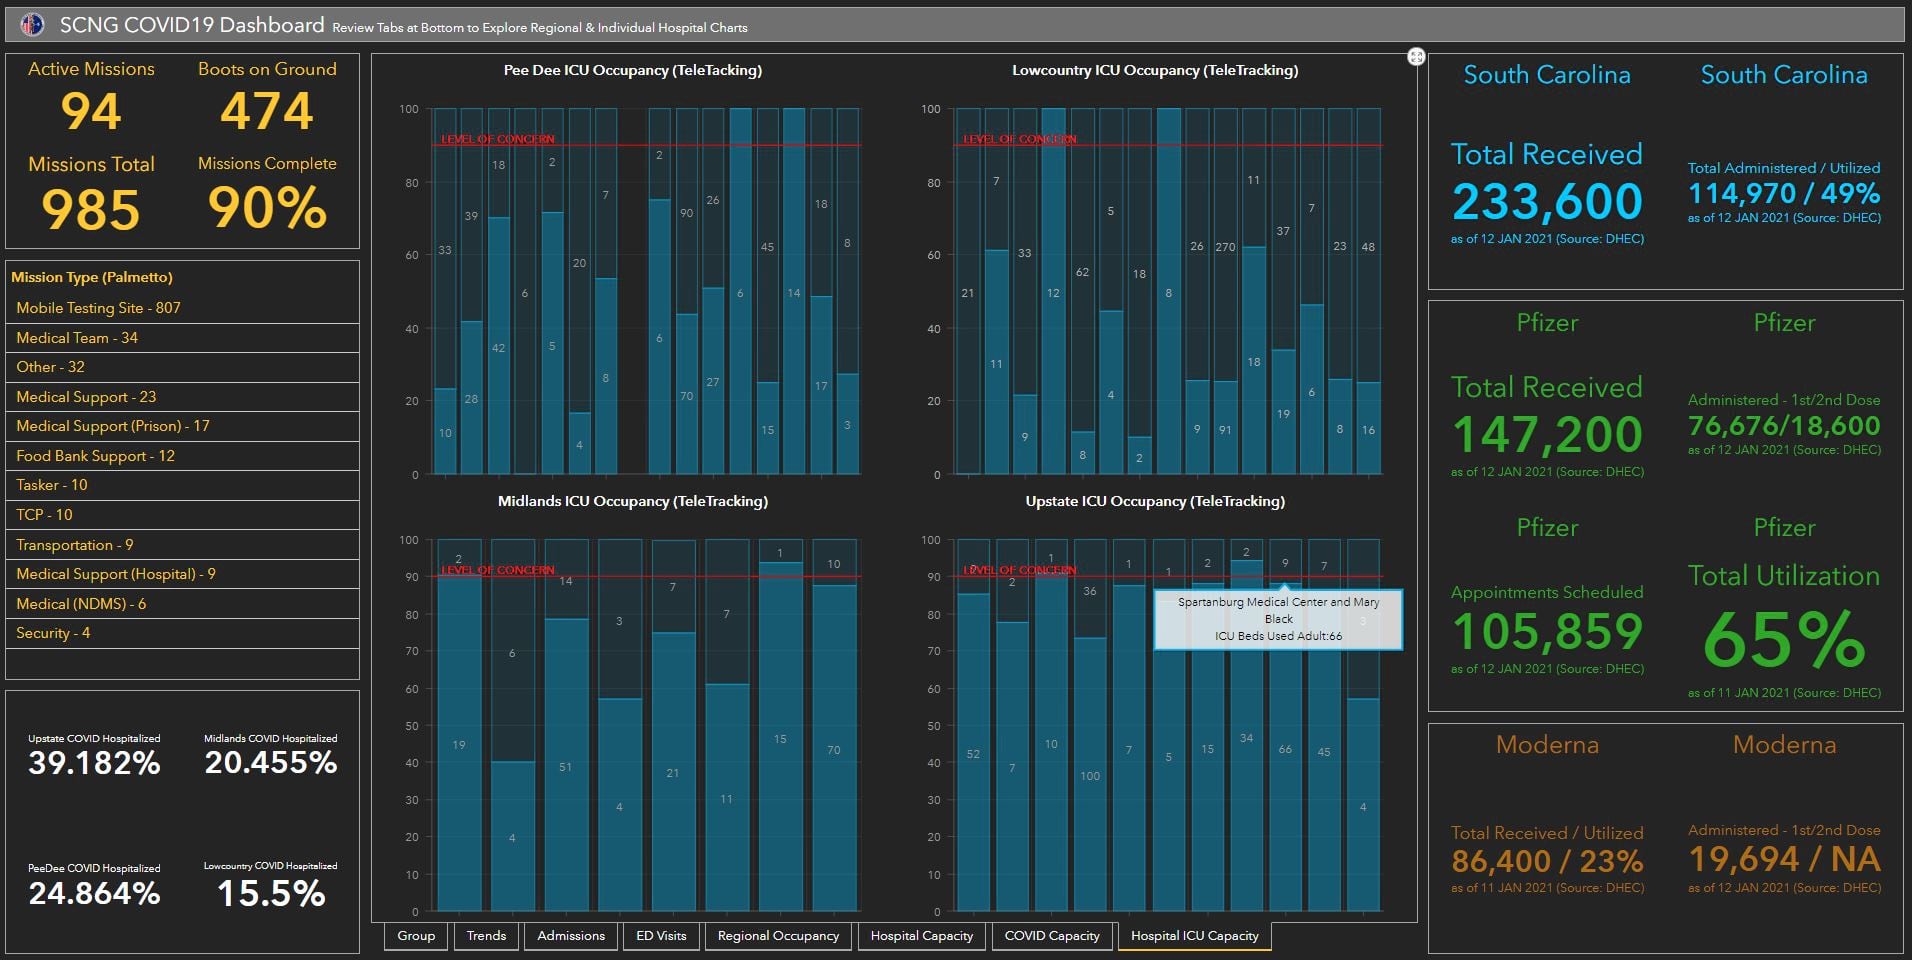
Tracking hospital ICU capacity and vaccines distributed illustrates the critical nature of the current mission.
The number of missions active and completed is presented here alongside hospital capacity sliders for key facilities in each region.
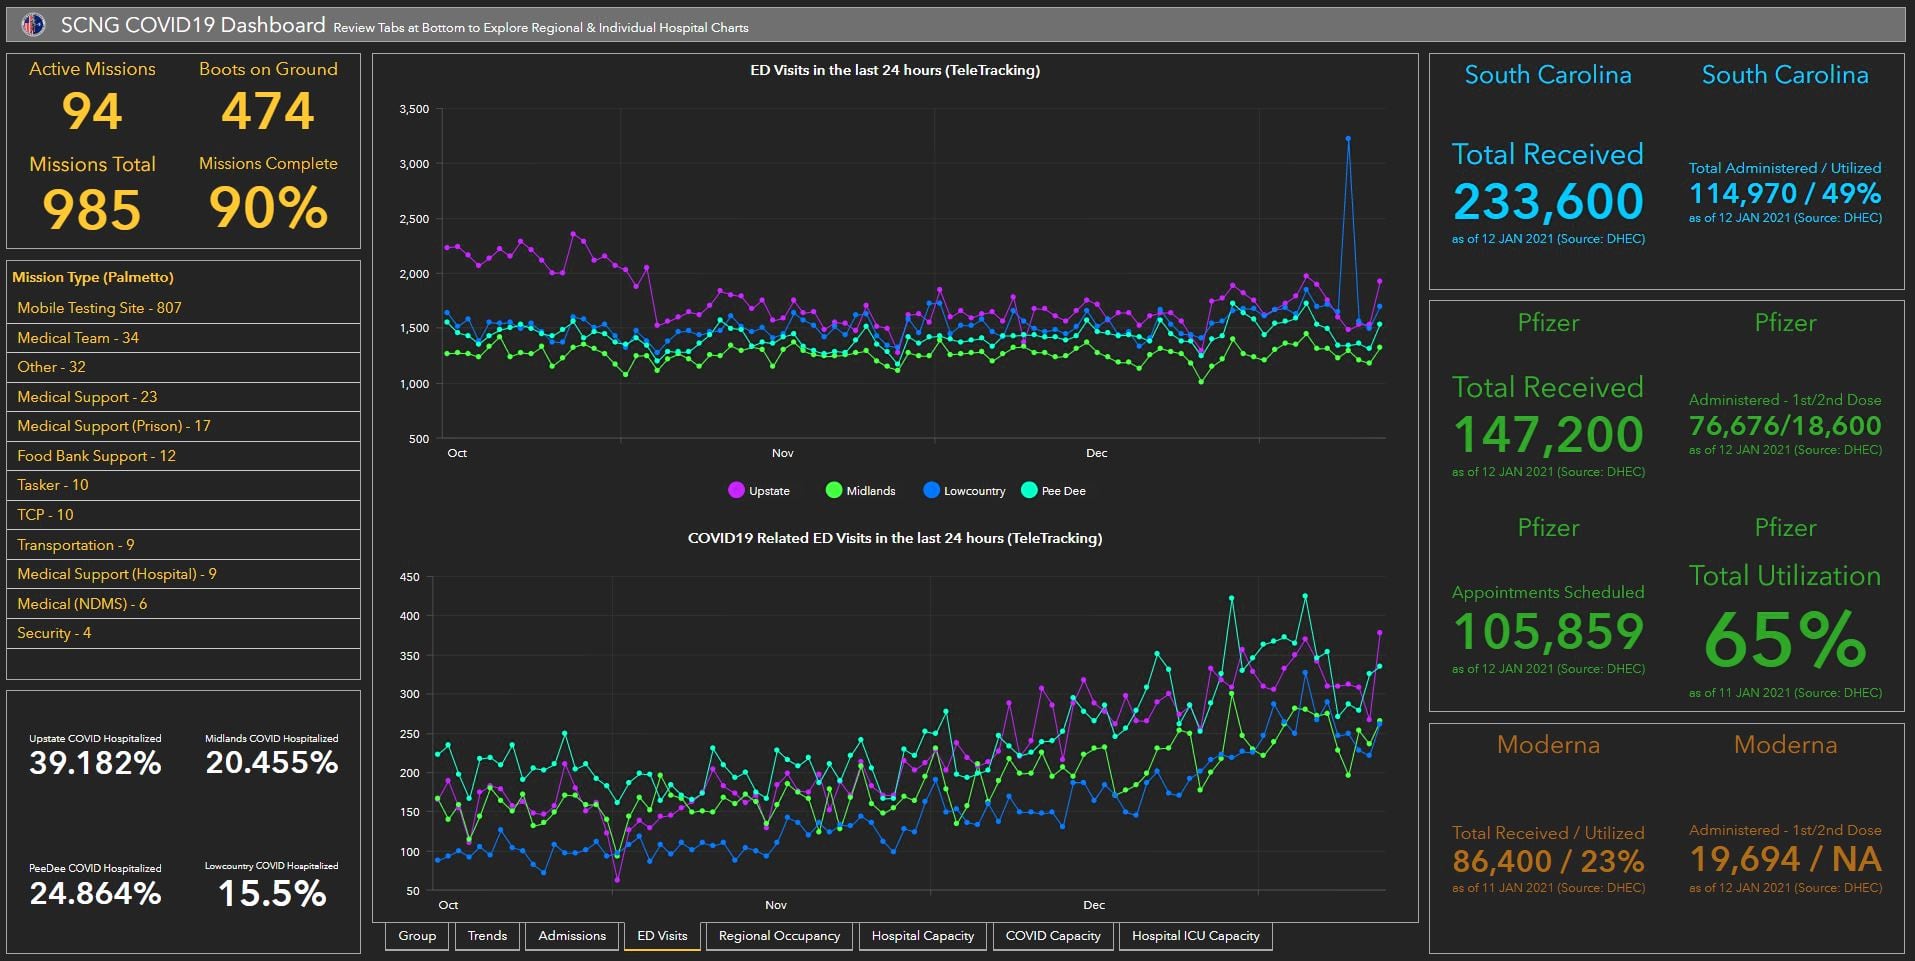
The dashboard includes a tab to see the number of COVID-19 visits in the last 24 hours in each district.
Haynes, a GIS manager on Jacobs’s team, conducted a space-time-pattern analysis to monitor counties where COVID-19 cases were increasing. The state COVID-19 task force, the hospital association, and county emergency managers all use the analysis and the corresponding hot spot map to monitor the spatial and temporal trends, such as where cases are increasing and decreasing.
“We used it to know when we could withdraw our medics from the hospitals, when they were past their peak surge, and we’re about to use it again to identify if we need to go back into some hospitals,” Messer said.
During the first surge, time was also spent determining possible alternate care facilities if hospitals had reached capacity.
“Back in July, when we hit the first peak, Christy Jacobs and the team did a fantastic job of identifying alternate care sites that we could open,” Owens said. “With the second wave coming through, we are still referring to that list.”
Delivering Testing Sites
Another large spatial analysis project that Jacobs and her small team tackled was to determine the best sites to conduct COVID-19 testing across the state.
“We used ArcGIS Business Analyst to conduct a site suitability analysis on every single county,” Jacobs said, “and provided the county emergency managers and the hospital association with the best locations for community testing sites.”
Since then, the National Guard set up an average of 20 testing sites each day, tearing them down, and moving to the next location. It has completed more than 800 testing site missions so far.
“Being a state with a large rural population, we have to ensure that we provide adequate and accessible testing,” Owens said. “GIS allows us to know where our hot spots are, where we’ve been, and where we need to go.”
A suitability analysis was used to determine the best location for COVID testing across the state.
An outbreak at long term care facilities is mapped to display the full picture across the state.
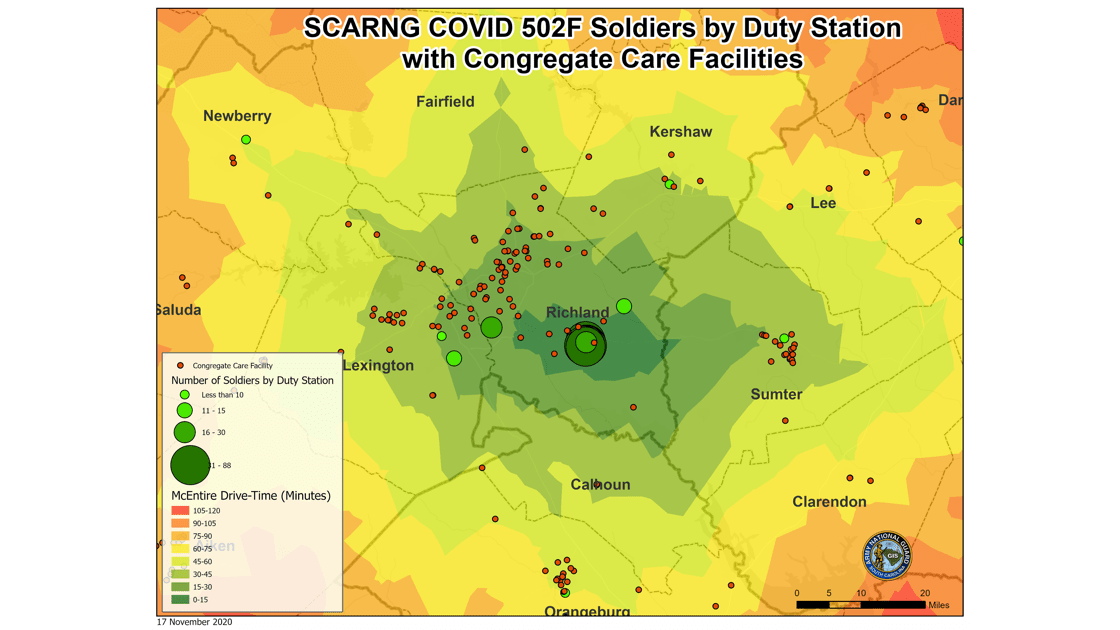
A map congregate care facilities displays the location and number of National Guard soldiers and their drive time each site.
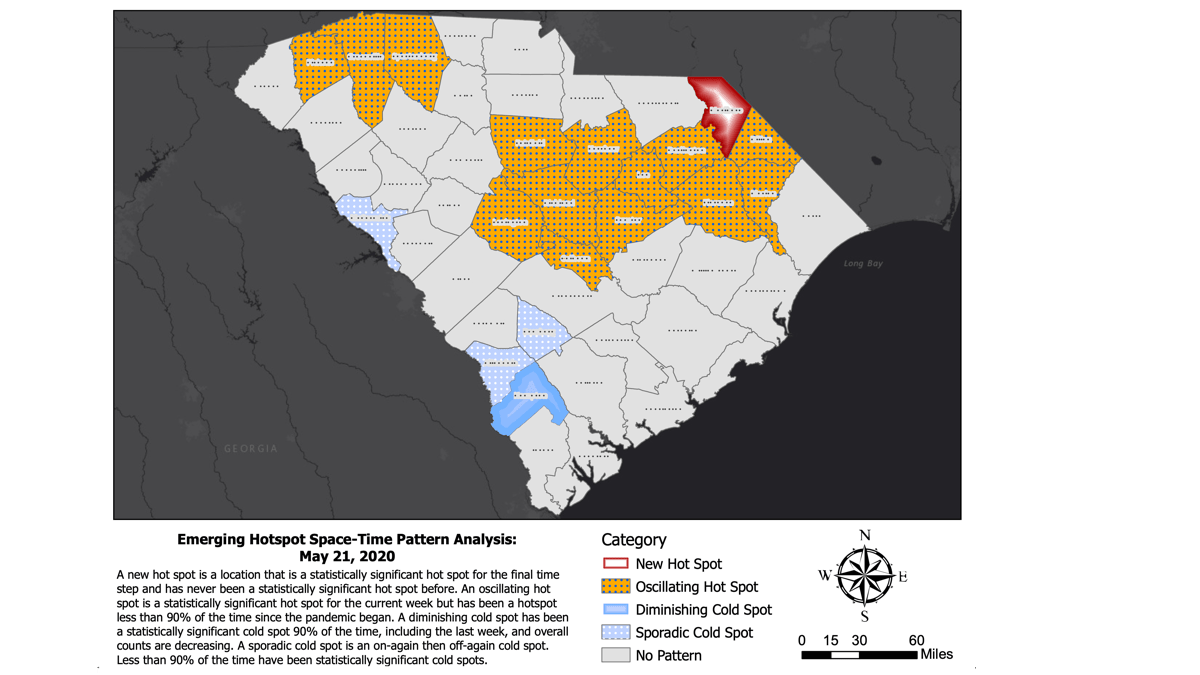
A space-time analysis of significant hot spots displays patterns of infection as of May 21, 2020.
In addition to an interactive health app, Jacobs and her team also created a dashboard that contains details about South Carolina National Guard missions, troop status, hospital status, vaccine locations, and relevant COVID-19 information. The dashboard is where they keep tabs on testing and how they share details with the South Carolina Emergency Management Division (EMD). The dashboard has been in place for some time, initially just focusing on hurricanes. Now, the data it displays has expanded as the demand for South Carolina National Guard troops has grown.
“I’m being briefed three times a week, but I’ve relied on that dashboard almost hourly for more than 300 days,” Owens said.
Overcoming Privacy Concerns
Many agencies and decision-makers in the state have witnessed the power of spatial analysis for the first time during the pandemic. The local-level insights often have seemed too good to be true. Questions about privacy and personal health information arose in consideration of all the big data and predictive analysis in play.
“We had to take a step back and obtain legal opinions on data use,” Jacobs said.
The pause was a big bump in the road, but it gave Jacobs and her team time to put data use agreements in place between different state agencies, the hospitals, and anywhere else they obtained or shared data. In the heat of the first wave, it was a matter of trust. Jacobs also took a close look at data layers and set rules about which layers can be placed on top of each other to create maps.
“With COVID-19, data is evolving every single day, and we’re making new data layers every single day,” Jacobs said. “We’re compiling hundreds of data layers. We have data on prisons and nursing homes, schools, and manufacturing facilities. We have so much data out there now that we have to be safe and be aware of the privacy concerns.”
After the lawyer’s analysis, no data use and sharing concerns were identified, and the GIS team went back to work.
“Nothing we’ve done released personal health information because the most micro we have gotten in our analysis is at the ZIP code level,” Messer said. “We’ve just used the data and analysis in a different format than people have been used to, a format that’s easier to tell a story.”
Throughout all phases of response and for ongoing missions, the use of GIS has gained momentum.
“It took time for the planners to realize the valuable resource that GIS had become in terms of the maps, dashboards, and analysis,” Messer said. “Now, I don’t think there’s a briefing where we’re not using tools or data analytics from Christy Jacobs and her team.”
With a focus on vaccine distribution and ending the pandemic, it’s too soon to look back on response efforts. However, Owens and others have long noted the value of situational awareness in any crisis.
“We always say that we’re going to analyze the past, we’re going to anticipate the future, we’re going to partner in the present, and then we’re going to celebrate our heroes at the end,” Owens said. “When we analyze the past, we quickly fall back on the need to have a common operating picture with shared situational awareness.”
The crisis management capabilities of GIS have opened some eyes to how it can be used on an ongoing basis.
“I never knew about GIS before all this, and it’s a whole new data-driven way of looking at COVID-19,” Messer said. “At this point, it’s the only way we look at it.”
Ryan Lanclos is Esri’s Director of National Government and Public Safety Solutions. He helps organizations apply the science of geography and geographic information system (GIS) technology to make a positive impact in the world. Ryan is a subject matter expert on the use of GIS for emergency management. He is an appointed member of the Federal Emergency Management Agency National Advisory Council, a representative member on the United Nations Working Group for Disasters, and a member of the Group on Earth Observations Disaster Risk Reduction Working Group. At Esri, he leads the Disaster Response Program where he has helped thousands of organizations around the world respond to crises of all types and sizes. Ryan previously served as Missouri’s first Geographic Information Officer and GIS Advisor for the Governor’s Homeland Security Advisory Council, and as the Director of State and Local Government Programs for the National Alliance for Public Safety GIS Foundation. Ryan holds a Bachelor of Arts in geology from Centenary College of Louisiana, and a Master of Science in cartography and GIS from the University of Wisconsin–Madison.
Dr. Este Geraghty, the chief medical officer at Esri, leads strategy and messaging for the health and human services sector. With Esri since 2014, she leads business and solution development and has helped organizations around the world use location intelligence to meet a range of health challenges, including enhancing strategic planning and optimizing health-care access during the COVID-19 pandemic. She is a former deputy director of the Center for Health Statistics and Informatics with the California Department of Public Health and an associate professor of clinical internal medicine at the University of California at Davis. Geraghty holds advanced degrees in medicine, medical informatics, and public health and is also a board-certified public health (CPH) professional and a geographic information systems professional (GISP).