
May 24, 2018 |
Terry Bills | Infrastructure
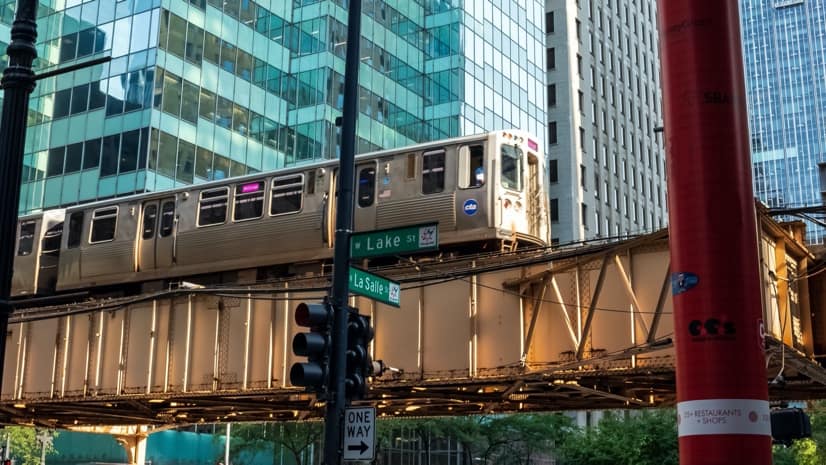
After a nearly four-month pandemic lockdown, the State of Illinois is taking tentative steps toward reopening the economy. In the coming months, it’s anticipated that transit ridership will begin to rise again as as some non-essential employees return to their workplaces. For the Regional Transportation Authority of Northeastern Illinois (RTA), that means strategizing with the Chicago Transit Authority (CTA), Metra, and Pace Suburban Bus (the Service Boards) to communicate with riders on the second largest public transit system in the country.
Throughout the pandemic, the RTA has been responsible for providing updates about how COVID-19 has affected ridership, service, and revenue for the region’s public transportation system to a broad group of stakeholders and the public.
Brad Thompson, manager of Data Services and Analytics at RTA, and Hersh Singh, principal analyst, developed a dashboard for this purpose. For more than 15 years, Brad and his team have been using geographic information systems (GIS) to support decisions about planning projects, maintenance needs, revenue sources, and fund allocation. They use the geospatial platform to pull data from numerous different internal and external sources, then visualize it with maps, graphs, and other storytelling tools.
In response to COVID-19, the team launched the COVID-19 Transit Dashboard as a way to easily share daily and monthly data with public officials at the local and state level.
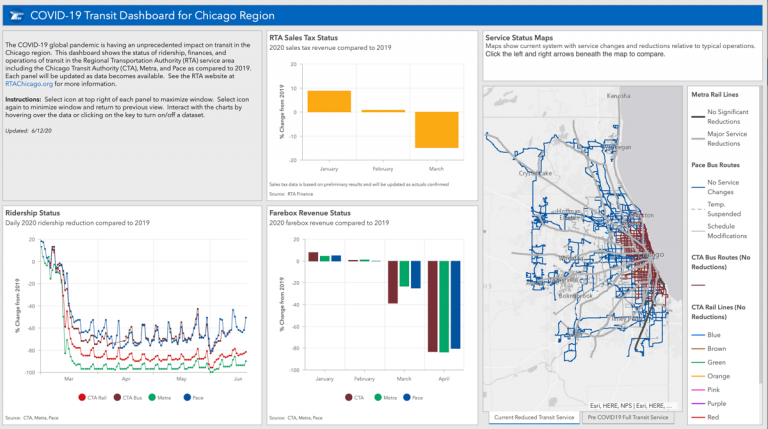
“This is something that’s really never been done before,” Thompson said about the dashboard. “We’ve never had to respond to a disruption of this scale and duration so quickly. We needed to find a way to compile data from a variety of sources and report on it in an online format on a weekly basis.”
During the pandemic, many of Chicago’s transit-dependent residents and essential workers have continued to utilize public transportation to get to their jobs, grocery stores, doctor appointments, and other places. Thompson and his team used GIS to identify locations of people and businesses still in need of transportation. The team analyzed a variety of census data sources as well as the Center for Disease Control and Prevention’s (CDC) Social Vulnerabiltiy Index (SVI) to map densities of at-risk populations.
Thompson described how data is overlaid within GIS and analyzed to extract location intelligence. “We created an internal mapping tool for RTA planning that geocoded all of the supermarkets and hospitals in the Greater Chicago area. Then, we did a spatial query to identify which of those were served by some type of public transportation.”
“We also pulled in data identifying where essential workers were located throughout the region and compared it with the identified locations of essential businesses and RTA transit maps. It confirmed that there was a direct relationship between the commute routes of those essential workers and the public transit lines that were still operating and sustaining ridership levels.”
The RTA is the financial, budgetary and planning oversight agency for the three Service Boards in Northeastern Illinois. The CTA operates a rapid transit and bus system serving the City of Chicago and 35 surrounding suburbs. Metra operates the region’s commuter rail system that includes 11 routes. Pace operates the suburban bus system and regional ADA paratransit services. Collectively before the COVID-19 pandemic, the Service Boards provided nearly two million rides each weekday in six counties with 7,200 transit route miles.
In early May, Governor J.B. Pritzker unveiled a five-phase plan called Restore Illinois, breaking the state into four regions. With consistently falling infection rates, the state is currently authorized to reopen non-essential businesses such as retail operations, indoor and outdoor dining with capacity limits, and hair salons. Gatherings up to 50 people are now permitted for the first time in months.

As of June 11, the RTA system had experienced a 76 percent decline in ridership relative to 2019, with Metra ridership down 95 percent, Pace down 63 percent, CTA rail down 85 percent, and CTA bus down 64 percent. These numbers represent a small uptick since the peak of the pandemic when Illinois was under a statewide “stay at home” order. Since the region’s transit system is largely funded by rider fares and sales tax, reduced demand led to temporary service reductions on Metra and Pace.
The RTA has regularly provided ridership data to elected officials and stakeholders throughout the state during the pandemic.
“We’re partially fueled by tax dollars, and transparency is of great importance to us,” Thompson said. “Sharing this information spatially or on a dashboard is one great way to do it since it takes everything that is so textual in an email and turns it into an interactive visual website that can be updated and accessed anytime.”
When Susan Massel, the director of Marketing and Communications at RTA, saw the COVID-19 dashboard Thompson and his team had created, she realized it contained nearly all of the information the agency had been including in its regular communications to elected officials and stakeholders in narrative form.
“The dashboard is a better way to share information,” Massel said. “The tool was initially created to communicate with the public, but it’s evolved into a great way to share information more broadly with a variety of audiences, including elected officials, stakeholders, and media.”
Learn more about how location intelligence is applied in transportation to gain greater insight and operational performance.