December 5, 2019 |
Dr. Dawn Wright | Mapping
June 21, 2022
Every day, oysters are on the front lines of the world’s most pressing environmental problems.
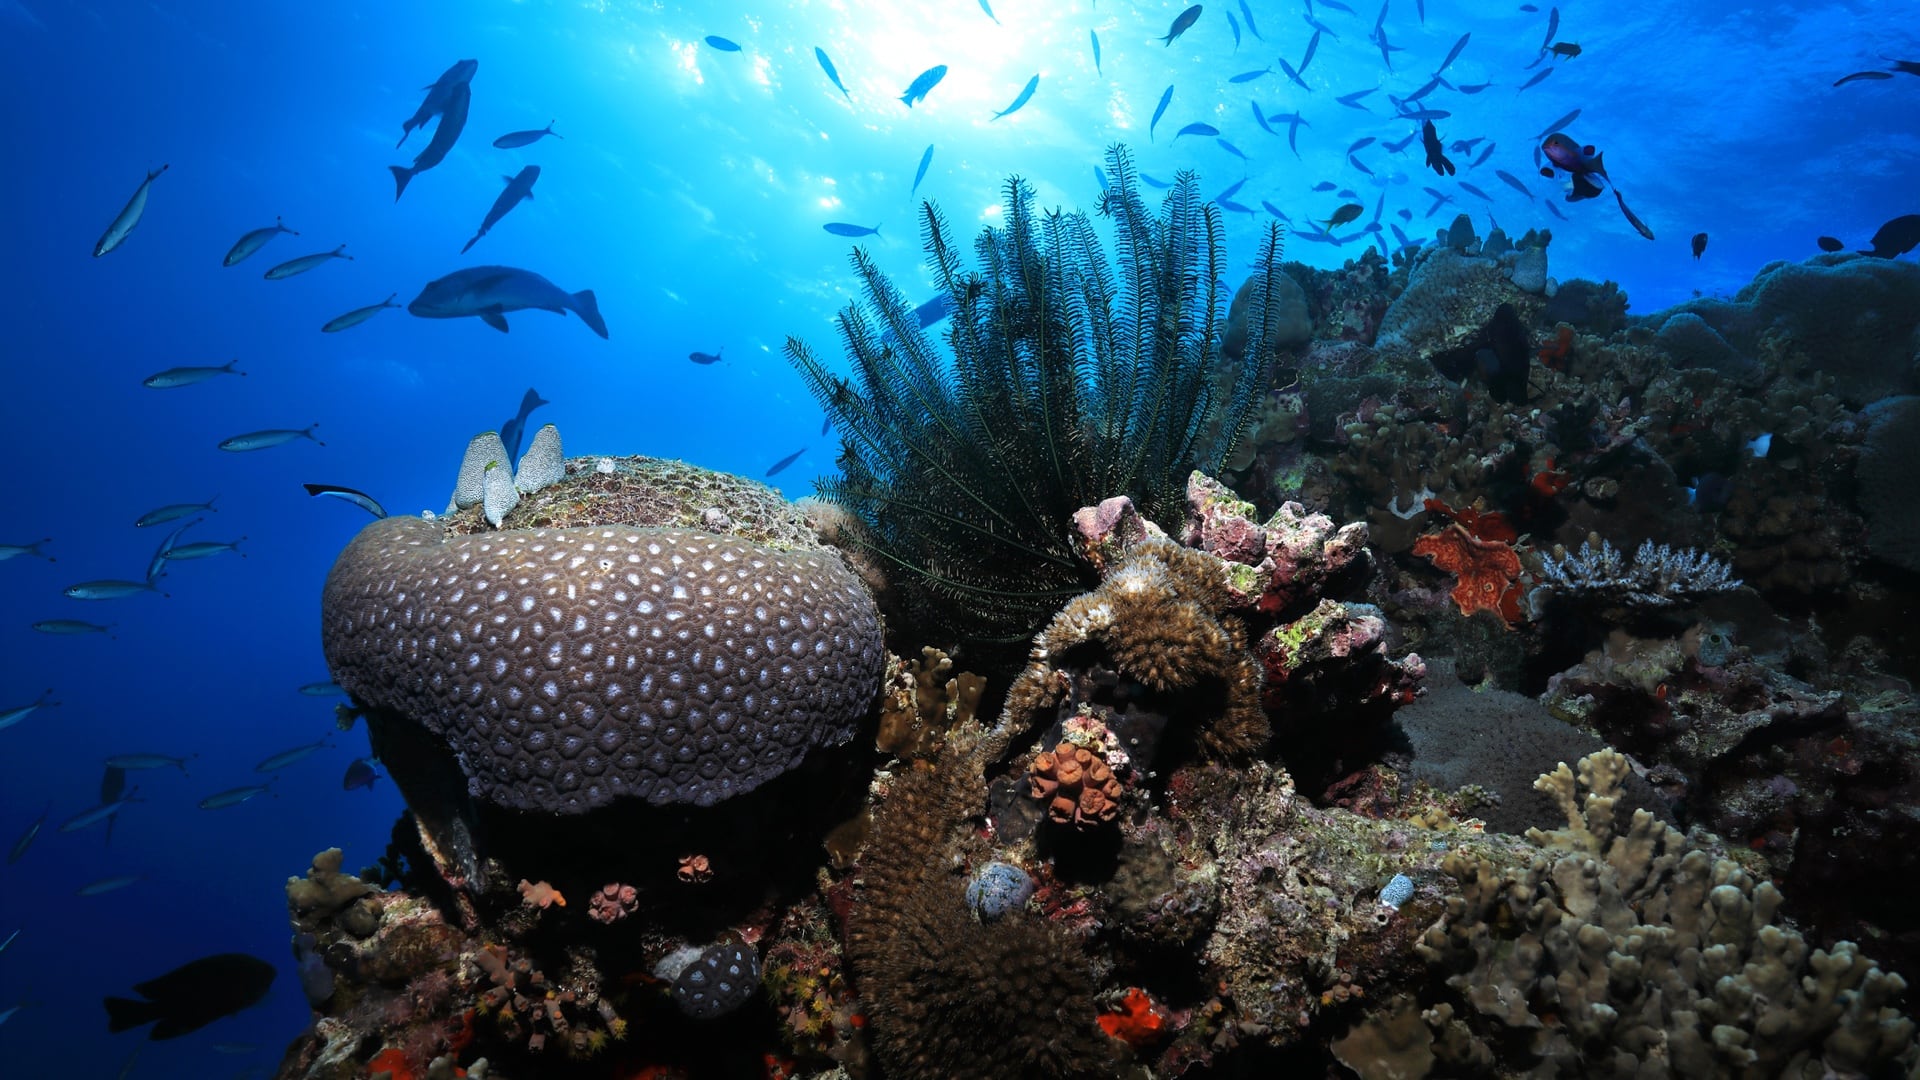
Biodiversity loss? Oyster beds provide habitat for thousands of marine species, and scientists consider oysters a foundational species—meaning one that has an outsize impact on ecosystems.
Climate change? Dense oyster beds absorb large amounts of wave energy, a valuable attribute as sea levels rise and storm surge increases.
Oysters even siphon excess nutrients, including nitrogen and phosphorous, from lawns, farms, and feedlots. “Just by feeding on algae, an oyster can filter dozens of gallons of water each day,” said Aaron Kornbluth, a senior officer with The Pew Charitable Trusts’ US coastal and marine conservation program.
With so many reasons to keep oyster populations healthy, Kornbluth and his colleagues set out to inventory the abundance and distribution of oyster populations. They developed an application that maps oysters across thousands of miles of coast using geographic information system (GIS) technology.
“Oyster populations are dynamic,” Kornbluth said. “They are declining in many regions, but there are also examples of restoration success. We want all that data in a single, central, publicly accessible repository.”
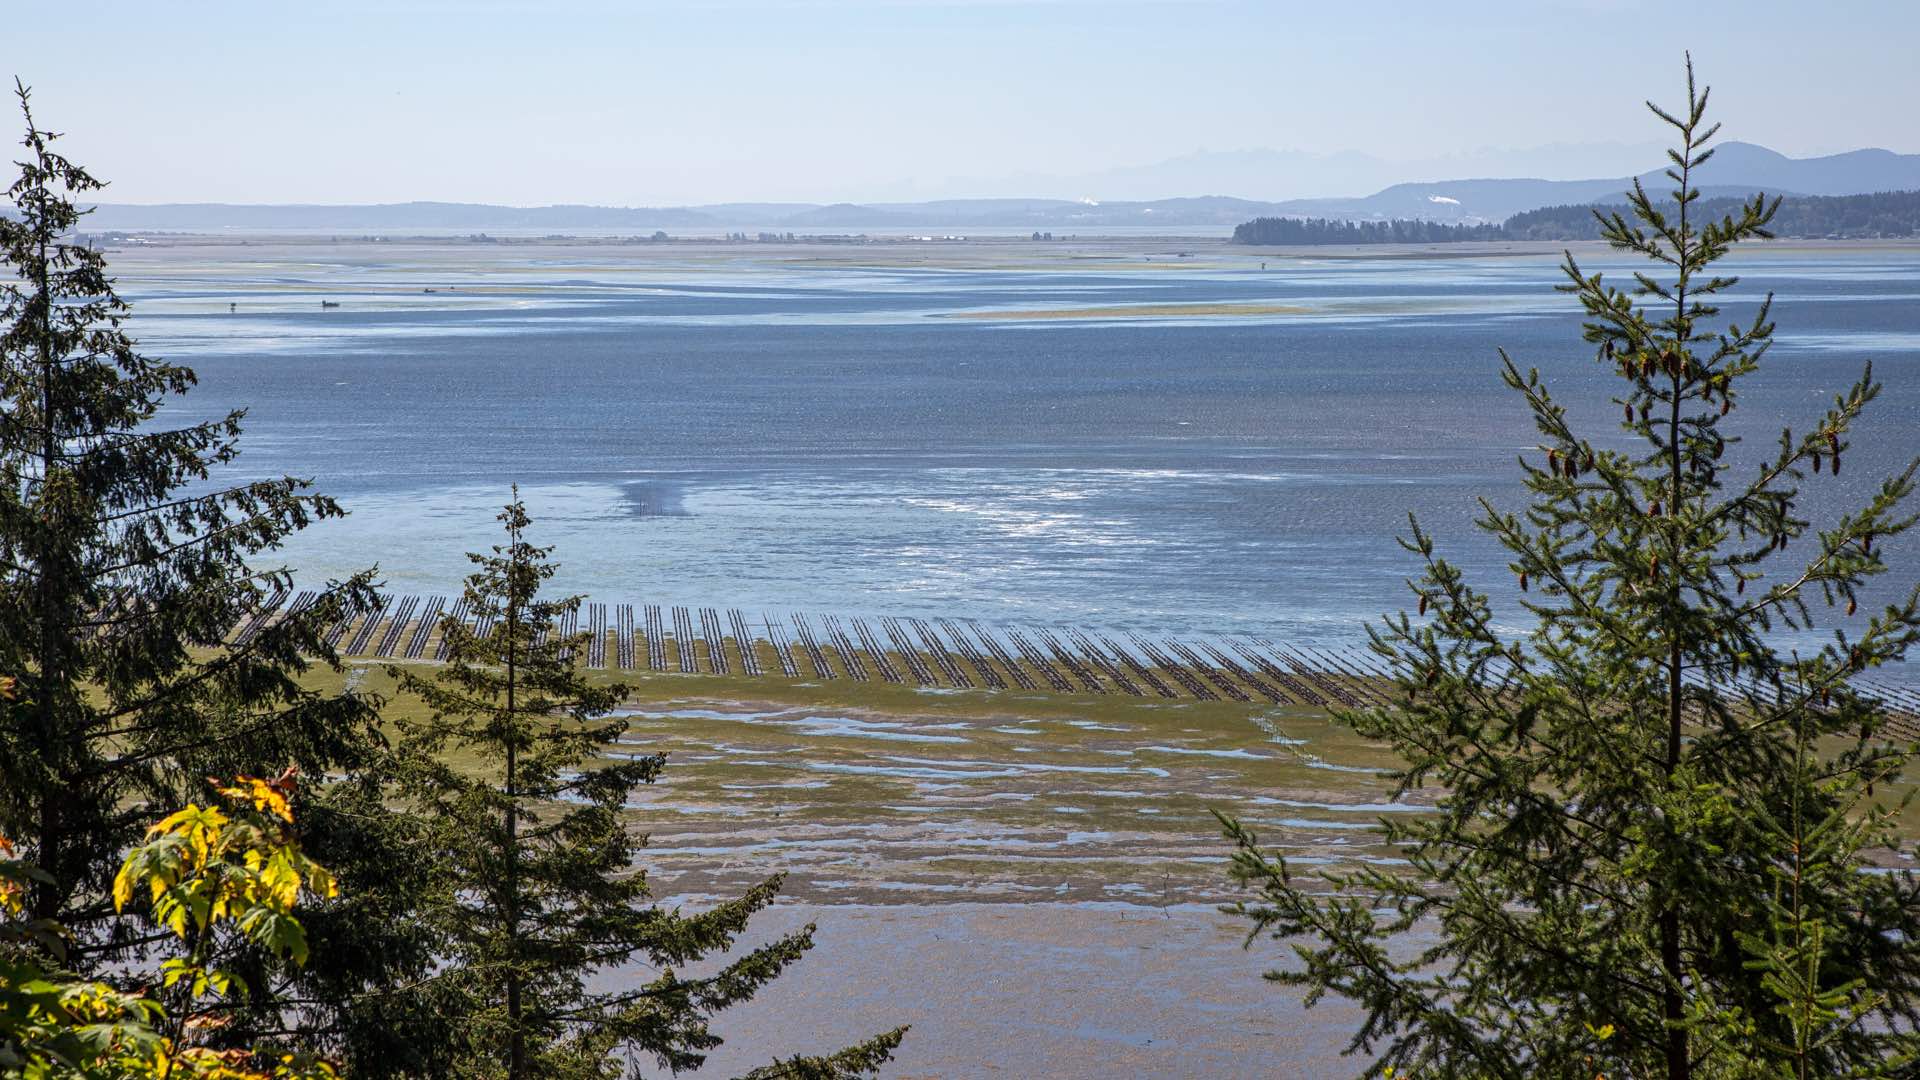
It was a few years ago when the Pew program noticed how little comprehensive data existed on wild oyster populations in North American estuaries, especially on the Pacific side of the continent.
Kornbluth’s team was most interested in the number and distribution of Olympia oysters or Oly for short, the only oyster species native to North America’s west coast. Working with the Native Olympia Oyster Collaborative, a coastwide network of oyster scientists, practitioners, educators, and aquaculturists who are actively studying and restoring native oysters, Kornbluth’s team set out to conduct a continent-wide assessment of the state of the Oly.
“What we realized—and we weren’t the first to realize this—is that we need better data on oysters in order to be able to develop more successful, more appropriate, more spatially explicit conservation and restoration planning scenarios,” Kornbluth said.
The Oly ruled the area for thousands of years, but over the last hundred it has faced competition from Pacific oysters, a popular aquaculture species that has escaped into the wild. The researchers wanted to know whether Pacific oysters might be outcompeting, or even replacing, the native Olys, based on their numbers and distribution over time.
Kornbluth and his team created an online GIS portal for oyster researchers to submit the results of their surveys and studies. Using the portal’s shared map of the coastline, they could mark the locations of their observations in a systematic and efficient way.

As word spread and data flowed into the portal, the team supplemented the information by doing extensive literature searches. When they found a study with reliable oyster observations, they created a record via the portal.
Old records, including some that went back as far as the 17th Century, provided interesting points of comparison. “Of course, they didn’t have GPS coordinates back then, so we had to interpret things like a three-hectare oyster reef off the coast of a town,” Kornbluth said.
A few months after the launch of the portal, it contained around 2,300 records of oyster observations, from Alaska to the Baja California peninsula.
Although the portal and its map tell a story about the state of the Olympia and Pacific oyster populations, a deeper tale lay hidden in the data. To reveal it, Kornbluth and his team found a creative way to use GIS for further analysis.
Oysters reproduce by releasing larvae that swim until they find a good place to settle down. A larva may only swim a few feet before finding a permanent home, but Oly larvae have been known to travel 30 kilometers or more.

This dispersal supports an ongoing exchange of DNA that ensures genetic diversity, which benefits the overall health of the species. Prior to human intervention, the Oly, like many oyster species, formed vast networks through larval import and export.
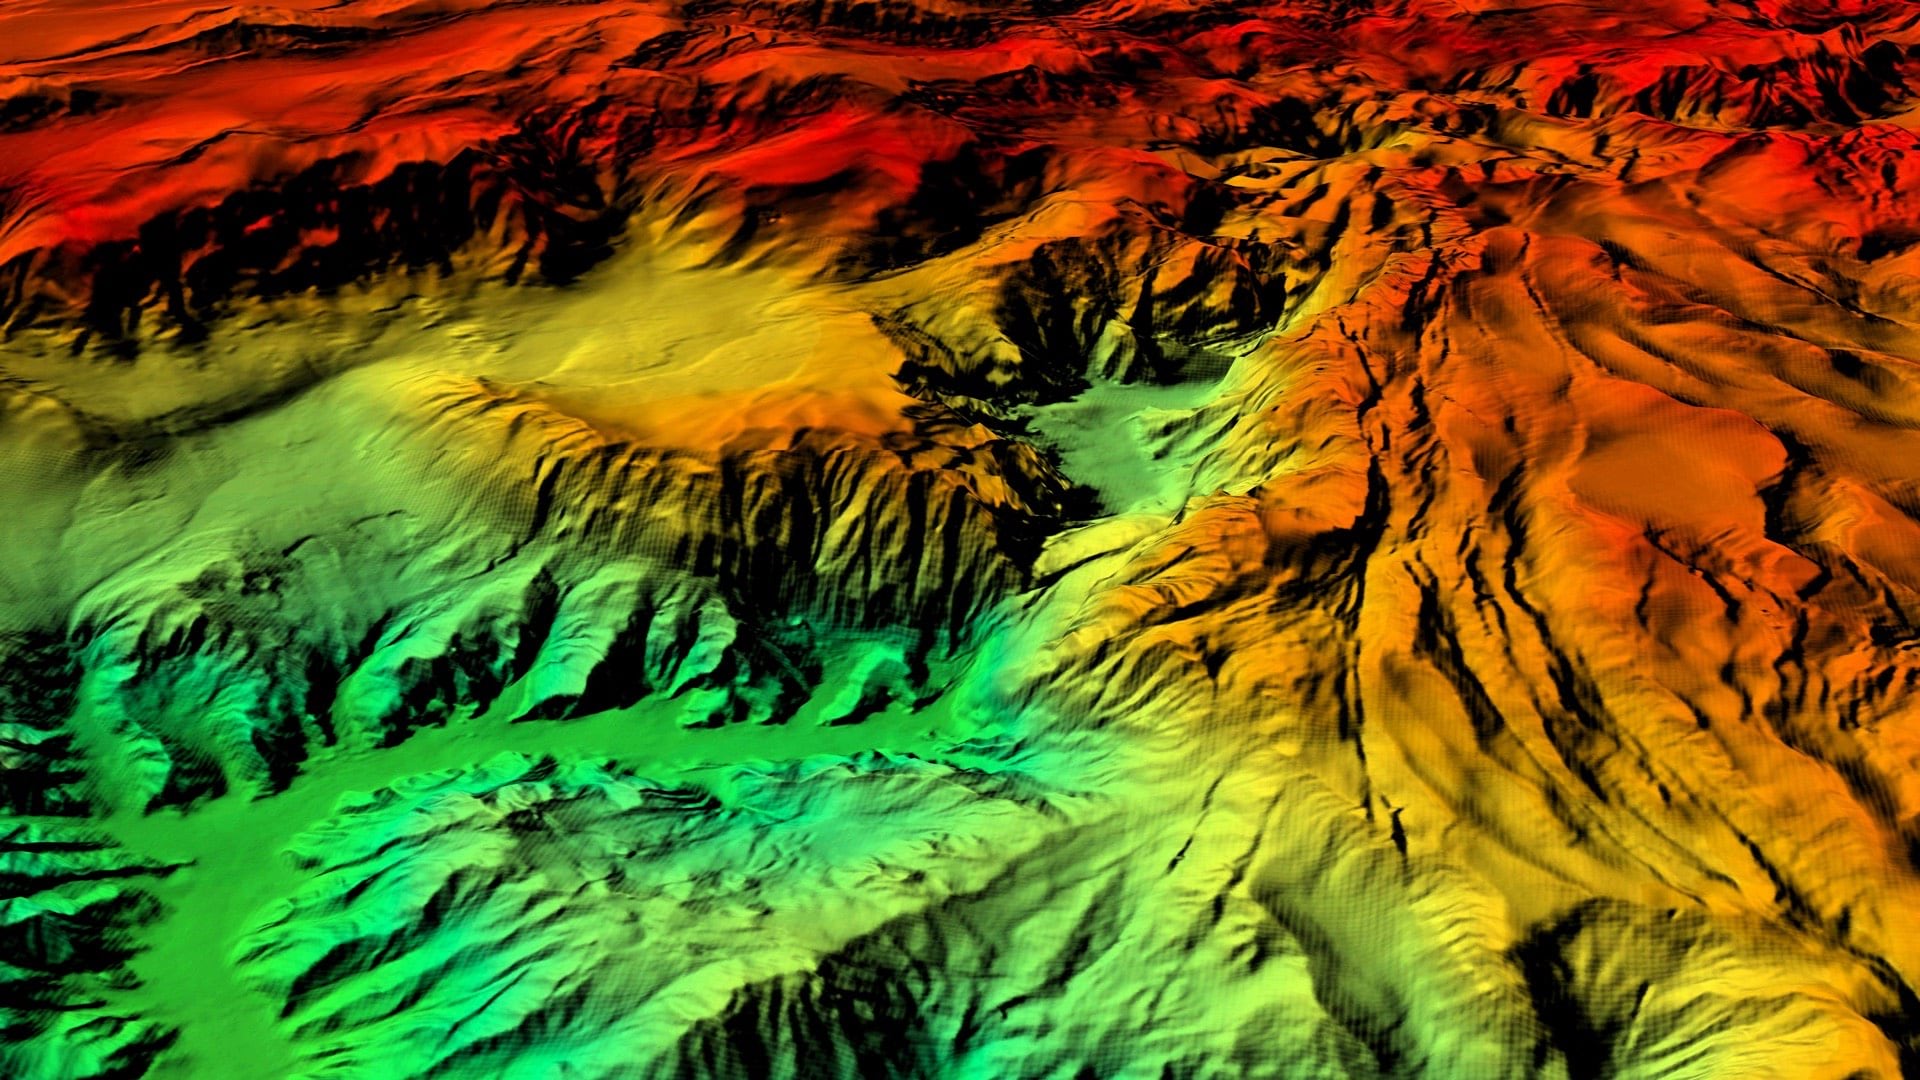
Kornbluth and his team wanted to assess how many unfragmented Olympia oyster networks remain, an important consideration for deciding how to implement effective restoration. They began by developing a detailed map of the North American west coast, including its estuaries, and overlaying two decades of oyster observations. Next, they instructed the GIS to draw a 30-kilometer buffer around every oyster, a conservative estimate of the maximum distance any individual larva was likely to travel.
Any buffer that overlapped another was considered part of a larger interconnected network. Once mapped, they offered a visual representation of the health of oyster sub-populations, with large networks likely resilient to population declines (because they can self-replenish) and small networks at risk.
The results revealed that in certain regions—including the Salish Sea near British Columbia and the Southern California Bight (the 430-mile curved coastline that stretches from Point Conception to Baja)—Oly networks are large and relatively healthy. The mapped networks were far smaller throughout much of Northern California and Oregon. In some locations, including stretches of California’s Central Coast and the Punta Banda cape near Baja, the map revealed isolated oyster populations effectively cut off from larger networks.
By providing information on current and historic abundance and distribution, Kornbluth and his team hope that the maps and data can serve as a foundation for more strategic oyster restoration. A published article of the team’s methods and findings recommends that any such effort should aim to enhance connectivity among native oyster networks.
“For instance, a well-sited restoration project might seek to connect two disparate, small networks,” Kornbluth said. “That would increase the chances that larvae would then be able to move among networks in a self-sustaining manner, thus creating a larger, more resilient network.”
In addition to the innovative methods the team used to analyze the data, which Kornbluth hopes could inform the conservation of other species, the interactive data-gathering process itself could become standard practice.
“Using GIS as a tool for community mapping of marine species is not something we think has been largely attempted,” he said. “Someone could theoretically apply it to mussels or sea scallops. It’s a methodology we’re really excited about.”
Learn more about how GIS is used to explore the ocean, map it, and increase awareness.