April 21, 2020 |
Multiple Authors |
When we think about the National Aeronautics and Space Administration (NASA), we likely think of astronauts and far-off planets. But Earth is a planet of interest for NASA too. In fact, NASA has a long history of observing Earth from space to understand our planet’s interconnected systems.
NASA scientists study severe weather, natural hazards, and global food production using satellite observations and modeling. They utilize geographic information system (GIS) technology to deliver data to users. They also estimate and monitor solar radiation and winds—data that is in high demand as the world transitions to renewable energy.
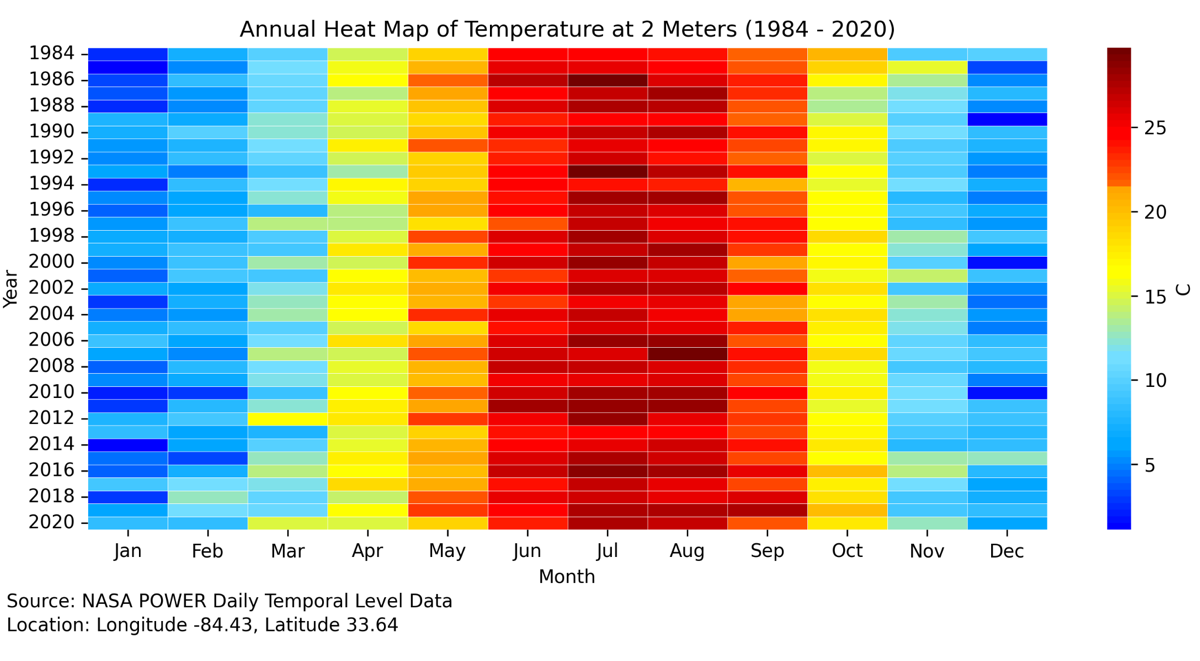
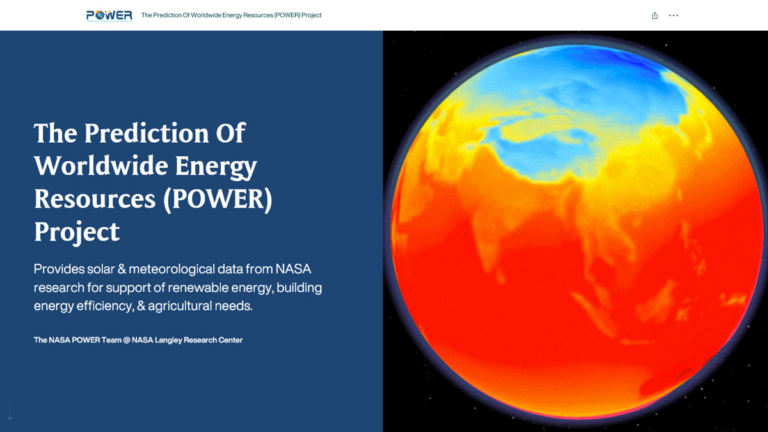
Through its Prediction of Worldwide Energy Resources (POWER) project, NASA provides interactive maps, applications, and data services that describe meteorological conditions and solar radiation and show how those resources may be changing over time. The majority of data products are updated on a daily basis, and historical records stretch back over 35 years. Decision-makers across industries can access the data inside their own applications to visualize on a map, perform analytics, and employ calculations to enhance planning and problem-solving.
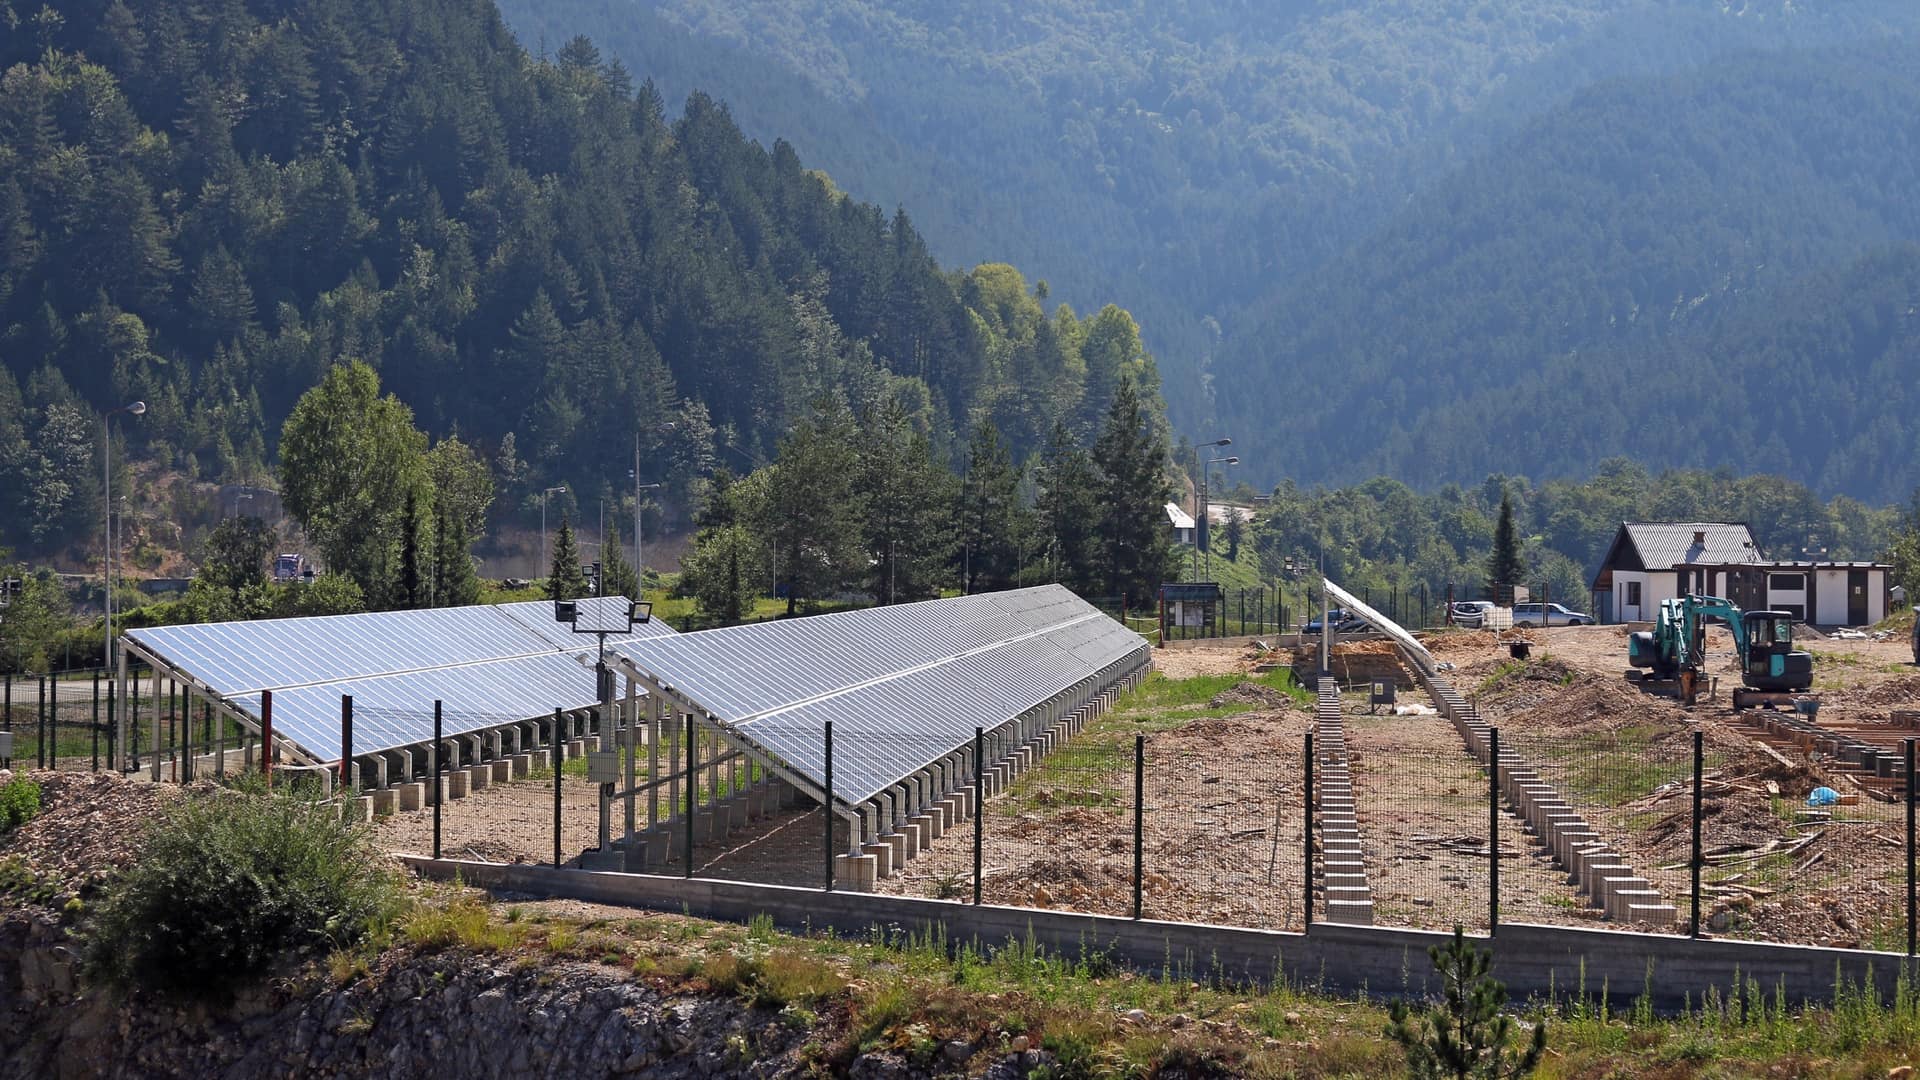
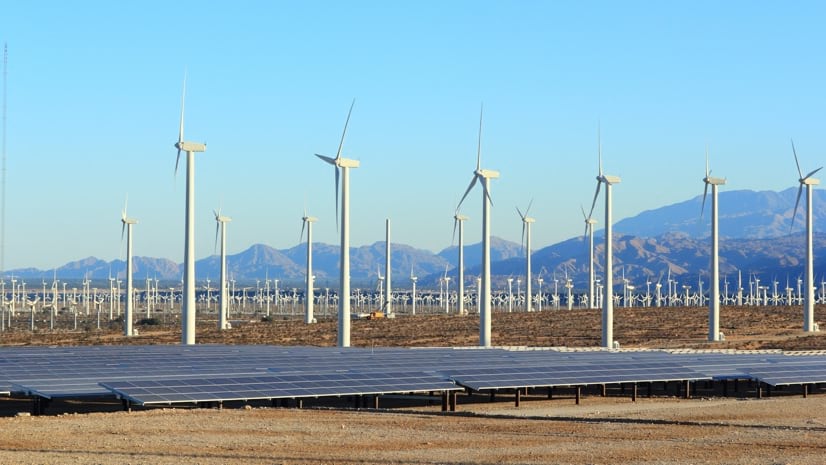
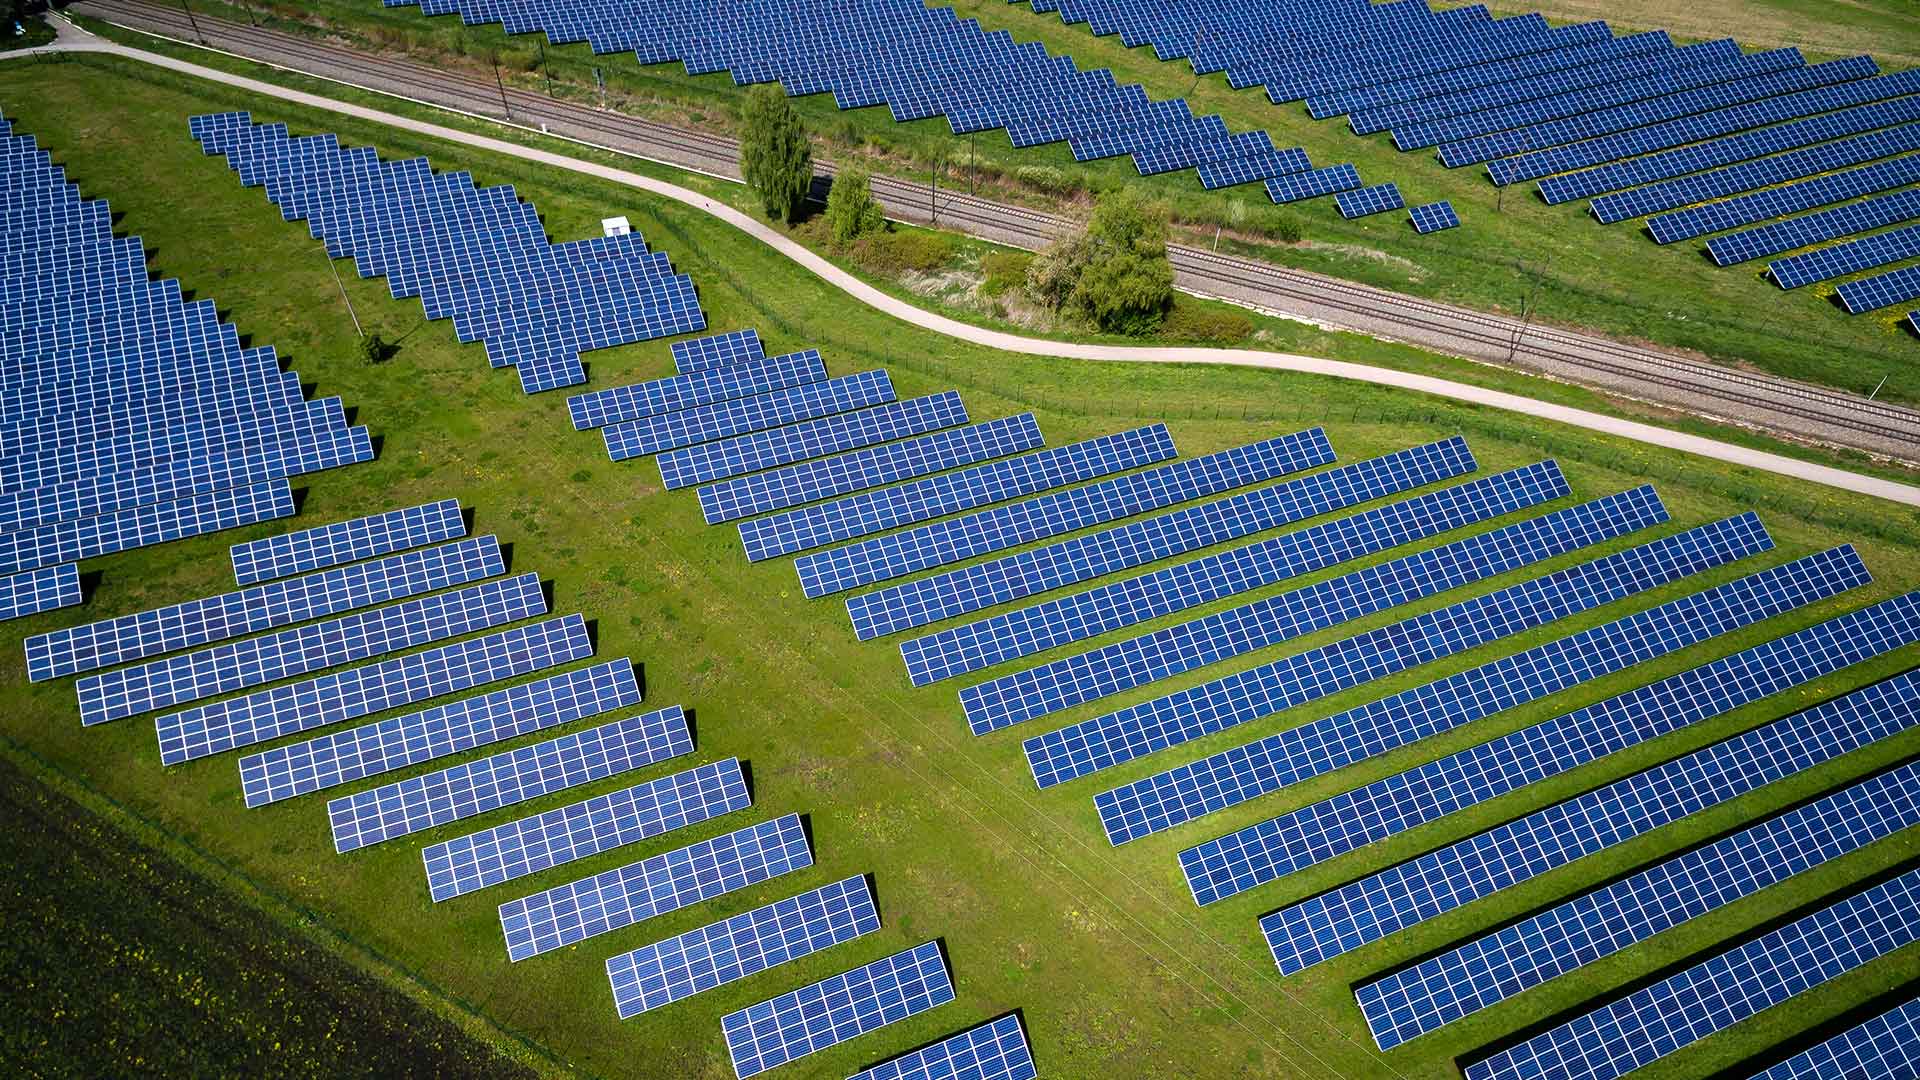
For instance, leaders of cities, as well as utility companies, rely on NASA data to calculate solar and wind power potential for prospective power generation sites. Facility managers use it to examine and model the energy use of buildings. Executives and line of business managers leverage the data to determine potential energy generation from rooftop solar panels. Designers of renewable energy systems use it to size solar panels and plan energy backup systems. This data also helps farmers and commodity traders calculate expected crop yields, as solar radiation is a key input to crop growth. And NASA even sees data downloads along shipping routes, presumably for ships equipped with wind and solar power systems.
Since POWER adopted GIS capabilities, the team has fielded more than 211 million requests for its data from 483,000 unique users, as of February 28, 2021.
Since the POWER project got its start 20 years ago, in 2002, with the goal of making surface energy measurements available, it has seen tremendous growth in the data it aggregates and provides, the answers it can offer, and the communities it serves.
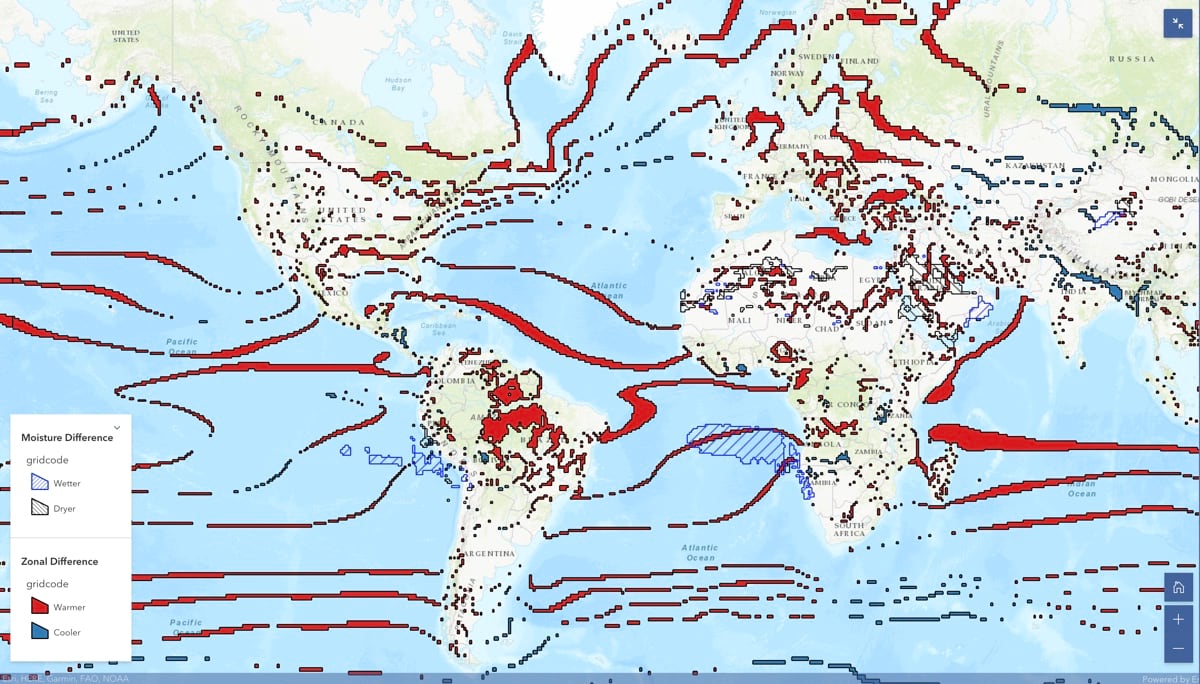
In the transition to clean energy, the POWER project acts as an accelerant, providing time series and climatological data as a service, which helps inform planners of what to expect in the future. Satellite observations combined with sophisticated computer models paint a picture of solar and wind energy resource availability around the globe. For less developed areas or places without on-the-ground data or a long history of it, derived observations filled in by a model can provide accurate estimates.
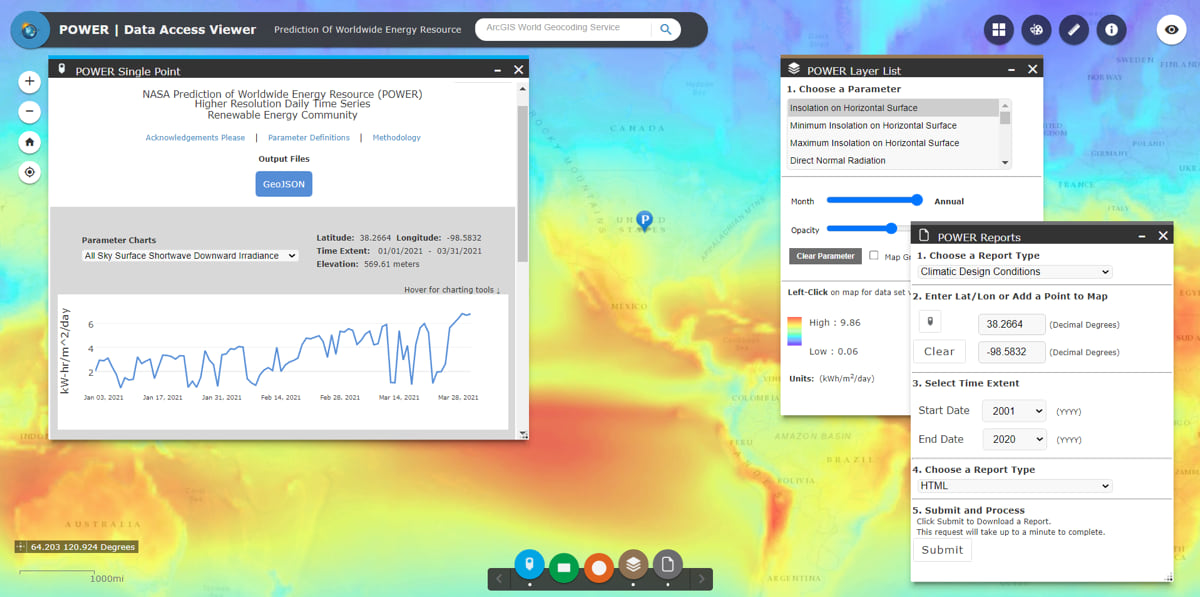
The POWER team provides the Data Access Viewer, a GIS web-based tool that allows anyone to see and explore a variety of renewable energy variables at any location around the world. Software developers can connect directly to the application programming interface (API) and use the data within the applications they build, and cartographers or other GIS professionals can use ArcGIS image services to conduct analysis, make smart maps, and create dashboards—all of which roll up to effective renewable energy plans.
This data supports a variety of renewable energy efforts. For example, the local government of Satellite Beach, Florida, in collaboration with NASA, used POWER data to estimate the role rooftop solar can play in the city’s goal of generating 100 percent of its energy needs from renewable sources by 2050. And, in the equatorial region of West Africa, a researcher was able to attribute the 60 percent drop in solar panel performance from June through October to clouds. Instead of blaming solar panel performance, the community added more panels to achieve its energy needs.
Decision-makers working on renewable energy initiatives have come to rely on shared smart maps for a birds-eye view of on-the-ground opportunities. Deciding where to generate power from renewable energy requires answers to a series of location-based questions that start with where resources are likely to be the greatest, followed by considerations of local demand and the cost of connecting to the grid.
Spatial analysis makes it easier to answer these questions. Within GIS, solar and meteorological data from NASA can be layered on the same smart map with socioeconomic and energy grid data. In this way, modern GIS software brings clarity to complex renewable energy challenges by helping make sense of massive volumes and varieties of data, showing an accurate picture of current conditions, and empowering users to model and simulate strategies.
With growing and widespread demand for renewable energy, the rich detail amassed from GIS and smart maps also allows decision-makers to compare and prioritize opportunities at multiple locations.
As people around the planet investigate and invest in capturing energy from the sun and wind, they will study Earth observations captured by NASA from space. NASA’s observations are freely and openly available to all and help us to better understand how our planet’s complex systems work.
It’s an astronaut’s mission of sorts, for as Buckminster Fuller said, “I’ve often heard people say, ‘I wonder what it would feel like to be on board a spaceship,’ and the answer is very simple. What does it feel like? That’s all we have ever experienced. We are all astronauts on a little spaceship called Earth.”
Learn more about how GIS supports clean energy strategies.