

May 7, 2024 |
Sophia Garcia | GIS for Good
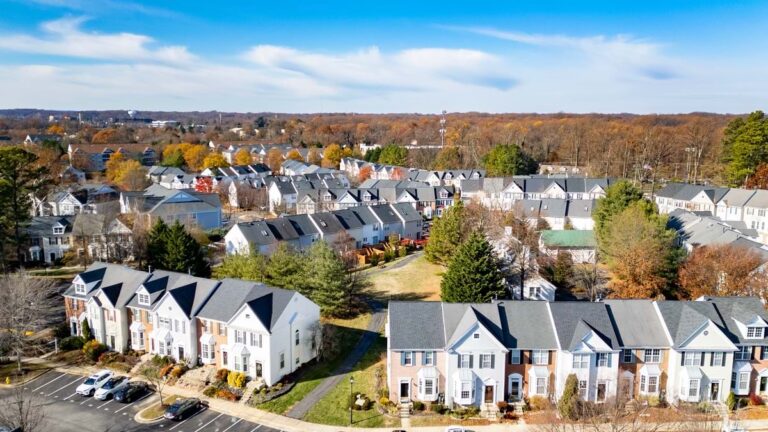
Thirty-two “mega-investors” collectively own nearly 450,000 single-family homes across the US, with the five largest companies holding 300,000 homes—two percent of the combined national housing supply, according to a report by the US Government Accountability Office.
As private homes shift into corporate portfolios in unprecedented numbers, a fundamental opportunity moves farther from reach for hundreds of thousands of Americans. Many cannot overcome the trifecta of high home prices, elevated interest rates, and investor dealmaking.
Analysts at the Center for Geospatial Solutions (CGS) at the Lincoln Institute of Land Policy are working to help communities across the country understand changing patterns, protect affordability, and keep homeownership within reach for traditional homebuyers.
“The real story of the housing market isn’t told at the state or city level; it’s told block by block,” said Reina Chano Murray, Associate Director at CGS and a lead author of the report. “What’s powerful about our approach is being able to see those local shifts through a consistent, national framework, so communities can compare patterns and track change over time.”
Mapping ownership at this level requires more than overlaying datasets. Over three years, CGS analysts have developed a method for tracing ownership, looking at parcel records, corporate entities, and jurisdictions. This approach makes it possible to see patterns that are otherwise obscured. They determined where corporations are assembling clusters of homes and how those trends intersect with community demographics.
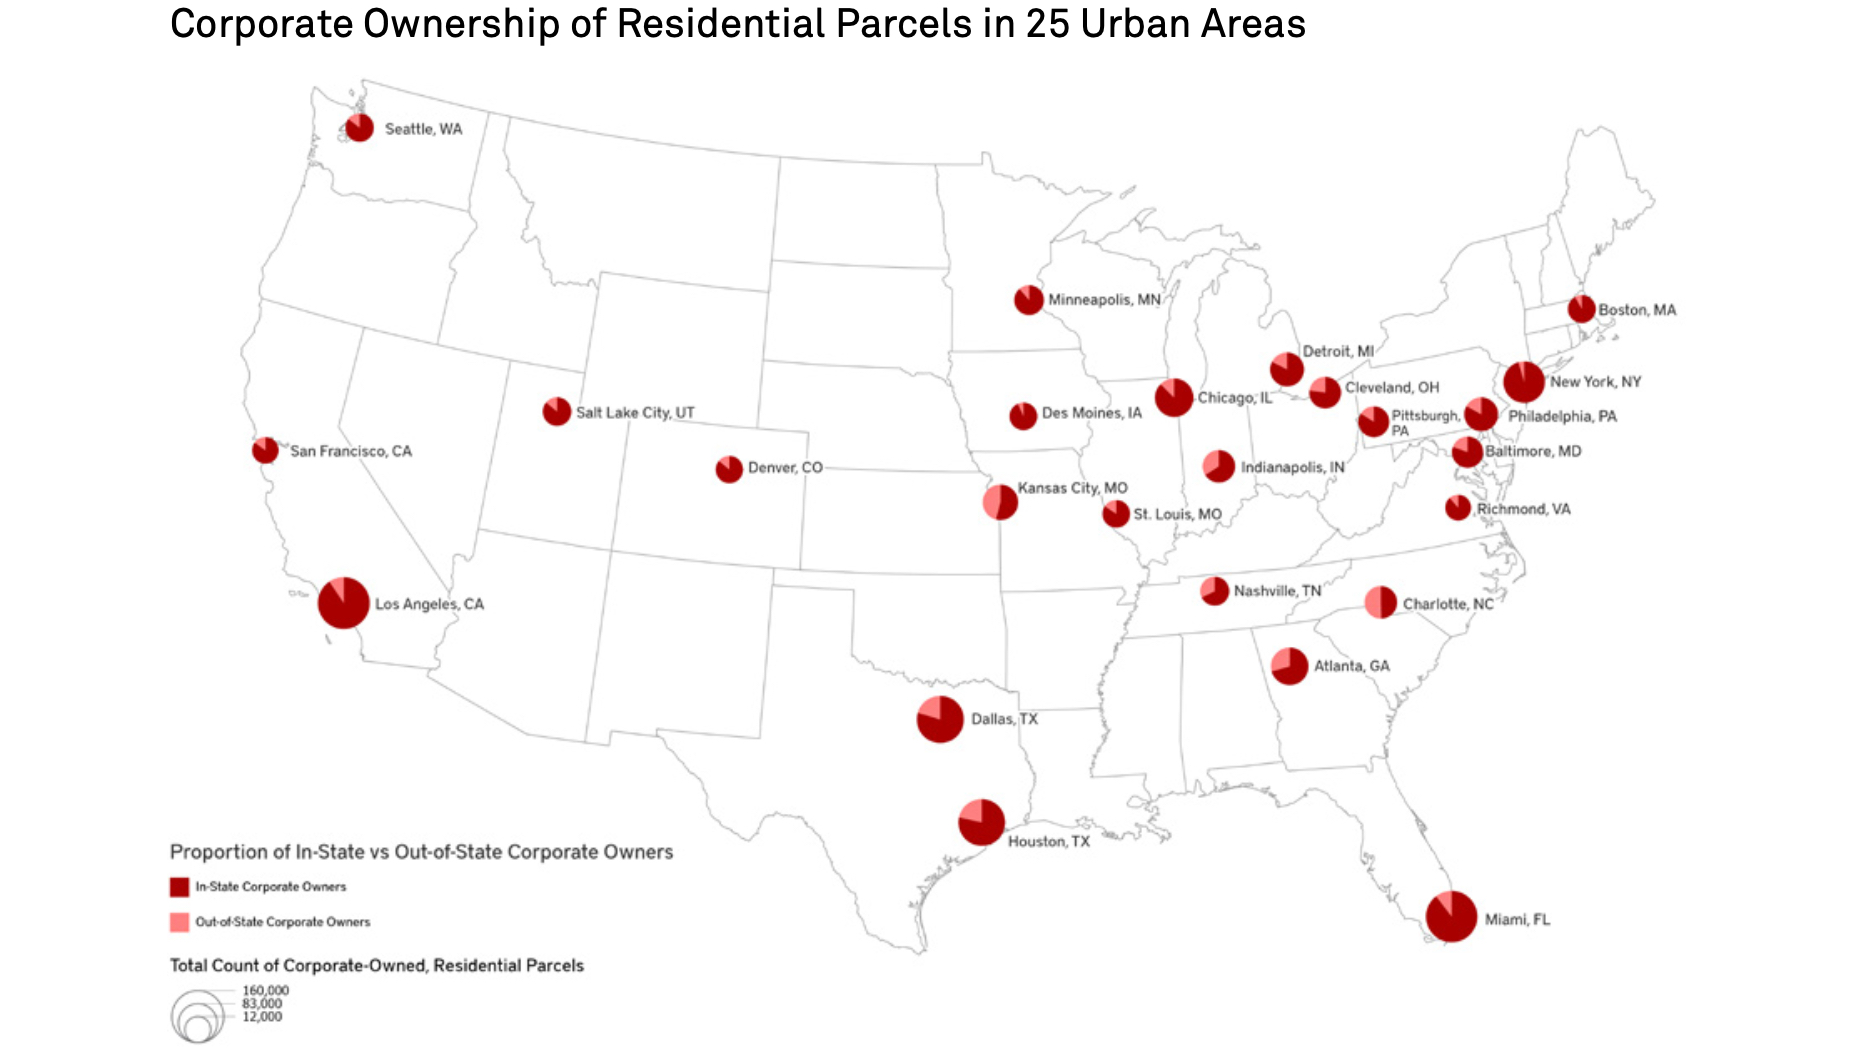
They found, for instance, that 9 percent of residential land parcels—nearly one in eleven—is now held by a corporate entity. Their findings are published in a report, Who Owns America: Mapping Corporate Ownership of Residential Land.
“Although the national media narrative about corporate investments in real estate tends to focus on investment activity in disinvested cities, this analysis revealed that corporate investors are active in many types of places, including college towns and fast-growing metro suburbs,” the report says.
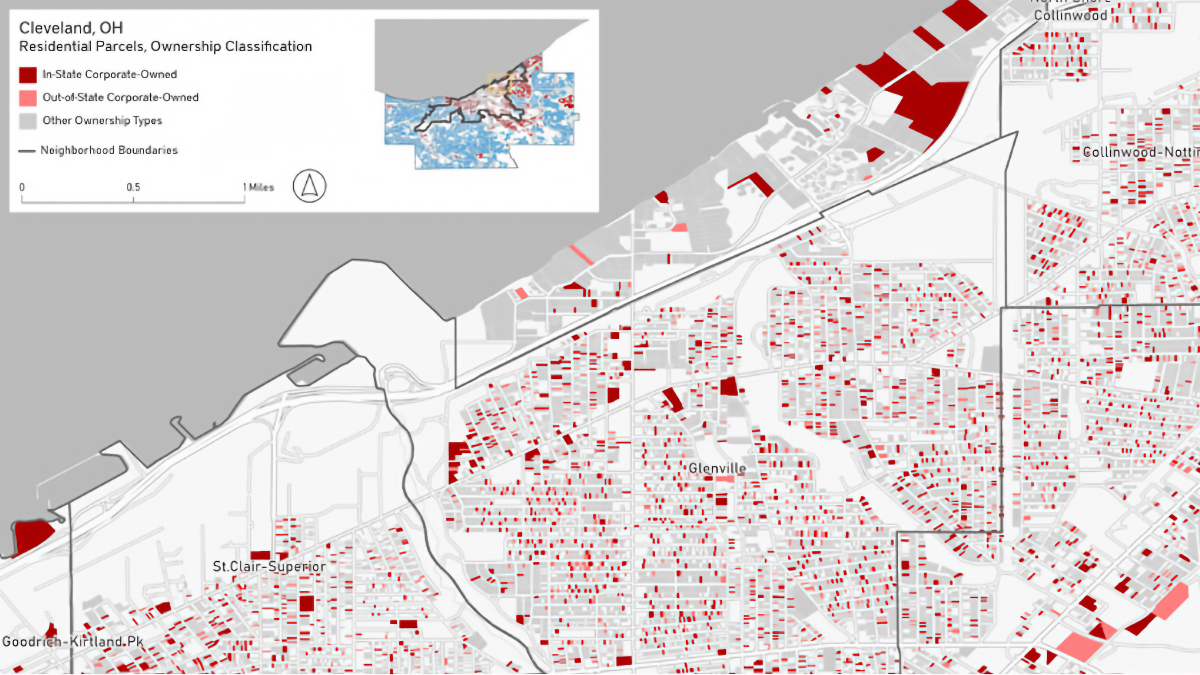
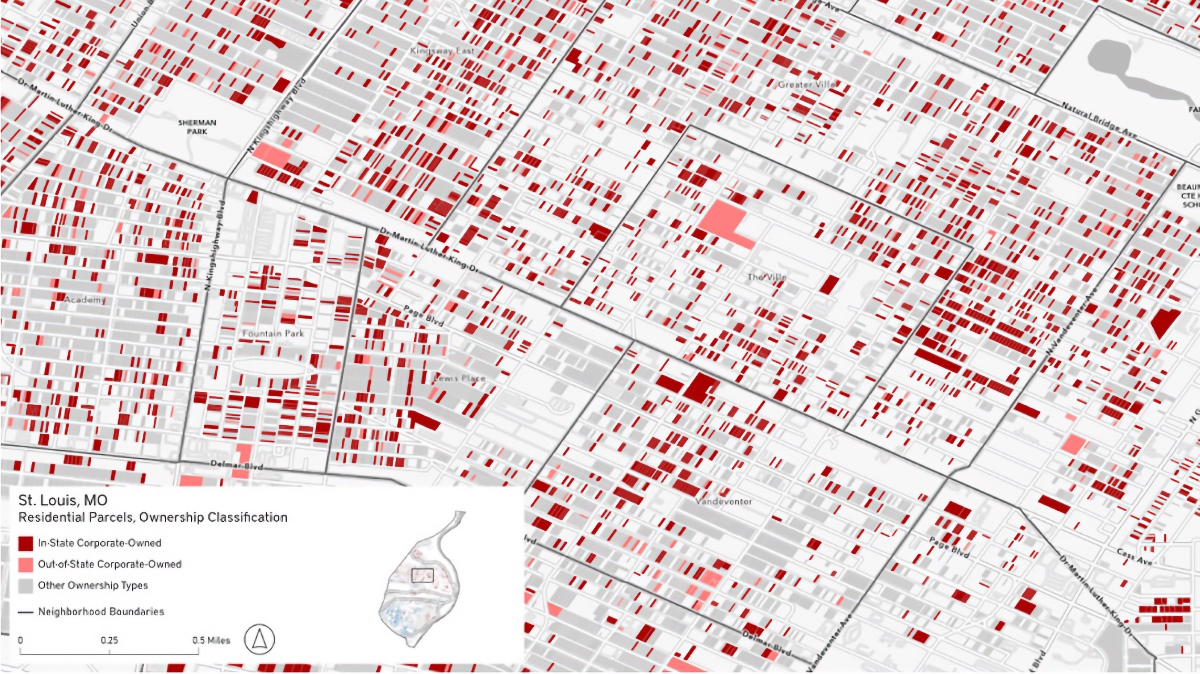
Corporate investors seized on market instability during the 2007-2009 financial crisis and again during the COVID pandemic. CGS works with communities across the US to uncover and document local corporate buying trends. They use maps, created with geographic information system (GIS) technology, to provide a dynamic visual record for tracking and analyzing housing market activity.
Entities that acquired homes in bulk at foreclosure auctions include limited partnerships, limited liability corporations, and real estate trusts and corporations, according to the report. Those investors typically converted the homes to rentals.
Meanwhile, many traditional buyers are caught between high rent payments and unaffordable costs for a downpayment and a monthly mortgage, according to a 2024 report by the Federal Reserve Board.
At the same time, household earnings are being stretched farther to pay for not only housing but food, childcare, transportation, healthcare, and student loans. Those higher costs shrink the housing affordability gap—the space between earnings and housing costs. This has left many potential buyers “cost burdened.”
In 2023, getting into even a modest home required $26,800 in cash for closing costs and a minimum downpayment—or $95,000 for the conventional 20 percent downpayment. Even buyers who can clear that bar face another obstacle when offers are being weighed.
“Individuals struggle to compete with large investors that can buy homes with cash or more easily secure financing, close deals quickly, and purchase several properties in a single transaction,” according to a 2025 report by Harvard’s Joint Center for Housing Studies.
What’s at stake is economic mobility. Homeownership has historically been the primary way American families build long-term wealth. Every home that moves from the owner-occupied column to a corporate portfolio is a wealth-building opportunity that doesn’t transfer—it disappears.
Identifying buyers who purchase homes through corporate entities requires intense data investigation and analysis. Families may create limited liability corporations, or LLCs, to ensure generational property ownership, but many landlords also use this structure. Large corporations can have hundreds of different LLCs, for thousands of properties located across dozens of communities.
The CGS project team examines parcel records nationally, which include tax assessor data, before layering in additional information such as corporate entity registrations. Through this process of discovery—managing massive GIS data libraries, tracing owners across state lines and corporate structures, and recording it by location—CGS analysts distinguish owner-occupied residential parcels from those held by private local landlords or out-of-state corporate entities.
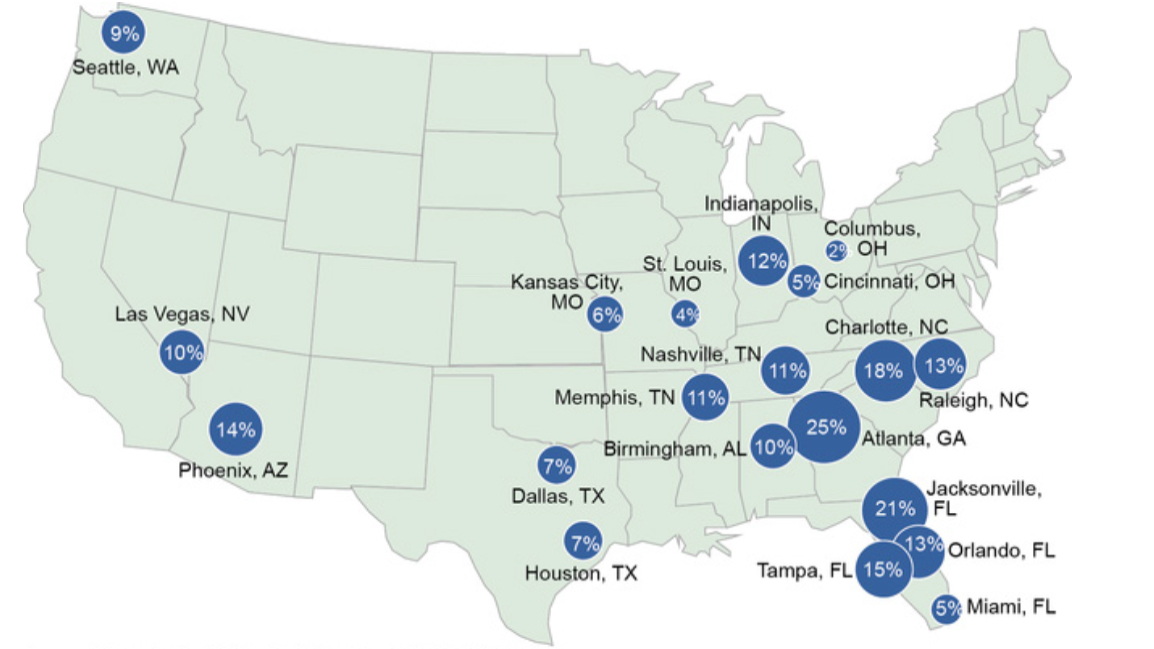
For the report, the CGS project team uncovered 25 county hotspots within its study area where corporate activity was the highest above the baseline of 9 percent.
In St. Louis, for example, 17.6 percent of residential parcels are owned by in-state entities, with an overall corporate ownership rate of 20.9 percent.
Cities with similarly high investor ownership rates include Baltimore (nearly 16 percent in-state and nearly 20 percent overall), Miami (more than 16 percent in-state and more than 18 percent overall), and Richmond, Virginia (nearly 15 percent in-state and nearly 18 percent overall).
The CGS findings reveal a pattern with troubling consistency. Corporate investors are most active in the Midwest, South, and Mid-Atlantic, with purchases clustering in lower-priced neighborhoods—often communities of color, and often the same places hit hardest by the original foreclosure crisis. The effect is compounding. Areas already weakened by that crisis are now seeing more of the remaining owner-occupied housing stock absorbed into rental portfolios, stripping residents of the primary vehicle for building household wealth.
The highest corporate ownership rates are held by in-state landlords, most of whom are likely individuals or small-scale investors rather than Wall Street mega-funds. But mega-investors are present too, acquiring thousands of homes.
The impact extends beyond prospective buyers. Tenants of corporate landlords face higher rents and, studies show, less maintenance on average—a double burden for households already stretched thin.
A clear view of patterns taking hold in the housing market is essential for legislators, urban planners, and fair housing advocates. With access to GIS maps and spatial analysis, those stakeholders can prioritize needs and develop appropriate regulations and programs.
Solutions being considered include registries for landlords, municipal buybacks, property tax relief, and the launch of community land trusts that help preserve affordability and protect housing supply for traditional buyers. Local approaches tend to be the most targeted and effective.
In Utah, officials are confronting limited land for residential development and prices that have left an entire generation of potential buyers on the sideline. To meet the governor’s goal of building 35,000 starter homes by 2028, state GIS analysts track land ownership data for long-range planning and monitor construction progress. This includes evaluating state-owned parcels as potential development sites, mapping infrastructure gaps for accommodating new construction, and tracking housing supply and active construction projects.
CGS analysts are doing similar in Colorado to help policymakers map publicly owned parcels. Their goal is to identify sites that could be repurposed for housing as part of the Lincoln Institute’s Community Land for Community Benefits campaign.
Governors in Oregon and Colorado have joined Utah in taking a data-driven approach to opening up the housing market. These Western states also use GIS technology to uncover hidden opportunities, accelerate construction, and reduce building costs.
“In many places, the constraint isn’t just policy but visibility,” said Murray. “There are dozens of viable sites for housing hiding in plain sight across communities. The challenge is seeing them clearly enough to act.”
A similar approach is being applied in Massachusetts, where CGS partnered with the Lynch Foundation to analyze land owned by faith-based organizations. By identifying parcels with redevelopment potential, the analysis revealed a largely untapped opportunity to support thousands of new homes in communities where land constraints are often a primary barrier.
Together, these efforts point to a growing shift in housing policy, from reacting to market pressures to proactively identifying and activating land that can serve community needs.
At the federal level, Ginnie Mae is using data science to help lenders identify and reach underrepresented borrowers who could qualify for mortgage loans but have been overlooked by conventional outreach.
Legislative action is picking up across the country. In November 2024, St. Louis voters passed Proposition V, authorizing higher fines on vacant or deteriorating properties that aren’t owner-occupied—a direct financial pressure on absentee corporate landlords.
Nationally, CGS counted 22 bills aimed at regulating corporate home ownership, including New York’s End Hedge Fund Control of New York Homes Act. At the federal level, the Hedge Fund Control of American Homes Act would impose tax penalties on institutional investors that own more than 100 single-family homes.
Some communities have acted locally: Carmel, Indiana, caps rental units in any subdivision at 10 percent. President Trump had already pushed to restrict large institutional buyers, stating on social media that he would “immediately take steps to ban large institutional investors from buying more single-family homes” and call on Congress to codify the restriction. In January 2026, he signed an executive order calling for limits and Congress answered with the 21st Century ROAD to Housing Act, a bipartisan bill that stops investors who own 350 or more single-family homes from buying additional ones.
The law will not take effect until January 2027. It does not force any company to sell homes it already owns. Still, some investment firms are already backing away from large single-family purchases.
The housing market doesn’t sort itself out. Left unexamined, the shift from owner-occupied to corporate-owned housing moves quietly, in patterns that only become visible at scale. GIS maps provide a clear picture of the problem and serve as a foundation for addressing it.
Communities that understand what’s happening, by catching the patterns on their maps, can create better options. Those that don’t are left reacting, often after the leverage points are already gone.
Learn more about how GIS helps communities develop strategies to provide affordable, accessible, and attainable housing options for every resident.