
September 23, 2025 |
Christa Campbell | Infrastructure
August 25, 2026
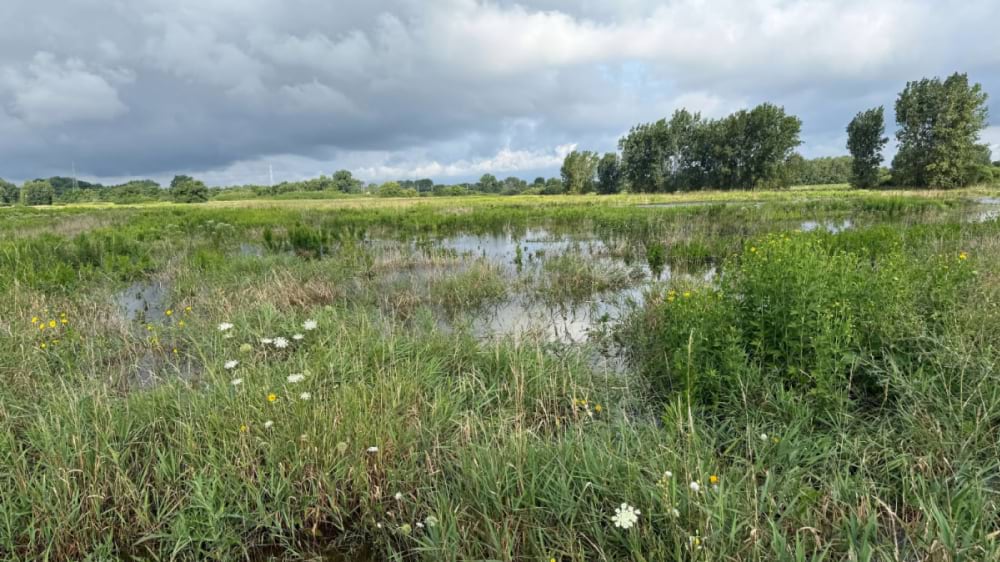
In 1837, long before the city’s streets or neighborhoods took shape, federal surveyors mapped the terrain that would become Milwaukee—then a landscape of streams, wetlands, and Lake Michigan shoreline. Those survey records sat in archives for generations.
As the city grew, much of that land was filled, graded, and built over. The water didn’t disappear; development reshaped the surfaces around it.
On the evening of August 9, 2025, rain in Milwaukee began and did not let up for six hours. After the storm passed, a rain gauge near James Madison High School recorded more than 14 inches of precipitation in a single 24-hour period. It was a new state record, and one that statistical modeling placed as a 1,000-year flood event. Rivers swelled, the city’s stormwater system filled, and basements flooded.
When analysts used geographic information system (GIS) technology to map the damage reports against the 1837 survey records, the correlation was difficult to ignore. The flood hadn’t spread randomly. It followed the original shape of the land.
“On the Northwest Side there’s a sharp line between where the wetland is, and all of the basements back up right next to it,” said Andrew Brown, water systems data analyst at Milwaukee Metropolitan Sewerage District (MMSD).

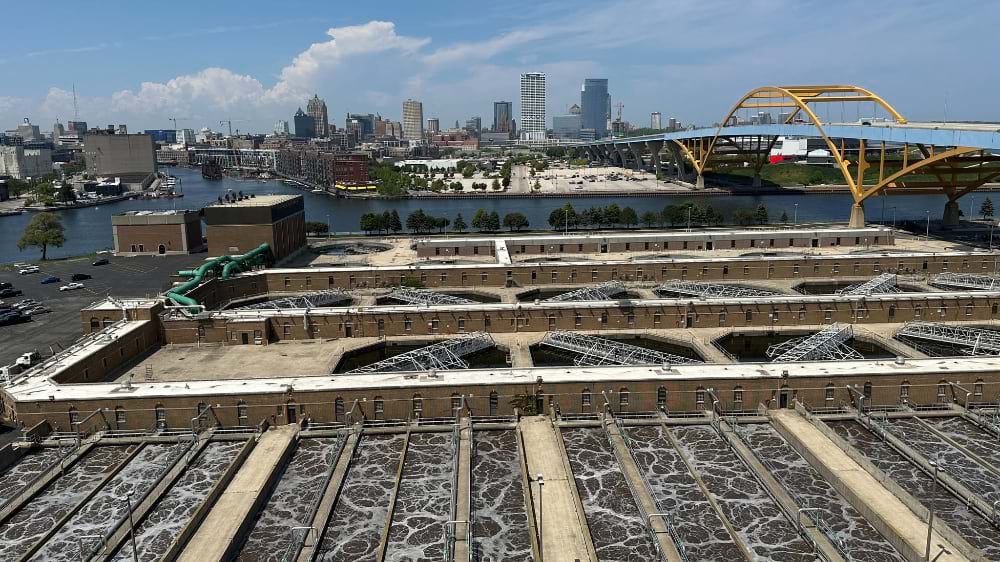
MMSD is a regional public agency whose mission extends well beyond treating sewage. Its jurisdiction covers two water reclamation facilities on Lake Michigan, three rivers—the Milwaukee, Menomonee, and Kinnickinnic—and several streams that drain into the lake. For more than 20 years, MMSD has maintained an enterprise GIS program built around a detailed spatial inventory of hundreds of physical assets: manholes, diversion chambers, miles of pipe, levees, and concrete-lined channels. That infrastructure is monitored continuously—with approximately 125,000 data tags at the water reclamation plants alone, plus 2,000 short- and long-term conveyance sites that have been tracked since 1998.
Whenever it rains, MMSD staff check storm gauge responses and recalibrate as needed. The same discipline applies to checking stormwater drains and channels. “We are permanently monitoring to make sure we aren’t missing any issues,” Brown said.
That routine watching is what makes flood response and mitigation possible. For Emily Champagne, MMSD’s geospatial services and solution manager, readiness means keeping the spatial record current and accessible—not just for internal use but also for the regional partners that MMSD coordinates with when conditions deteriorate. “This is what we do for every storm,” she said.
During last summer’s torrential rain event, the storm kept generating long past what models had anticipated.
“Several times we thought, OK, that was it—and then it kept going,” Brown said.
Milwaukee and regions across the Midwest are getting wetter, and the storms are getting stronger. What happened in the weeks and months after the flood—the analysis, the mapping, and the quiet work of building smarter systems for next time—is where the story continues.
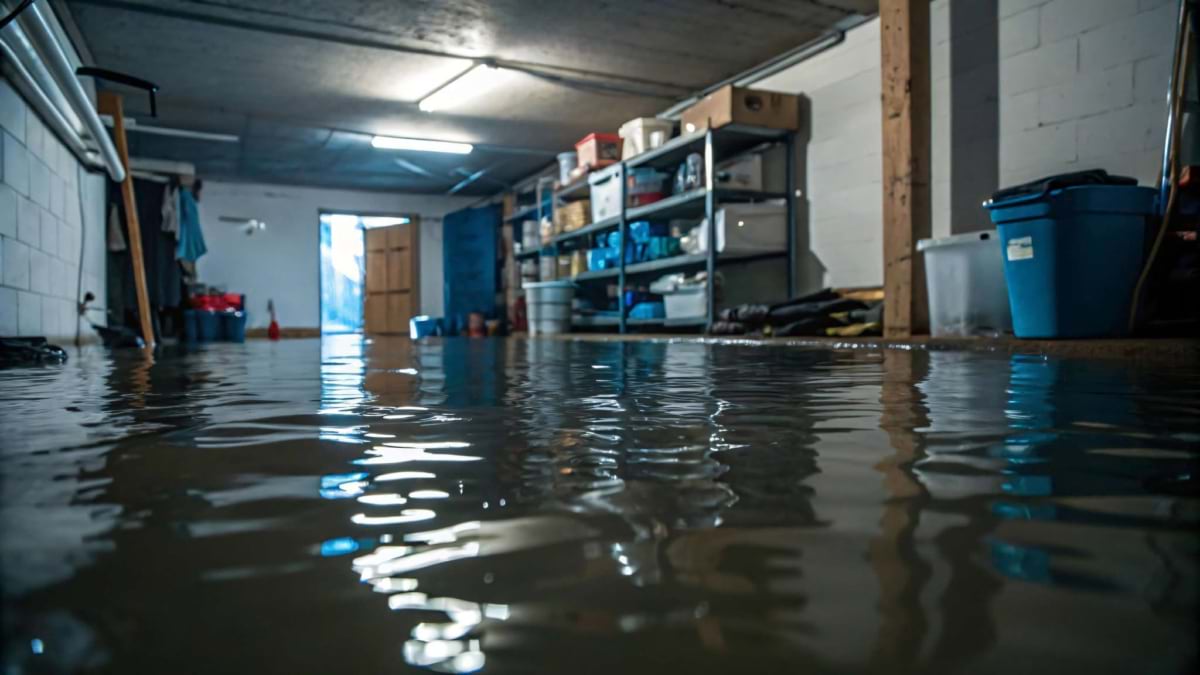
In the immediate aftermath of the August 2025 storm, MMSD staff worked with colleagues from the county as well as nearby municipalities to compile 211 damage reports in a common format for the Federal Emergency Management Agency (FEMA), enabling homeowners to file for disaster assistance. Those reports became the input for a hotspot analysis—a spatial map of damage that lets planners evaluate system performance against prior green infrastructure investments.
That hot spot analysis became the foundation for the building of a hydro-enforced digital elevation model (DEM) to see depressions and outlets where rainwater either ponds or dissipates.
“With no outlet, the surface flow doesn’t have anywhere to go, and that’s where people called in reports of flooding and wet basements,” Champagne said.
Following another serious flooding event in July 2011, MMSD partnered with University of Wisconsin-Milwaukee students to digitize the 1837 original public land survey notes and maps into GIS. That effort, completed in 2012, let staff layer historical stream paths over current digital elevation models and lidar data. This work revealed closed depressions, the low areas with no outlet where runoff ponds and the water fills basements. This analysis has helped MMSD respond to floods—including the 2025 event—by speeding up data analysis and the delivery of damage maps and reports.
“Water wants to go where it’s low, so you see some correlation,” Champagne said.
For more than 15 years, MMSD has not only invested in gray infrastructure—pipes, tunnels, and treatment facilities—but also in a parallel green infrastructure program. Across MMSD’s service area, green roofs, bioswales, and rain barrels capture rainwater before it enters the stormwater system. The August 2025 storm tested the limits of the city’s gray and green infrastructure.
“No plants or bioswales could’ve handled the volume. This was outside of anything we could have designed for,” Brown said. “Green infrastructure works across multiple scales,” Brown said. “You can see stormwater gather on big projects like the county fairgrounds and on the tiny storm guards that capture 10,000 gallons in a storm event. It all helps.”
“Green infrastructure has been a big priority for us, and it has paid off as we’re seeing more flood events,” Champagne said.
Since August 2025, Brown has been building a daily automated precipitation accumulation analysis—maps that show not just how much rain has fallen but also where it fell, how it distributed across the service area, and how patterns shift over time.
“We had a really wet April. You can see where it was the wettest and where it wasn’t,” Brown said. “Being able to zoom out and look at the whole year is what I’m trying to enable. I want people to get understanding from what we’ve collected. That’s what this is all for.”
For Champagne’s team, the path forward is all about collaboration and data sharing, working with communities to expand green infrastructure block by block, with GIS as the connective tissue between MMSD and its regional partners.
“It’s a community-wide effort to get people to understand how green infrastructure benefits their neighborhood,” Champagne said.
MMSD’s strategic plan sets a specific target: zero overflows, zero basement backups, and improved storm water management across the watershed. The district has committed to installing 8 million gallons of green infrastructure capacity in 2026 alone.
“By combining data, lived experience, and community input, MMSD and its partners can place green infrastructure where it will have the greatest impact, not only for stormwater but also for health, community well-being, and quality of life,” said Breanne Plier, certified planner, director of integrated watershed management at MMSD.