

June 6, 2023 |
Carrie Speranza | Public Safety
September 9, 2025
When Hurricane Beryl slammed into Houston in summer 2024, it didn’t just knock out power lines—it exposed the intricate web of dependencies that keep modern life running. Hospitals lost backup power when fuel trucks couldn’t navigate flooded roads. Water treatment plants went offline when electrical substations failed. Cell towers went dark, cutting off emergency communications when people needed them most.
This is the scenario that keeps Alex Philp awake at night. As MITRE’s senior principal scientist, Philp has spent four years working to understand how America’s critical infrastructure systems are interconnected and where they’re most vulnerable.
“We’re more at risk today than we were in 2001,” said Philp, who has spent much of his career working on infrastructure vulnerability assessments. “The question is, with less money, how do we reduce the greatest amount of risk?”
MITRE, a nonprofit that operates six federally funded research and development centers, has been solving the nation’s hardest technical problems since 1958. It’s now taking on one of its most ambitious challenges yet: building a national map of the complex—and interdependent—relationships between America’s critical systems in unprecedented detail.
“Not everything is equal—not every pipe, not every bridge, not every cyber vulnerability,” Philp said. “That’s what we’re trying to show.”
The mapping project, known internally at MITRE as Project Homeland, emerged from MITRE’s environmental analysis program. For three years, the MITRE environmental analysis team studied large-scale chronic problems like extreme heat and water scarcity, trying to understand the effects across government and private industry.
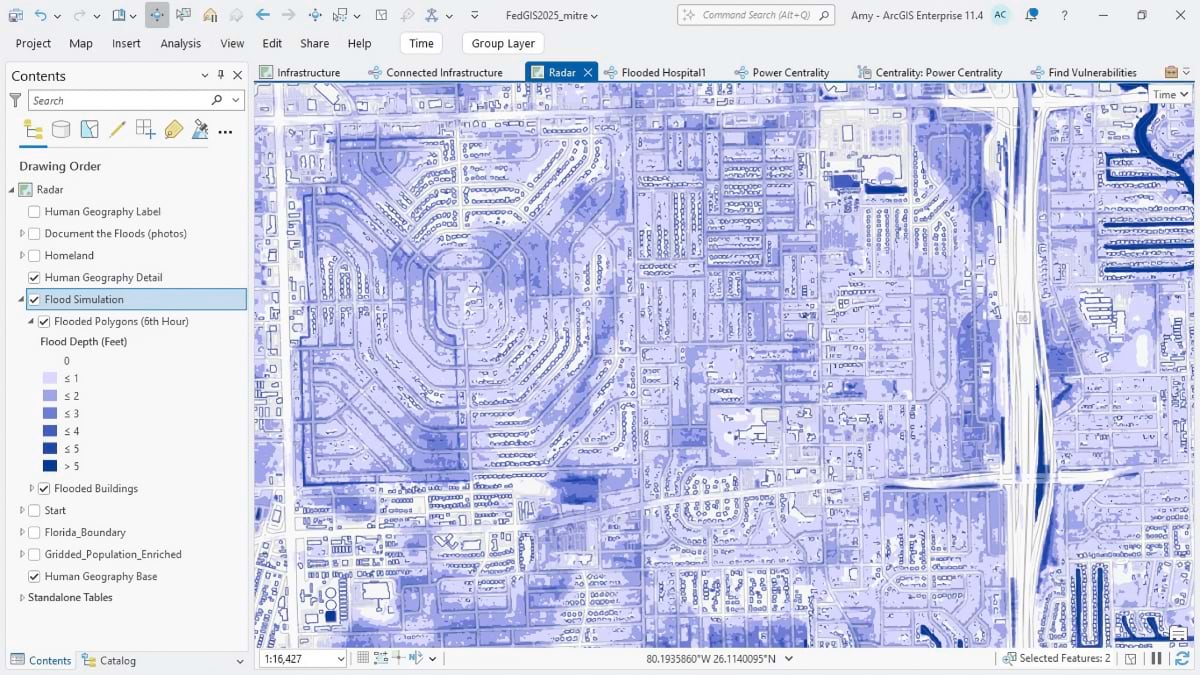
“We’re basically looking at the impact of extreme weather events against complex systems,” Philp said. The team focused on particularly challenging scenarios: stalled weather fronts that, he noted, are “incredibly hard to predict and forecast” but can trigger devastating flooding across multiple states.
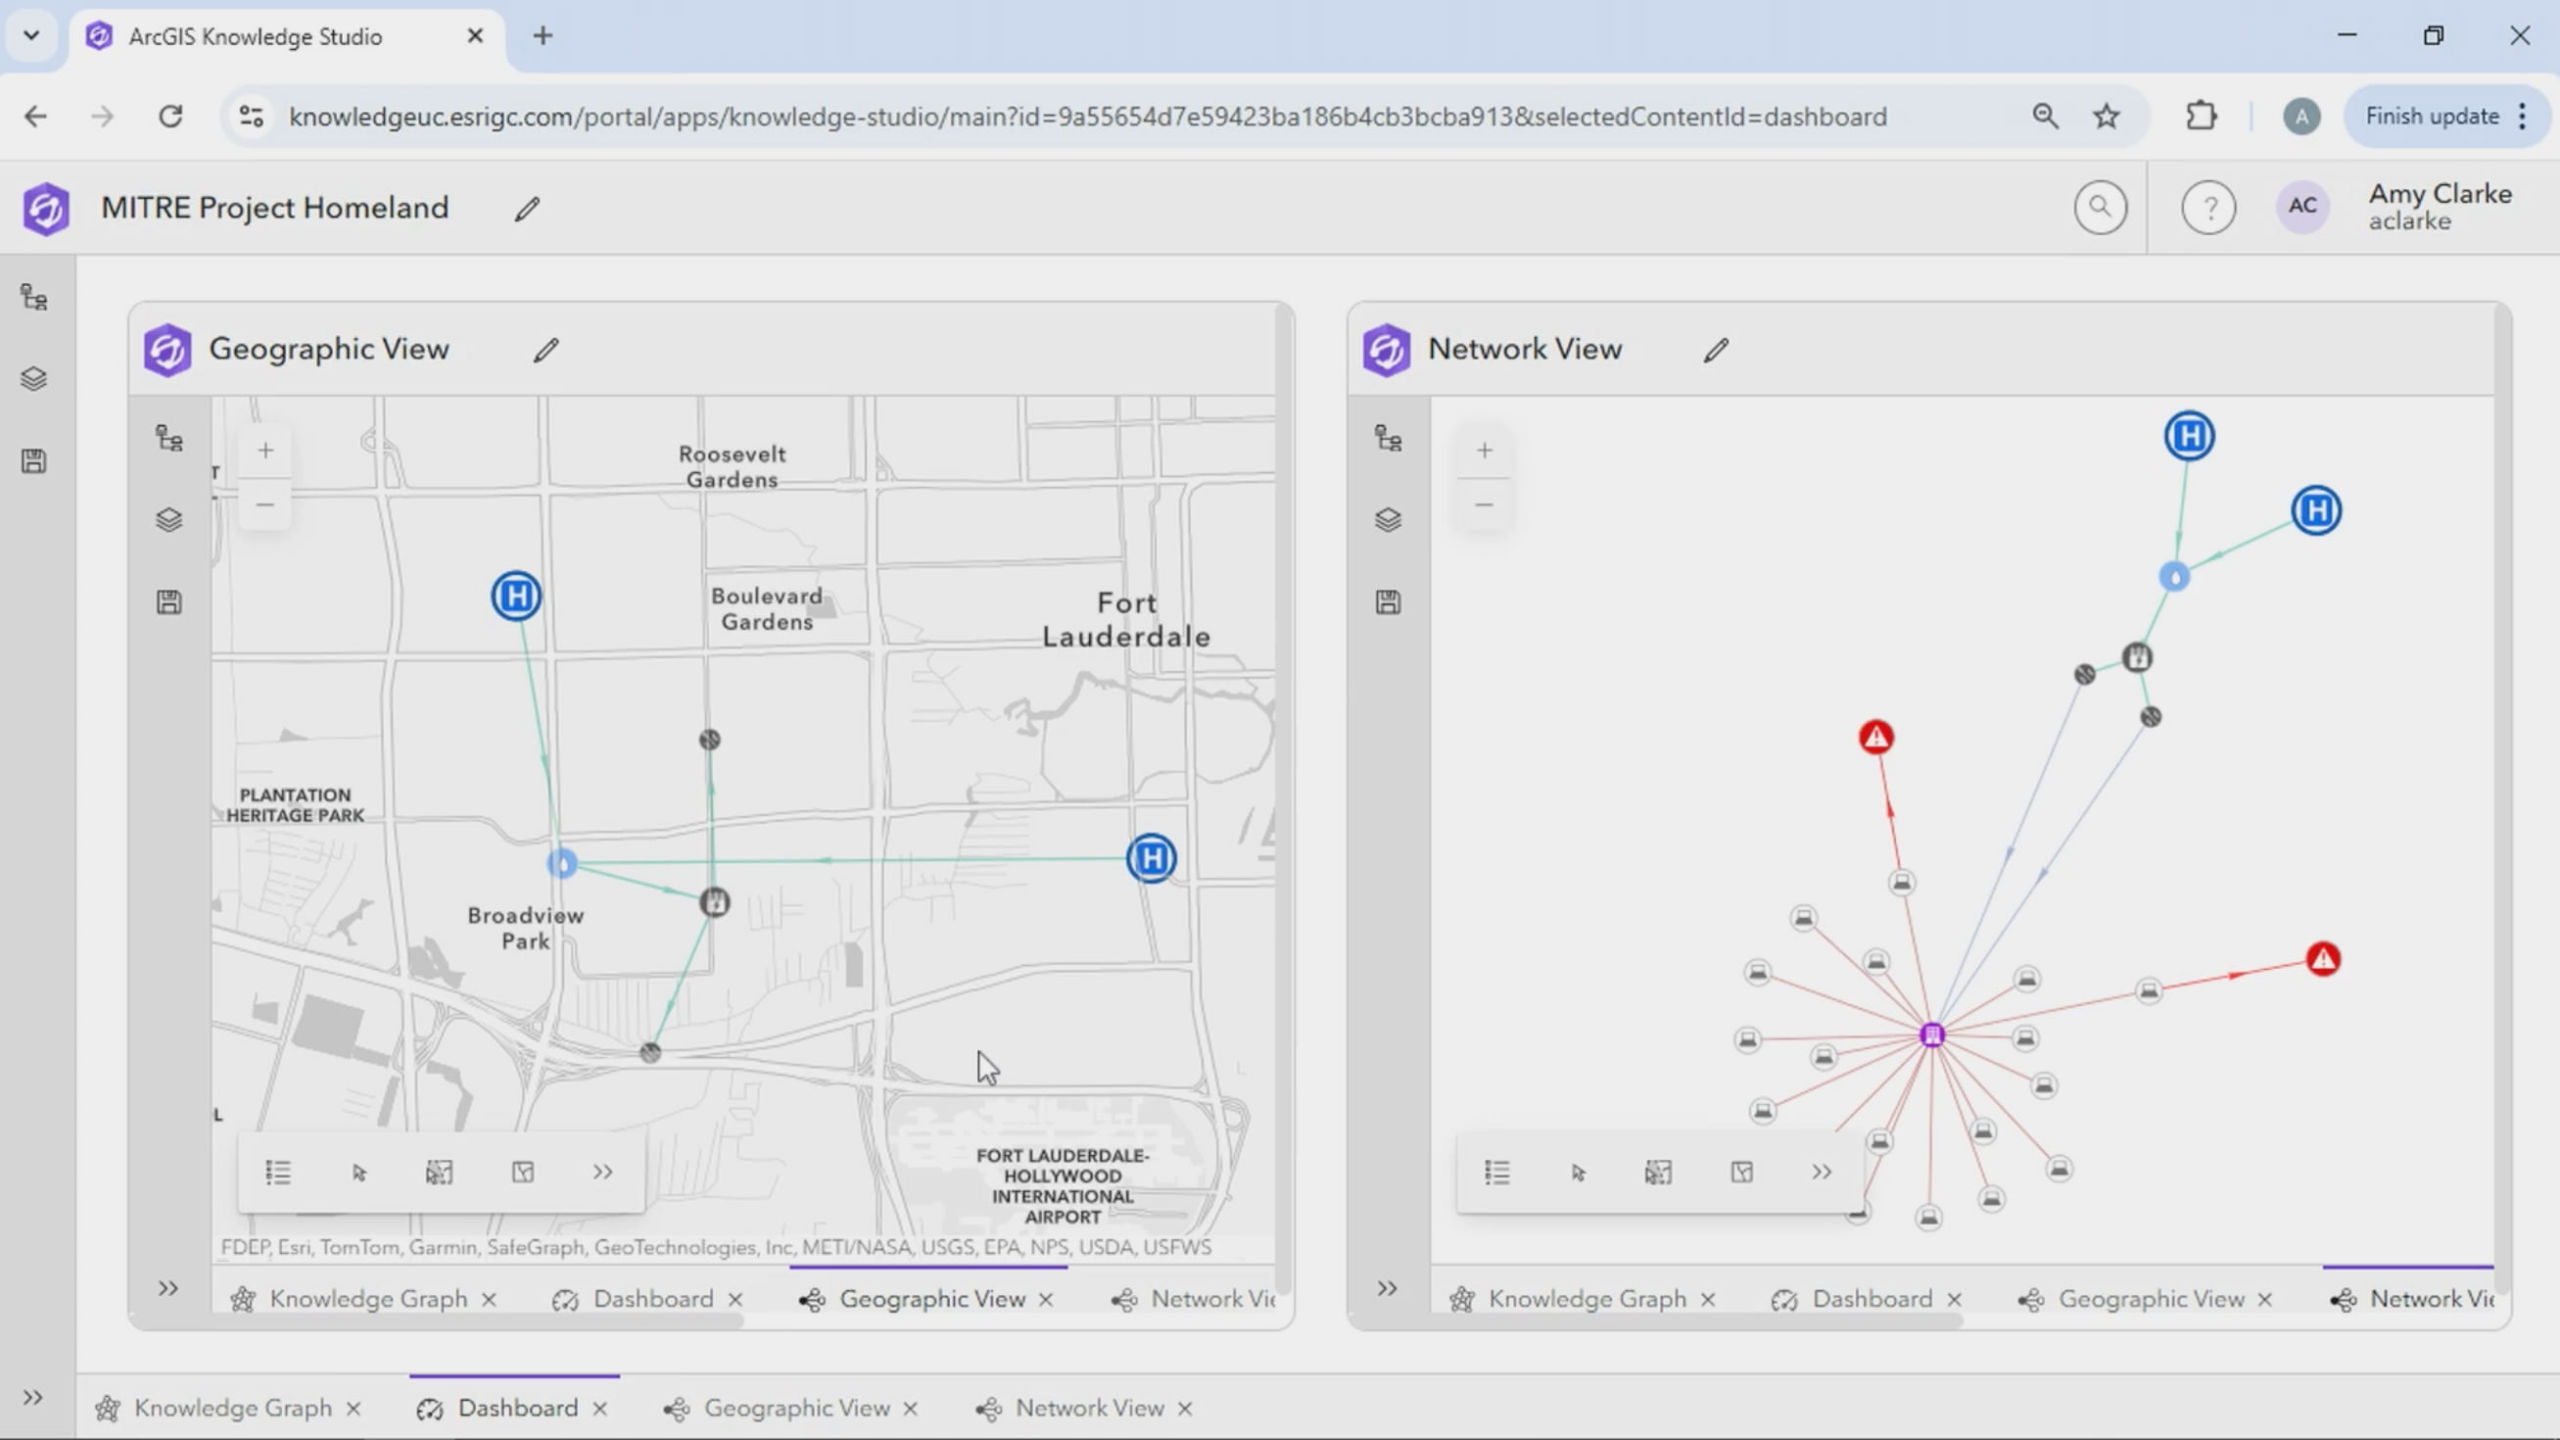
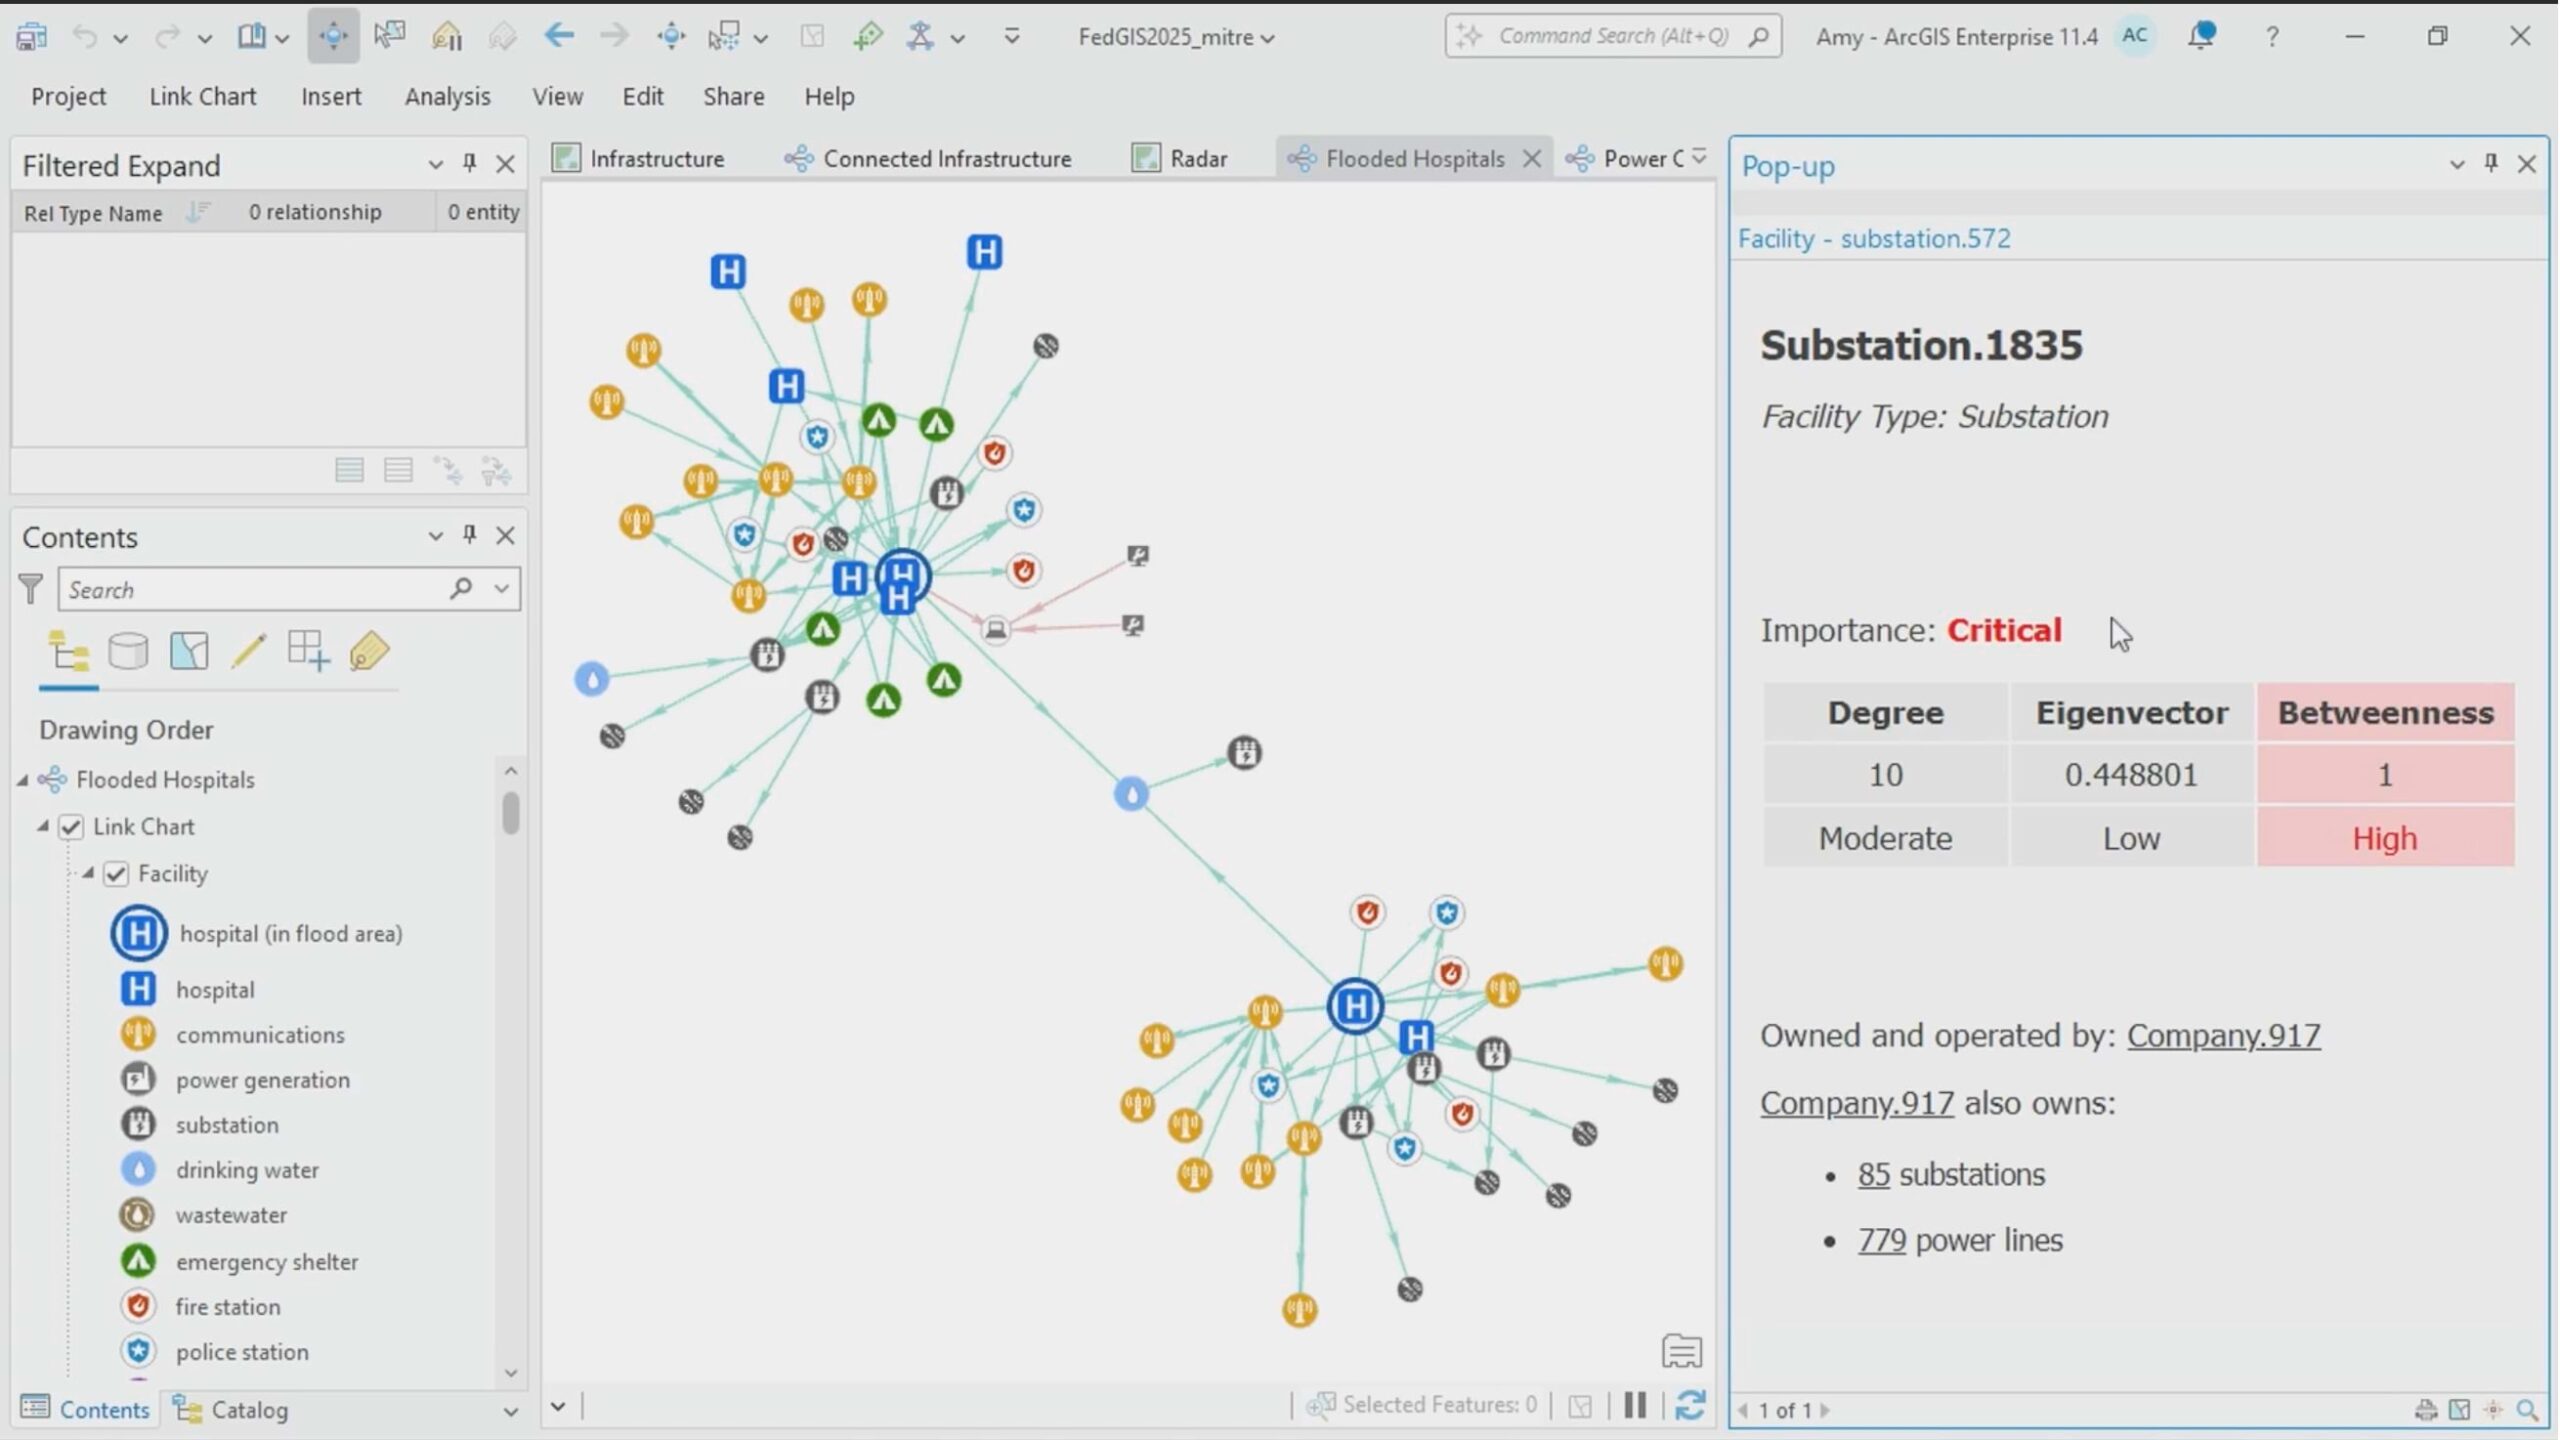
Working alongside principal computer scientist Ryan Hollins, the team members began developing prototypes. They used Esri’s ArcGIS Knowledge, spatial knowledge graph software designed for advanced analytics and rapid pattern detection, to interrogate infrastructure asset data.
“We needed to know how they’re connected,” said Hollins, who led the effort. “Hospitals are connected to power and water, and we can use these graphs to answer questions about what depends on what.”
MITRE worked with Amy Clarke, a senior solution engineer on Esri’s ArcGIS Knowledge team, who offered feedback and guidance on the project. “Spatial analysis can reveal implicit relationships,” Clarke said. “It’s important to choose a graph data model based on what analytic questions you want to answer with what data you have, and sometimes spatial relationships are the key to understanding dependencies in a network. Once we have these relationships, graph analytics tools like centrality can easily identify the most important nodes in the network.”
What emerged was something unprecedented: a spatial knowledge graph that could power dynamic visualizations showing exactly where critical infrastructure exists, how it’s all connected, and where those connections create the greatest vulnerabilities.
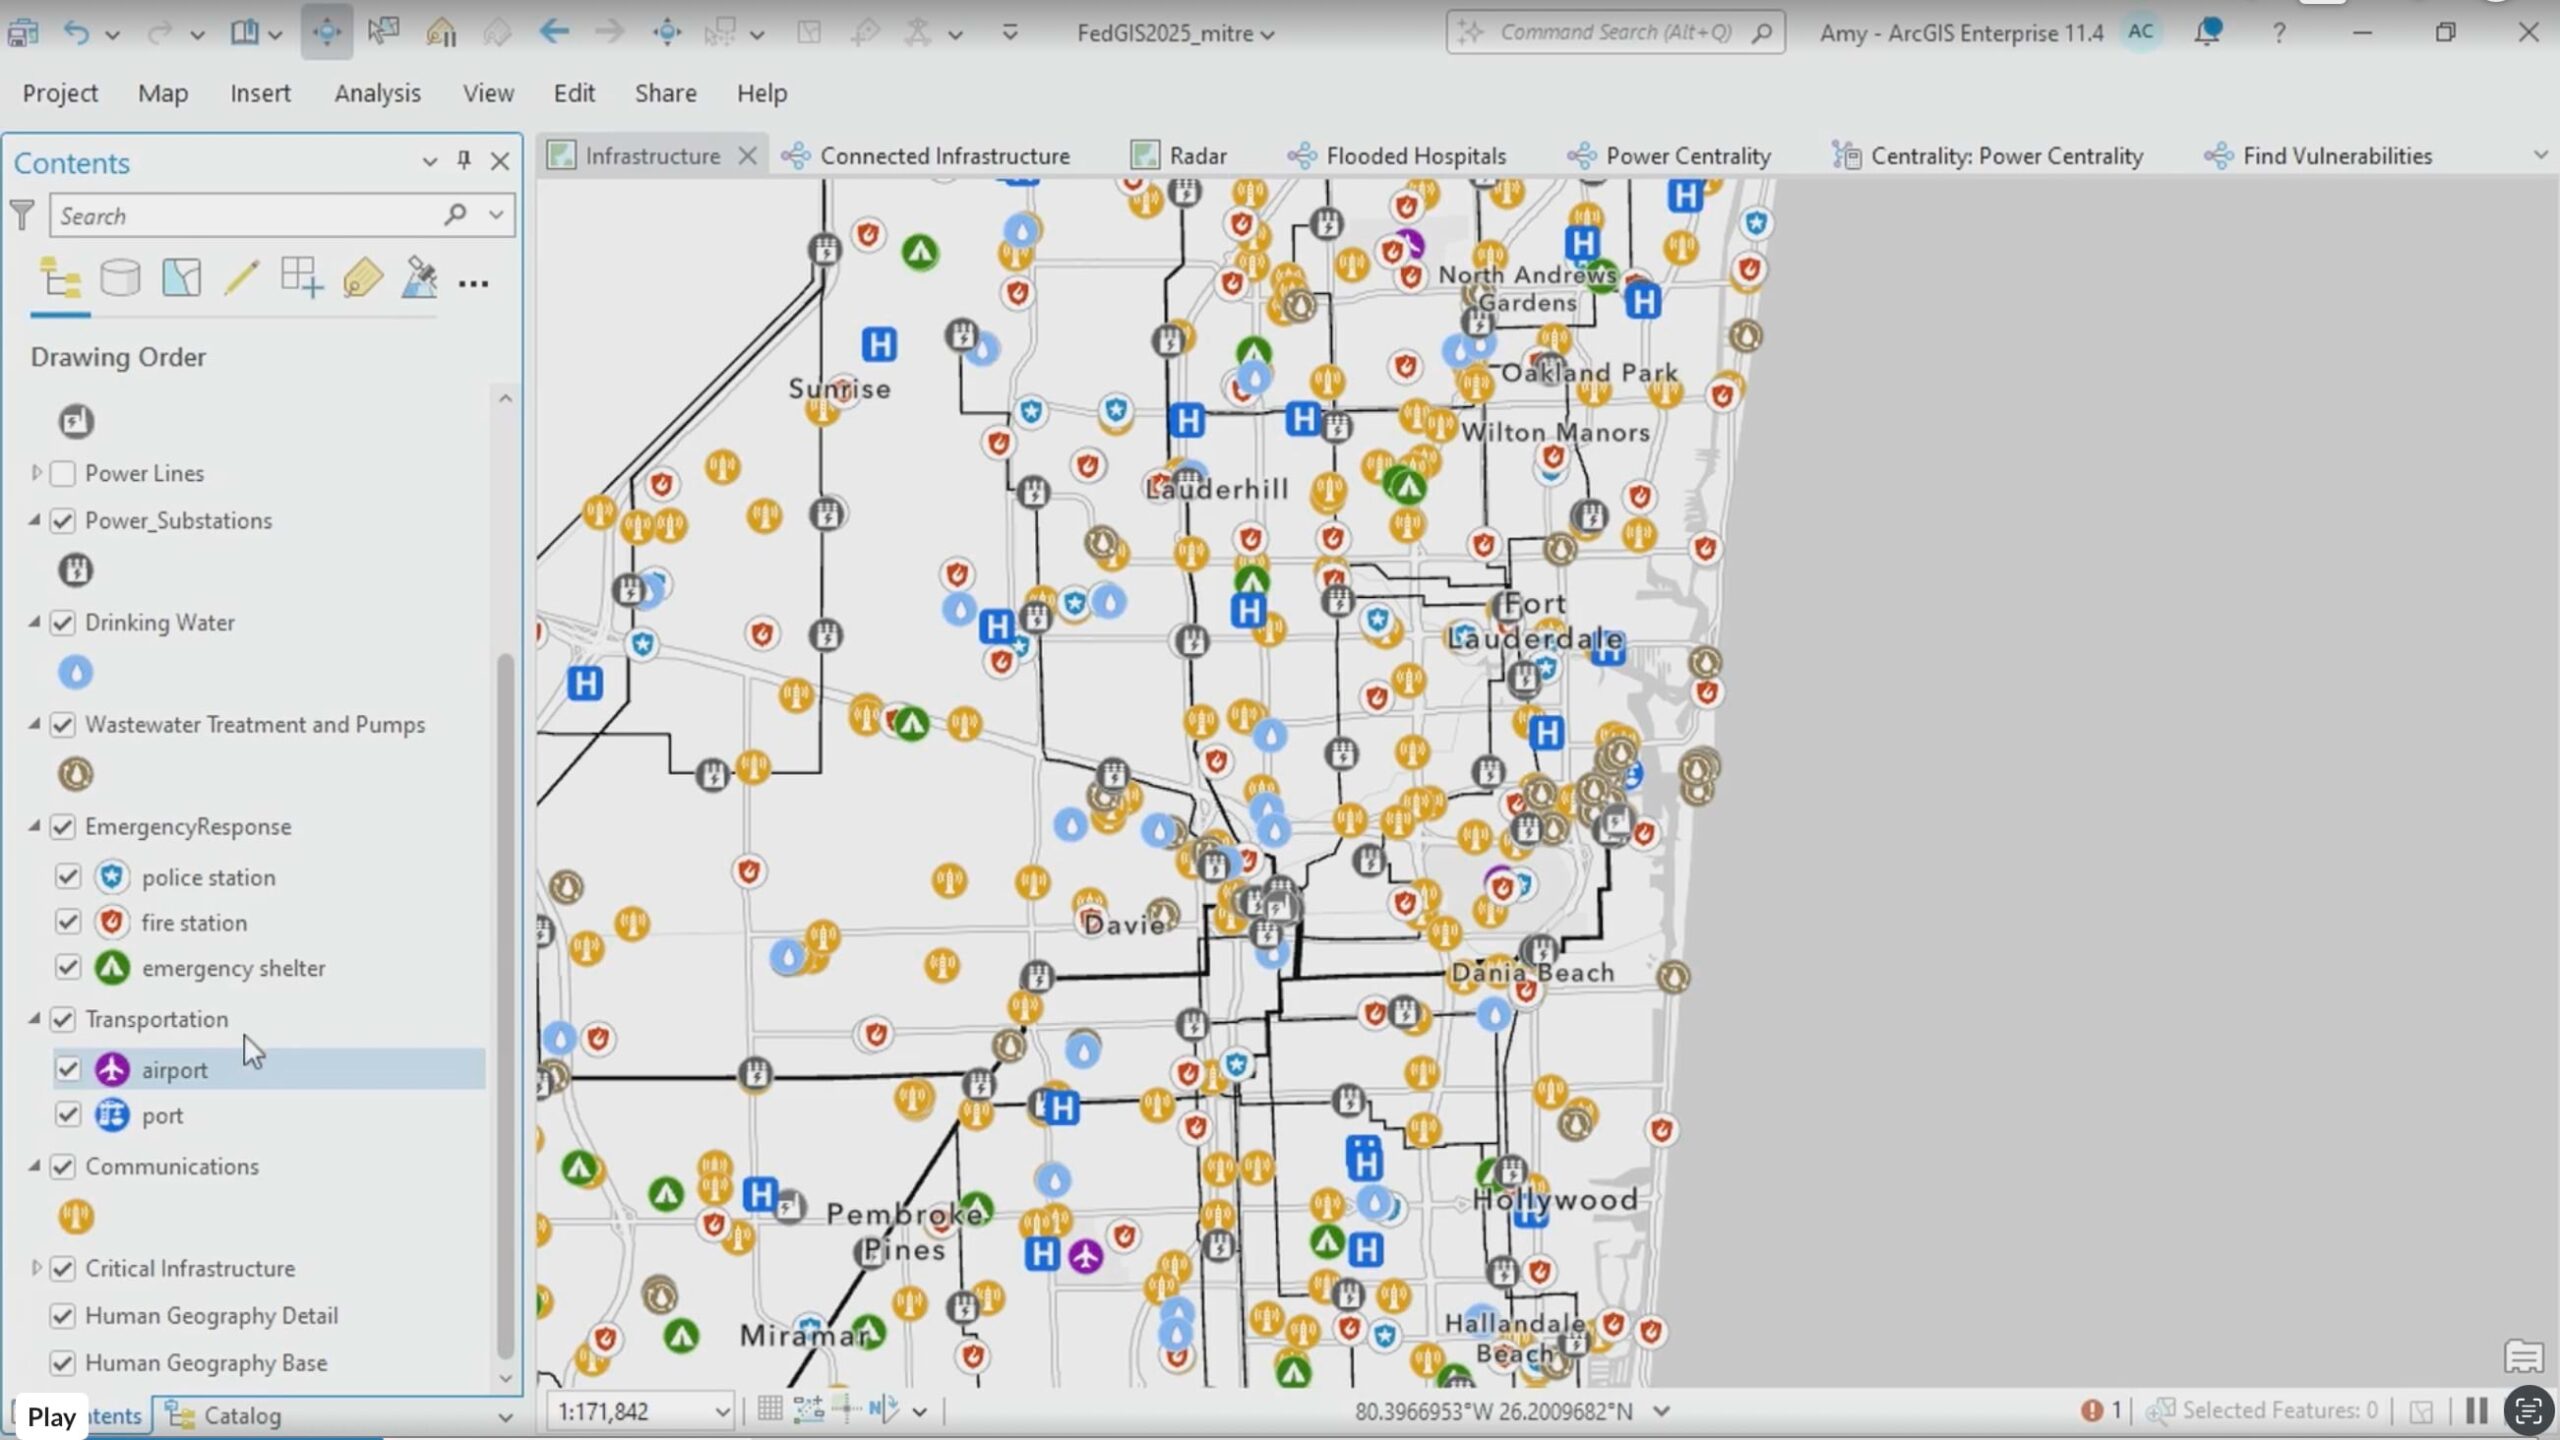
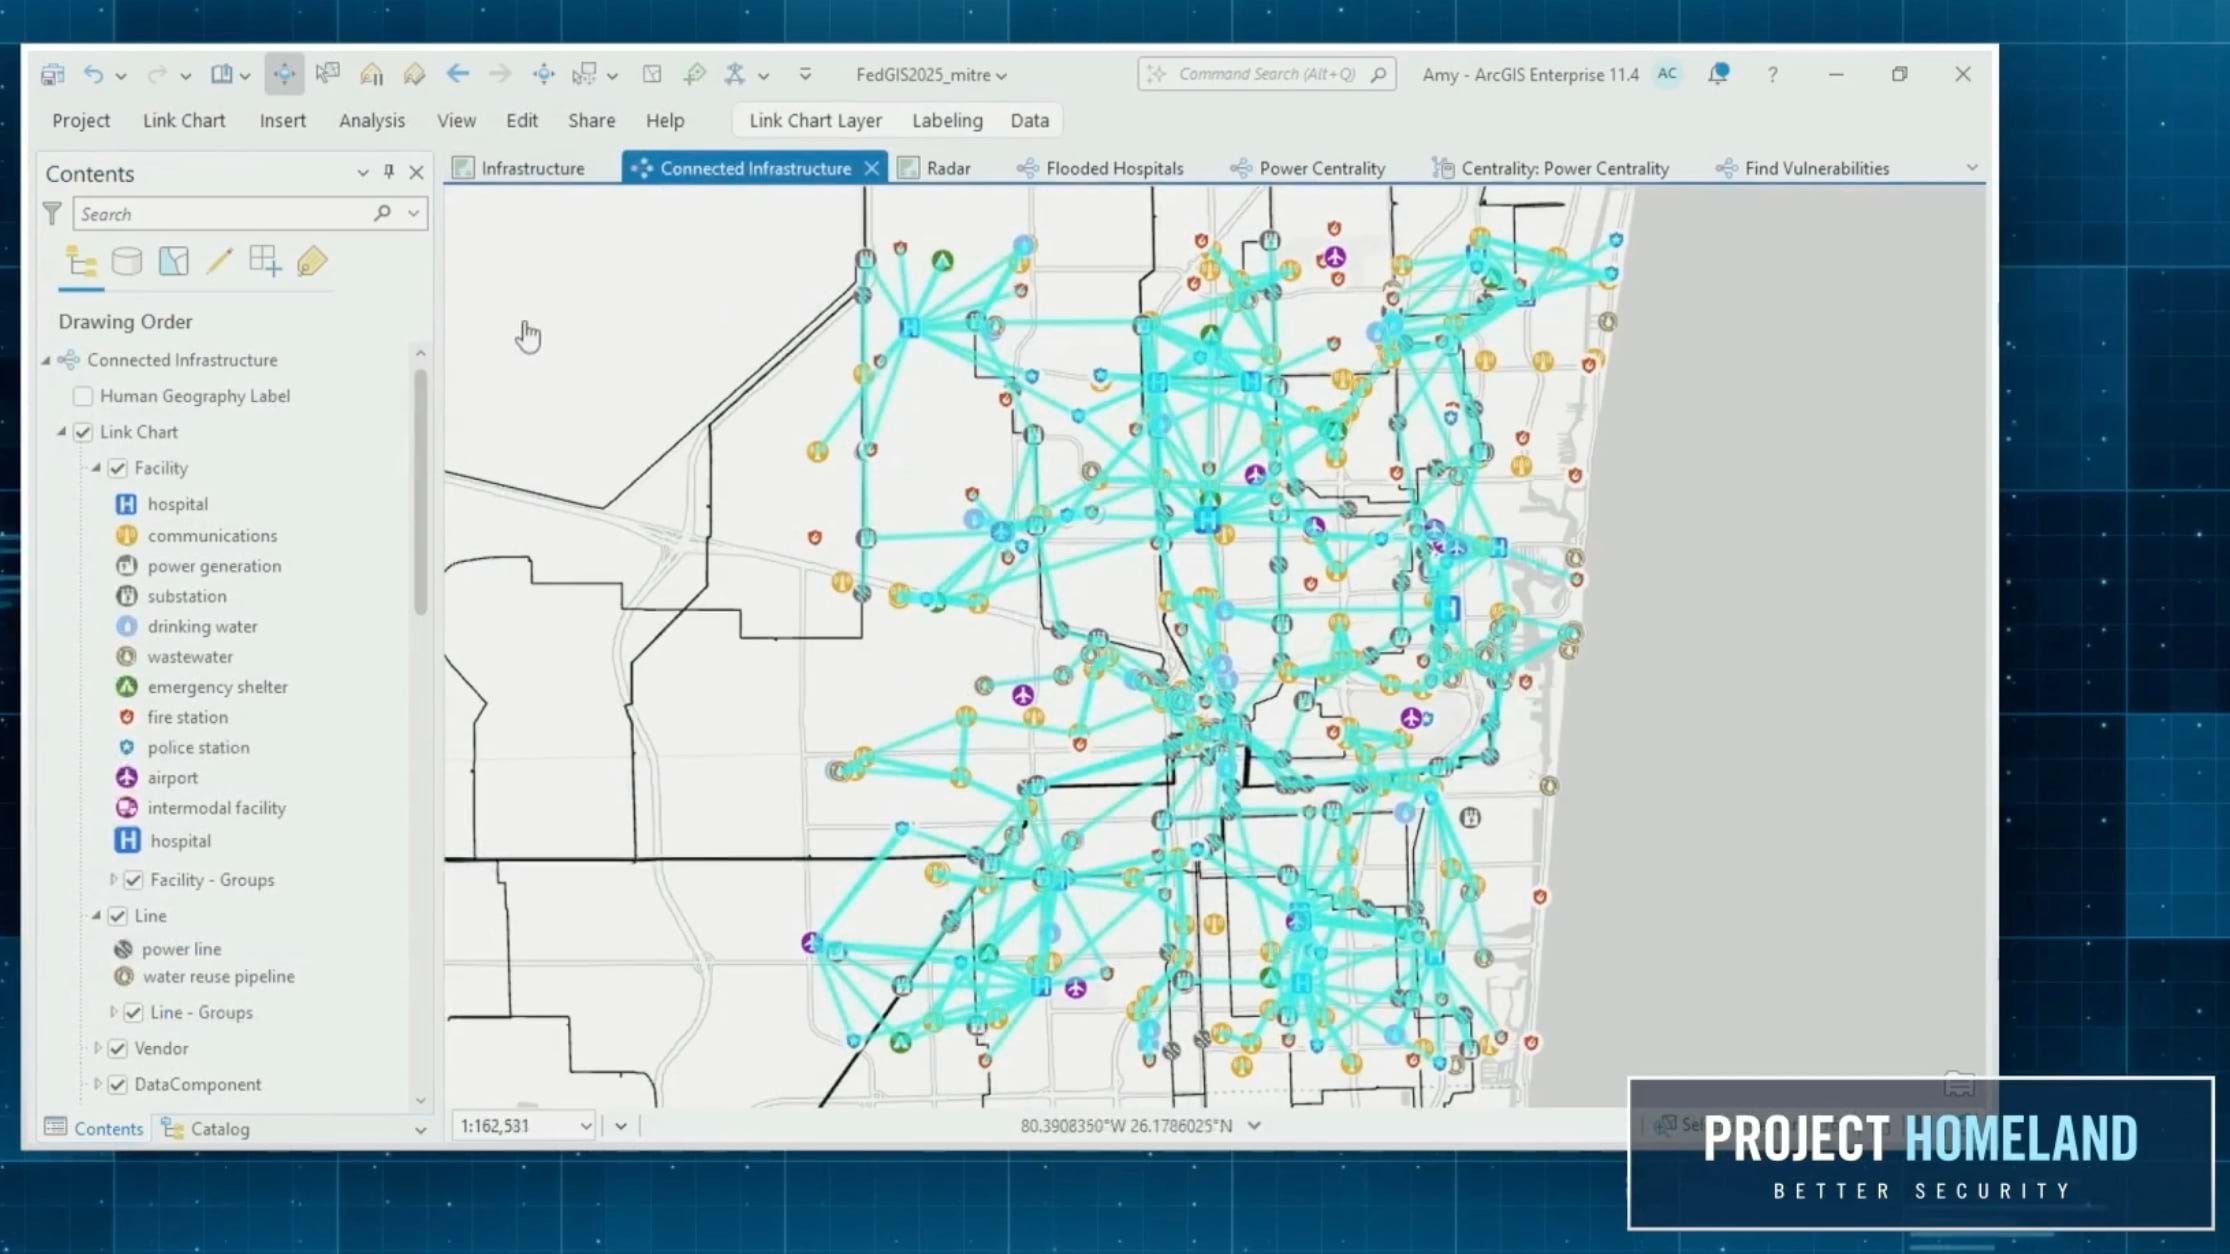
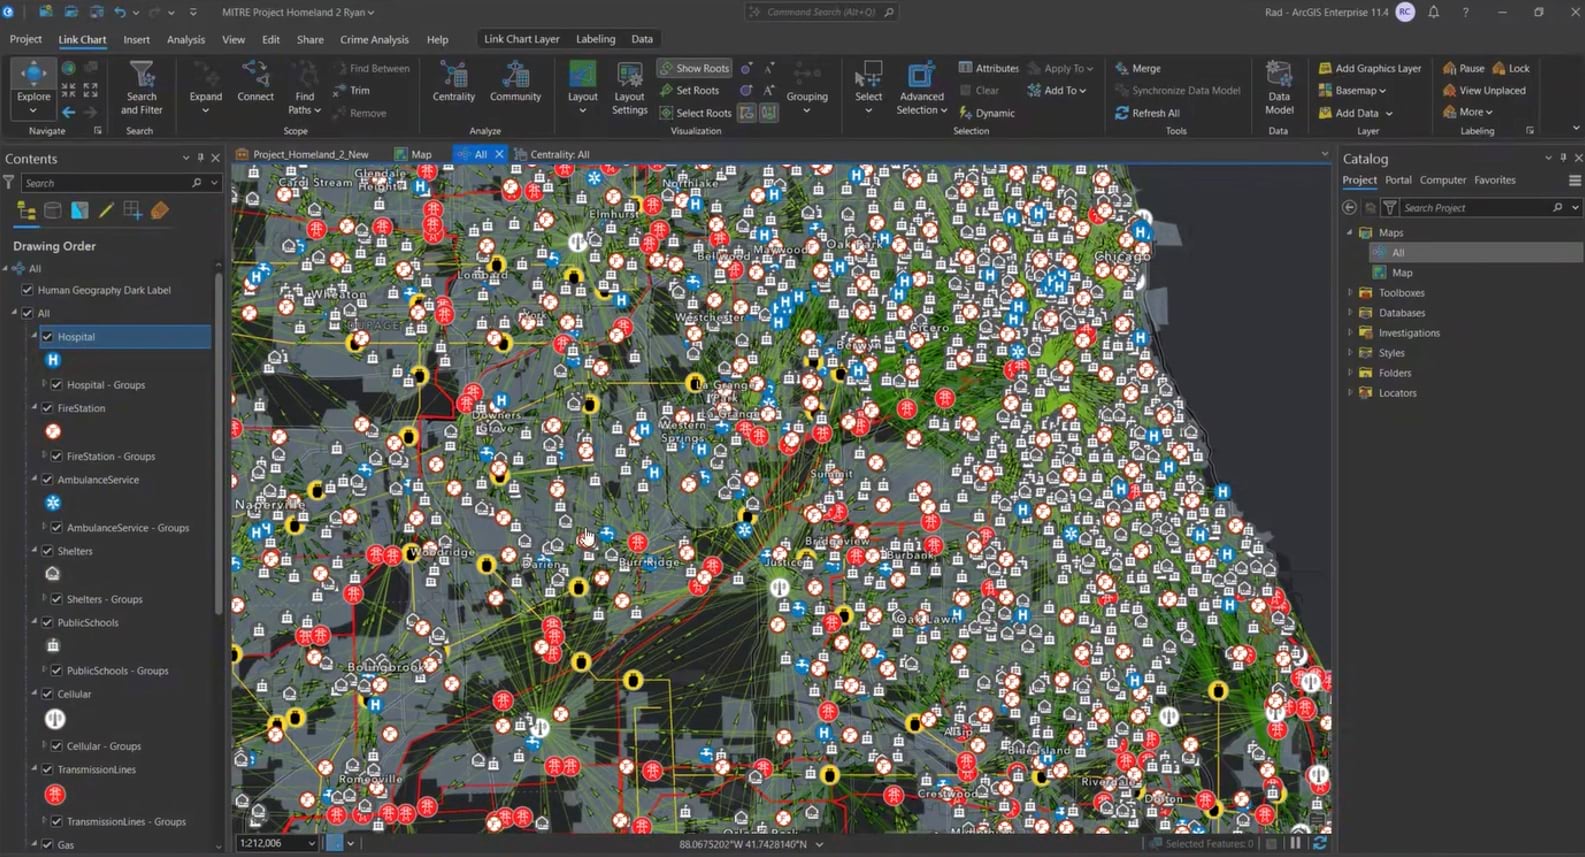
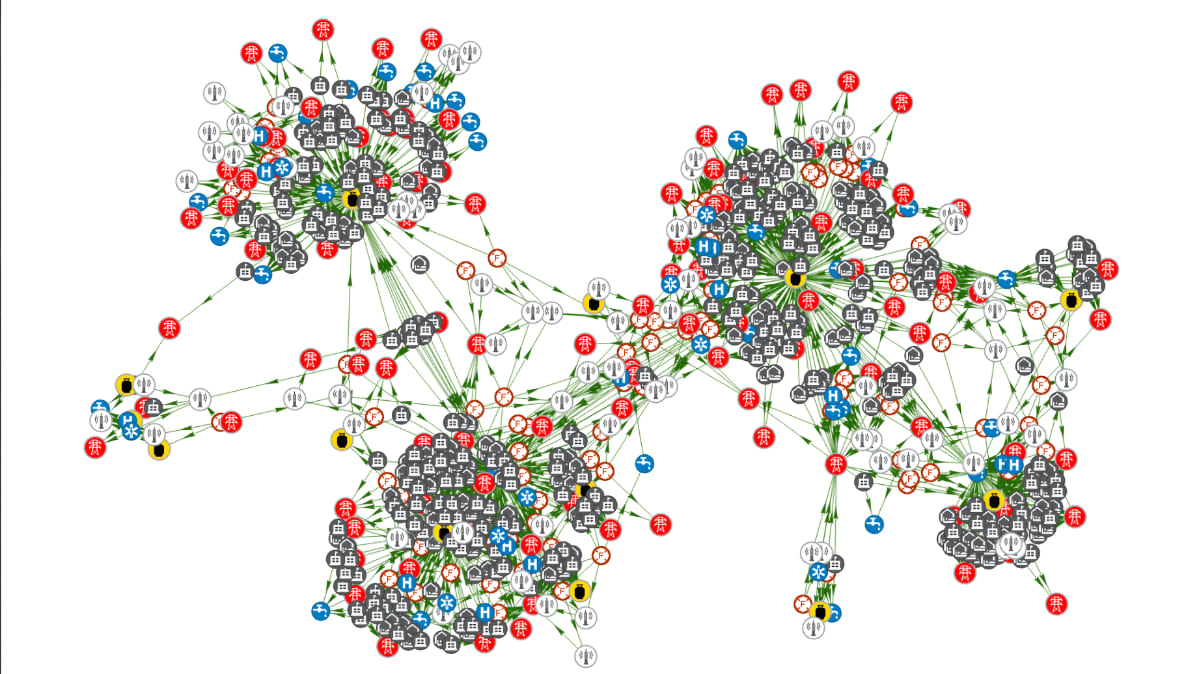
The initial results were sobering. The team mapped just eight key infrastructure layers across the entire United States—including energy, water, broadband, and transportation—with a resultant network graph that revealed numerous interdependencies. The sheer number of infrastructure points and the intricate web of connections among them were staggering.
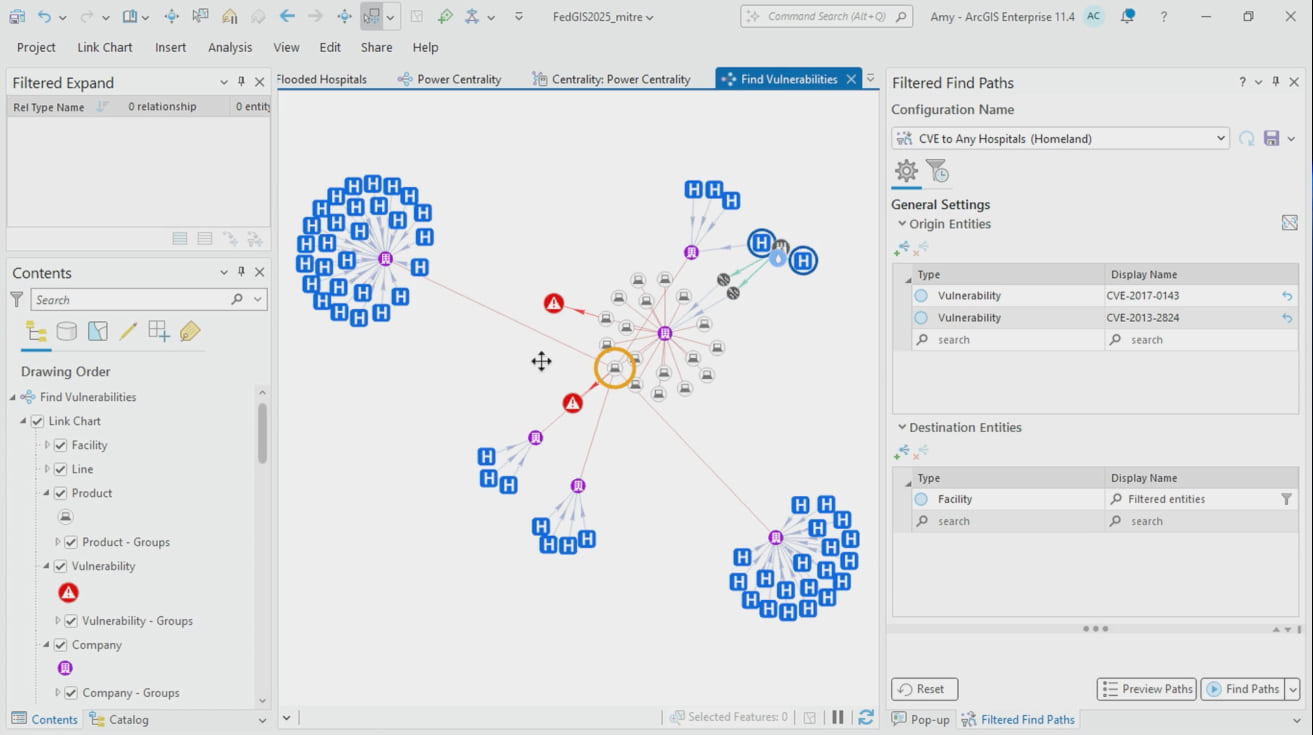
The graph revealed not only the complexity but also enabled staff to see each entity, such as a hospital, in isolation related to its dependency on water and power. Looking at the graph on a link chart is much different from looking at a map. The graph contains nodes and lines with connections that are color coded based on their level of importance. Analysts typically view a map and graph side by side to see the locations and connections on the map while also looking at the importance and vulnerability of those connections on the link chart. Sometimes, the scale and complexity of the data make it difficult to identify patterns or key entities through visual analysis alone. Analysts use ArcGIS Knowledge’s graph analytics to automatically identify the most critical entities in the network, eliminating the need to rely solely on visual inspection.
The map and graph together shed light on not just infrastructure networks but also human networks such as the highly skilled workers who maintain the infrastructure. The graph can reveal who works with whom, while the map shows where they work and can even track their location in real time.
Conventional approaches to infrastructure protection have treated each system in isolation, managing and maintaining each one in isolation with a “stovepipe perspective,” according to Philp. The reality is messier and more dangerous. With maps and graphs, we can see across the systems, using both the science of geography and the data science of graph theory.
Philp referenced biologist E.O. Wilson’s observation that the future will be defined by people who can understand complex systems holistically rather than in isolation (see sidebar). Wilson was renowned for his work in sociobiology and systems thinking, advocating for interdisciplinary approaches to understanding complex ecological and social systems.
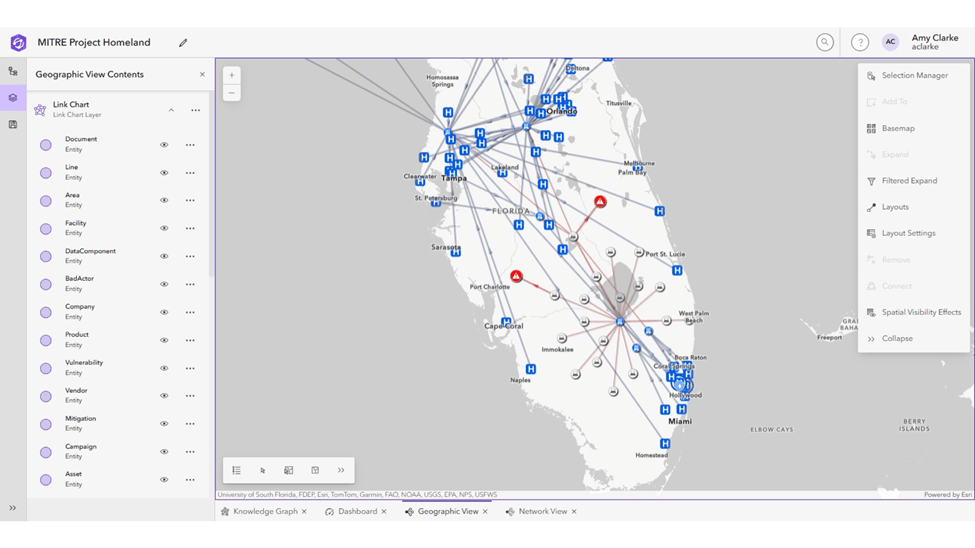
The breakthrough in Project Homeland came from such an approach. The team gathered detailed data about critical infrastructure and then used graph data science tools in ArcGIS Knowledge to analyze dependencies, revealing the web of vulnerabilities from the national scale down to individual city blocks. In Fort Lauderdale, for example, the system could show how a flood affecting one neighborhood’s electrical substation might upset water treatment systems, hospitals, and emergency services across the region.
Dr. Mark Peters, MITRE’s president and CEO, explained the value of this technology-driven work: “When you’re dealing with the complex challenges that we have today, if you don’t have cutting-edge GIS frameworks to understand spatially how it evolves, you’re not attacking the problem the right way.”
MITRE’s position as a federally funded research and development operator provides a distinct advantage in a number of ways.
Unlike private companies, MITRE is legally prohibited from competing with industry, making it a trusted intermediary that can work with both government agencies and private sector partners.
“We are that independent third party,” Philp emphasizes. “The thing most essential to our brand is trust.”
MITRE regularly receives sensitive data from airlines, utilities, and other critical infrastructure operators—information they won’t share with anyone else. Their priority is not profit. It is to help reduce systemic risks.
This trust extends to MITRE’s collaboration with private sector partners. MITRE needs cutting-edge technology from trusted partners—like Esri—that are committed to protecting sensitive customer data.

Critical US infrastructure faces intensifying challenges from extreme weather events and sophisticated cyber threats. Meanwhile, the insurance industry is retreating from high-risk areas, leaving communities and taxpayers to bear increasing costs.
“The pace of change in both threats and technology means we’re constantly playing catch-up,” Peters said. “There are adversaries and challenges that are evolving faster than our traditional approaches can handle, which is why we need to fundamentally rethink how we understand and protect these interconnected systems.”
For MITRE, this rethinking is the ultimate goal. That can happen through widespread adoption of holistic infrastructure analysis and the democratization of key data.
Maps and graphs are essential tools, but they serve a higher purpose: better decisions. Philp envisions a system where local emergency managers from US cities of all sizes can contribute data and insights while benefiting from a national perspective on infrastructure interdependencies.
As Project Homeland evolves, Philp remains focused on the bigger picture: “Our job is to try to understand how to improve the lives of millions of Americans.”
Learn more about how GIS is applied to protect critical assets and unify security missions.