


December 21, 2021 |
Multiple Authors | GIS for Good
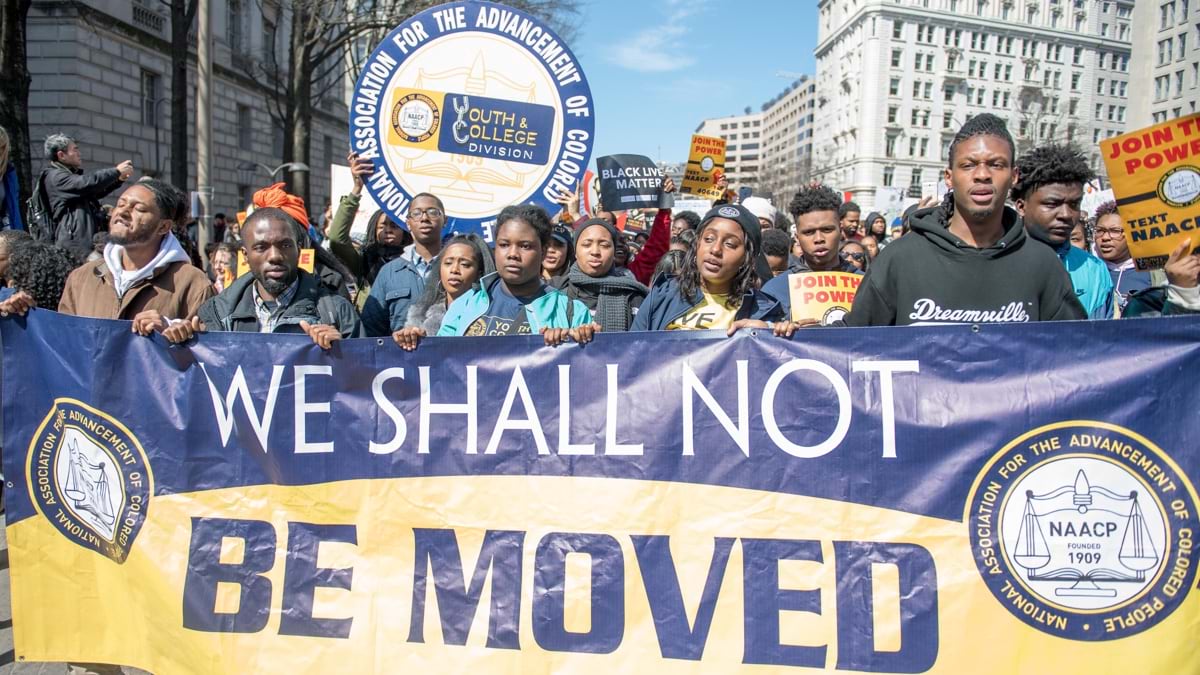
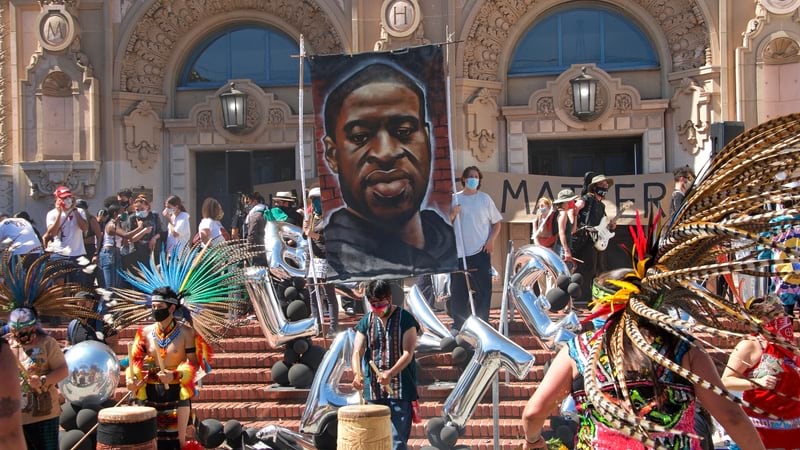
America’s oldest and largest civil rights organization, the National Association for the Advancement of Colored People (NAACP), plans to use the power of maps to oppose and prevent systemic inequalities.
Maps and geography have played a central role in furthering discriminatory policies and practices that deny some people equal opportunities. Redlining in mortgage lending and redistricting to tilt elections and public school assignments are some examples of map-driven tactics that support unfair treatment.
Now, using smart maps and advanced analytics from geographic information system technology (GIS), the NAACP has repositioned itself as a monitor of inequality in an increasingly complex world where the strategies for creating privilege and, conversely, inequity are evolving. A geographic approach has gained importance in the civil rights movement because data-driven maps can help leaders identify and prioritize the most harmed places.
“We are embracing this idea that as technology moves, so goes the world,” said Yumeka Rushing, the NAACP’s chief strategy officer, who is charged with accelerating the shift toward innovation. “We’ve got to be a part of that movement in leveraging new technologies to open up windows of opportunity.”
As awareness of systemic discrimination and racism grows, society and public policy are slowly changing. While racial discrimination still exists, leaders at the NAACP say there is a greater sense of will and purpose to confront racial injustice. In part, this is because the data being uncovered by the NAACP and other justice organizations is hard to ignore.
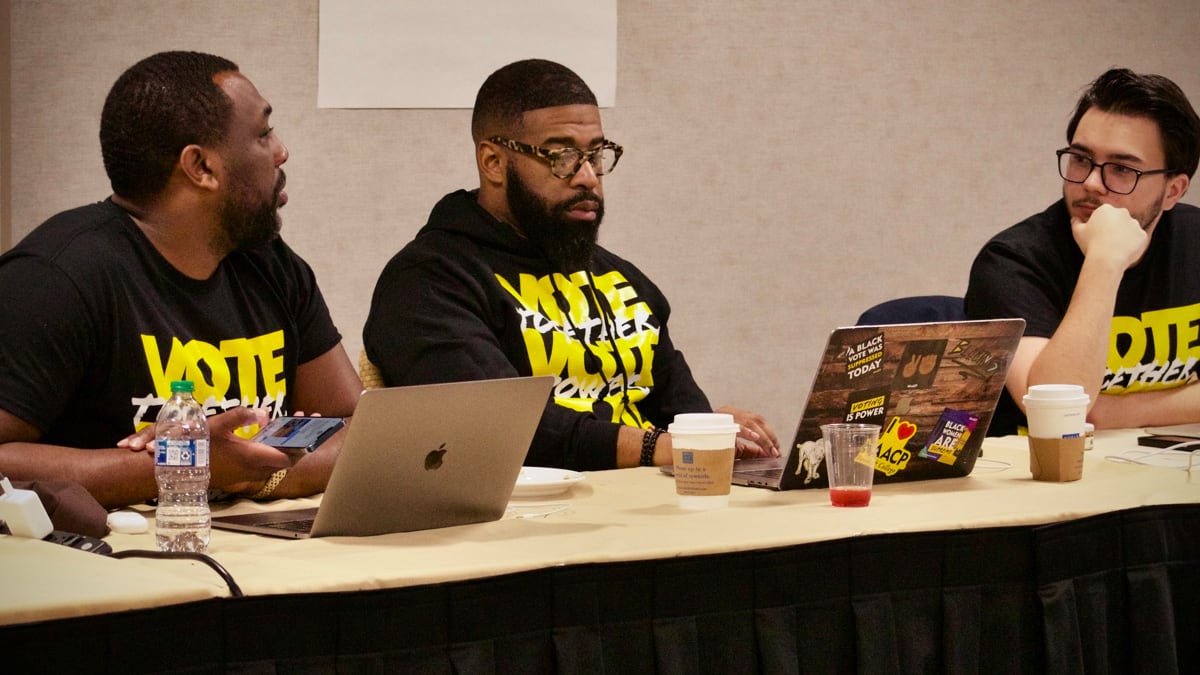
Thanks to the efforts of individuals and community organizers, the nation is seeing more action against practices like dumping harmful waste in Black neighborhoods and denying access to the ballot.
Meanwhile, through the Justice40 initiative, the White House is directing 40 percent of federal infrastructure investments to communities of color—where public and private investments have lagged or been diverted or withheld, causing generational disparities. That redistribution of investments will expand broadband internet to communities where it is lacking, many of them Black. And there are growing demands for greater corporate accountability, including targeted advocacy toward companies that create toxic air pollution disproportionately impacting the health of people in Black communities.
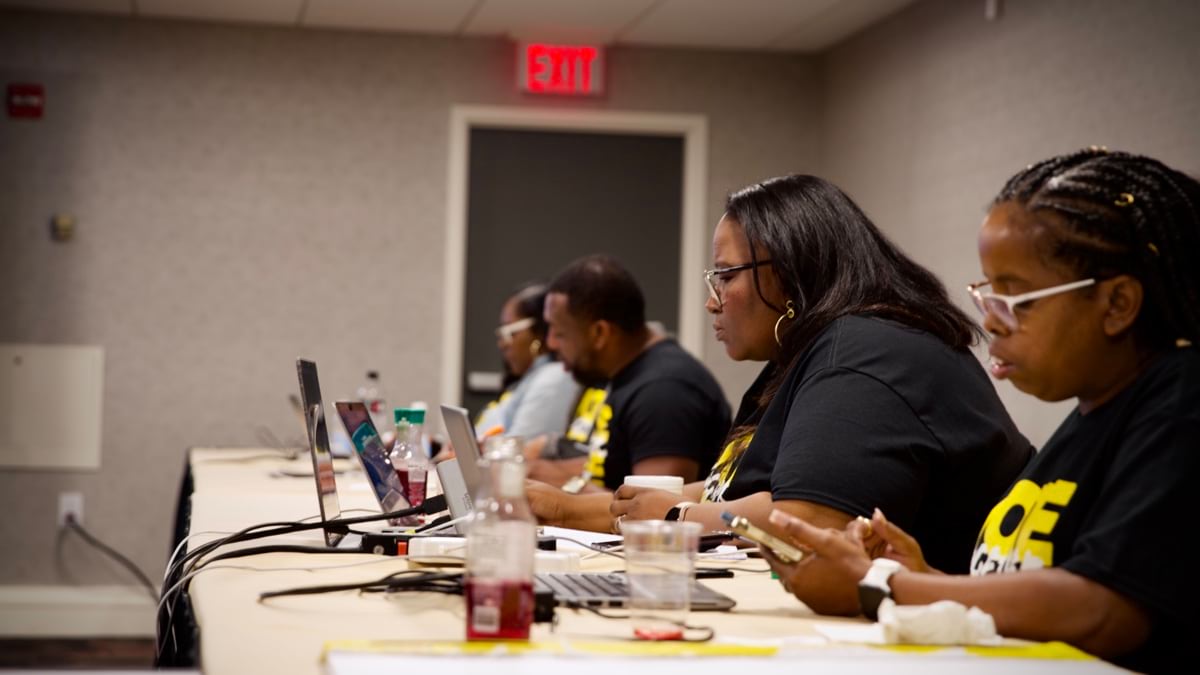
The need for community organizing informed by authoritative, place-based research, data science, and mapping has never been more important. That’s why the NAACP has embraced GIS as a strategic tool for making its activism more personal, relevant, engaging, and effective.
The NAACP’s civil rights advocacy and activism, much of it carried out through local chapters, aims to improve life expectancy and other outcomes for African Americans. Programs and initiatives focus on protecting voting rights and pushing for economic inclusion, environmental and climate justice, access to world-class education, as well as opportunities that help develop the next generation of leaders. Protecting the lives and interests of Black people also requires identifying and eradicating harmful and devaluing messaging and imagery about people of color.
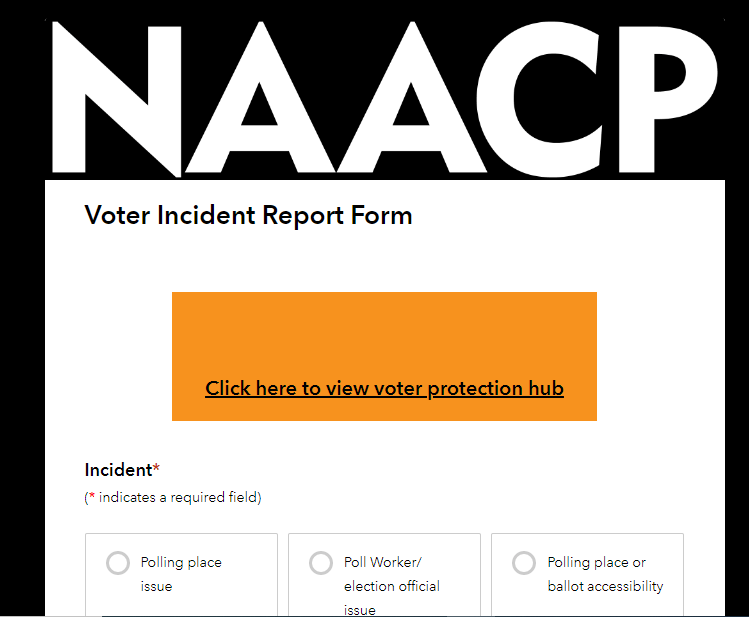
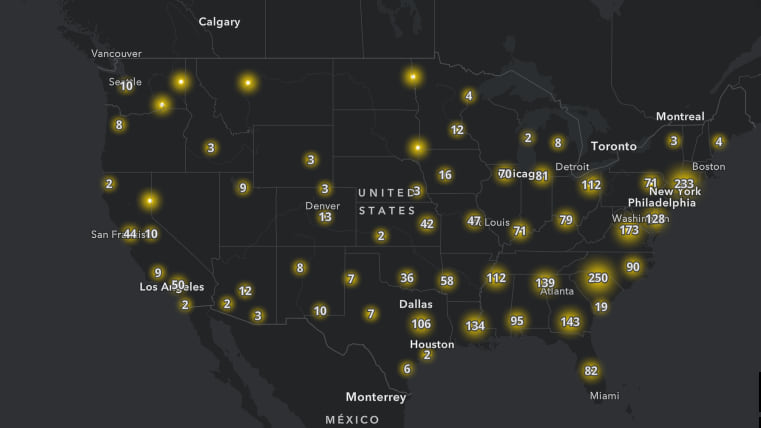
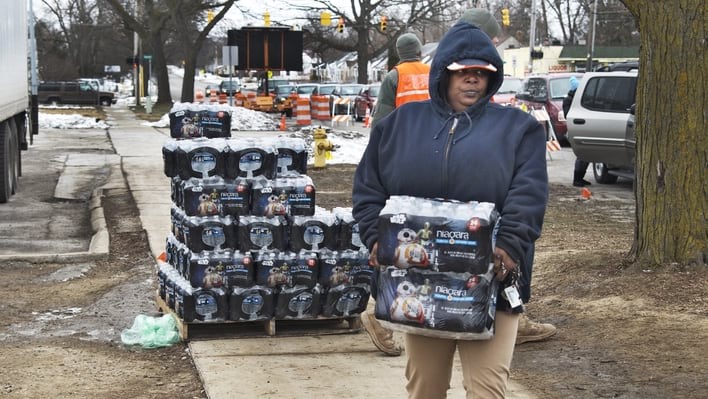
For decades, the NAACP’s organizers and members have used maps to visualize the landscape and pinpoint hotspots where injustice is happening. Maps supported legal action aimed at protecting voting rights in Georgia and Florida in recent elections. Maps helped tell the story of how government disinvestment left residents with contaminated water in Flint, Michigan, and Jackson, Mississippi—documenting the geographic reach of negative health outcomes and loss of life due to irresponsible policies.
When residents in Flint turned on their taps and received water from a contaminated river in 2014, they complained about the discoloration and stench, and reported related health problems. Tragically, consumption of water from the Flint River has been linked to a 12 percent drop in fertility rates and a 58 percent increase in fetal deaths in affected neighborhoods, according to a report from the National Partnership for Women & Families.
Providing the geographic context to turn such lived experiences into actionable information has become a compelling part of the NAACP’s work. Maps and geospatial data quantify the scope of discrimination’s damage in specific locations. Linking personal experiences to those locations on a map can reveal patterns and trends across time and space.
“We know that the oral tradition and the narrative tradition matter in communities of color,” Rushing said. “How do you add layers to amplify and connect the dots both in terms of visuals and data? How do you show the story of a family in Jackson dealing with a water crisis and connect it to a family in Baltimore who is dealing with the different type of water crisis—ecoli in the water—and to a family in Flint? How do we connect this to civic engagement? How do we link this to supportive policies and institutions?”
NAACP leaders look to infuse more data and data science into the organization’s research and programs to bring stories of injustice to light more accurately and authoritatively. They also see storytelling with maps as a powerful means of shifting policies and countering deficit narratives—those that place Black people as caricatures or victims instead of presenting a complete history that includes accomplishments and a true representation of the diversity within African American communities.
“With maps and the ability to aggregate lived experiences, the stories themselves become the thing that shapes public policy, and the public policy becomes the narrative of the people,” Rushing said.
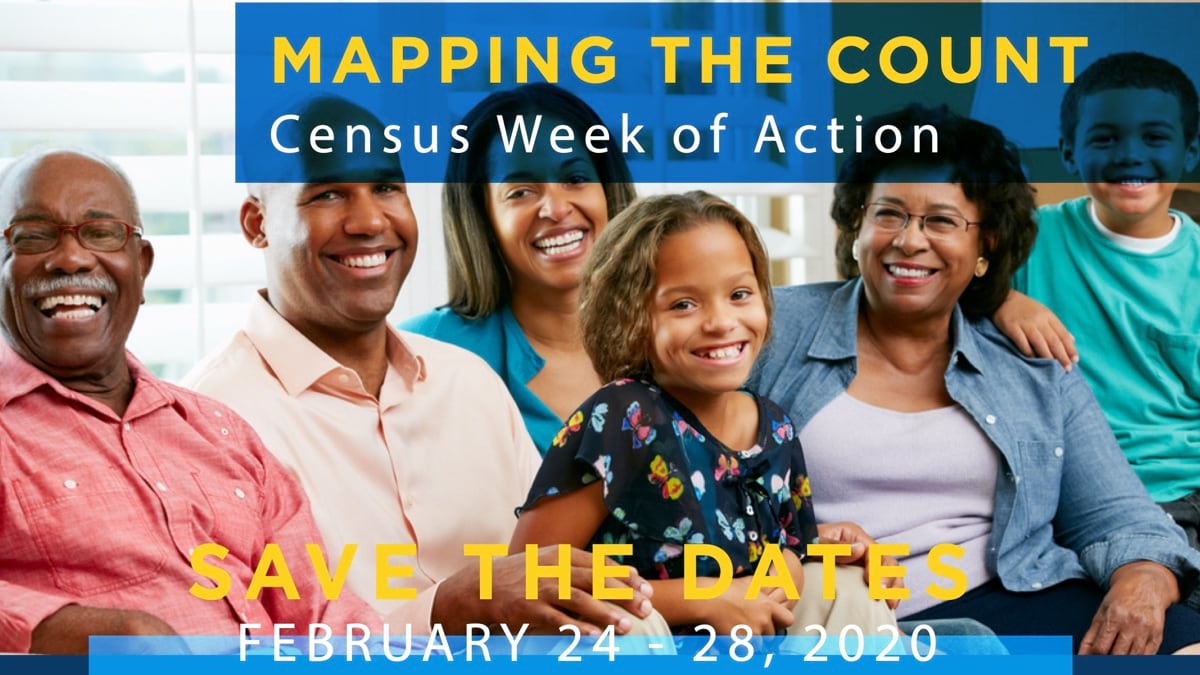
NAACP has begun modernizing with GIS technology’s visually engaging maps, web applications, data analysis tools, dashboards, and digital surveys. These tools give the organization a knowledge-generating, location-aware infrastructure for fine-tuning its business operations and racial justice work. Evolving piece by piece, NAACP’s Mapping the Movement strategy will be implemented across four focus areas:
Leaders at the NAACP believe the organization’s long, well-documented history of successful civil rights activism makes it an especially important partner in the digital age. They see digital maps and data science as the right tools for more effective engagement for justice, equity, corporate responsibility, and climate action.
By continuing to enrich its racial justice work through data science, the NAACP’s leaders can offer more authoritative insights to partners and stakeholders. The process begins with using maps to show where people are experiencing unbalanced conditions such as limited access to a quality education and unequal access to opportunities for home or land ownership. With a map-based frame of reference, the NAACP can help partners and policy makers evaluate locations to better understand how to invest in ways that address past disparities while improving or contributing to racial equity.
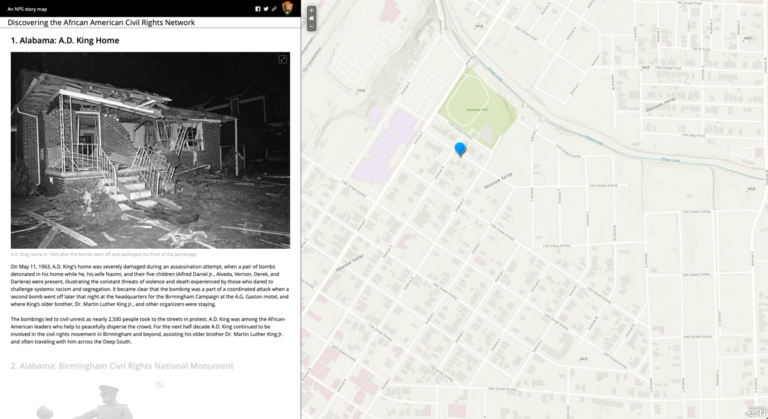
Learn how GIS helps us map and better understand racial inequity and you can learn more about the history in this story about Mapping Race in America. Below, the National Park Service created a story that details the many historic places of the African American Civil Rights Network. In honor of the Birthday of Martin Luther King, Jr., national parks waive entrance fees for everyone on Monday, Jan. 16, 2023.