
March 28, 2023 |
April 18, 2023
All the water on Earth is in a constant state of circulation. It flows across the surface and underground, churns through the ocean, evaporates into mist, and falls as rain. Scientists call this the water cycle.
Climate change affects all aspects of the global water cycle. The implications are vast, with repercussions for everything from drinking water availability to extreme weather events.
Adapting to these changes begins with understanding them. Until now, scientists have lacked the ability to study the cycle in its totality.
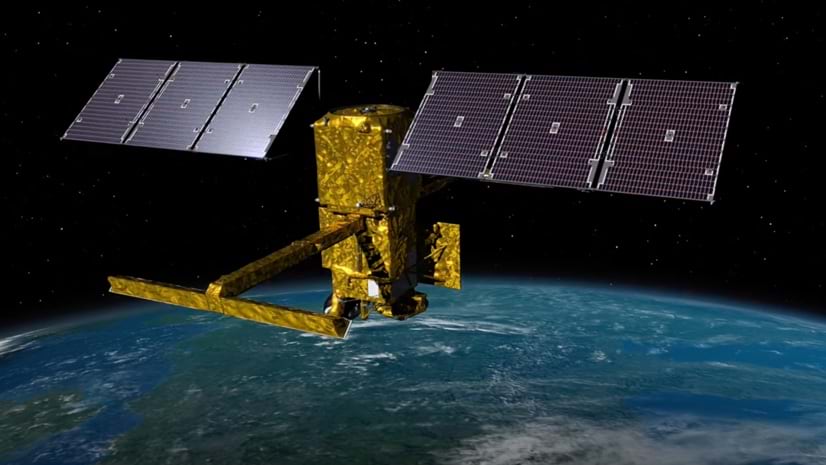
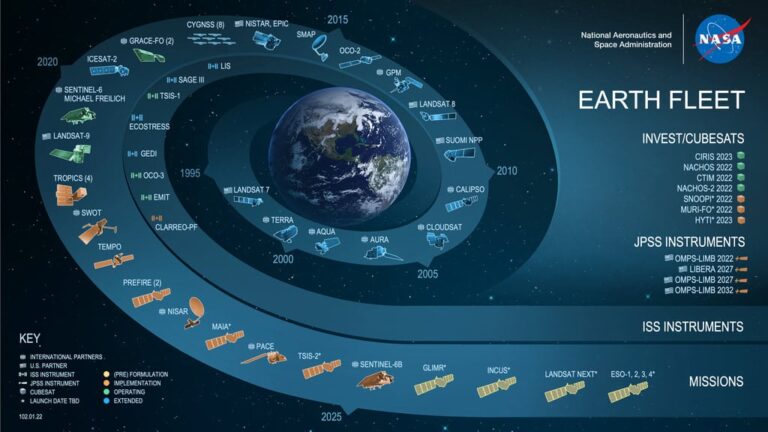
The National Aeronautics and Space Administration (NASA) has launched a historic mission to track the cycle from space. The Surface Water and Ocean Topography (SWOT) satellite, launched in December 2022, surveys nearly every water body on the planet—oceans, lakes, rivers, reservoirs—at least once every 21 days.
By gaining a holistic view of global water, scientists will get a better sense of how the cycle is changing. This will help them better forecast floods, droughts, and sea level rise.
The ocean and some of the world’s biggest river systems remain a mystery, but SWOT will empower researchers to monitor, view, and explore these mysteries in three dimensions and across space and time.
Nadya Vinogradova Shiffer, director of NASA’s Ocean Physics program, summarized the mission: “All water on planet Earth, enter SWOT.”
The satellite gathers data by bouncing a radar signal off bodies of water. The rebounding signal reveals several qualities, including volume, depth, and movement. “The next challenge,” said Tamlin Pavelsky, SWOT’s hydrology science team lead, “will be putting all those measurements together in a coherent way.”
To do so, scientists will use geographic information system (GIS) software. By projecting the raw numeric datasets onto maps, GIS provides a way to visualize water measurements as map layers. At NASA’s Jet Propulsion Laboratory (JPL) in Southern California, teams are curating and translating data so researchers can produce analysis and simulations via programs such as ArcGIS Pro.
Over time, as data accumulates, the outputs of SWOT will reveal the water cycle like never before. Scientists will use GIS to collaborate, catalog, and share these insights through web services.
GIS will also allow researchers to create layers from non-SWOT datasets. They could, for instance, import human settlement data and see how it compares to groundwater changes, to determine which areas will lack sufficient access to water. Or they might compare crop yields to the effects of a large dam project.
JPL plans to release the first SWOT datasets by the end of the year. For now, researchers can experiment with sample data, as well as some of the foundational data that will support the map layers.
With SWOT’s first-ever global water cycle capture, researchers will be able to focus on their specific areas of expertise while using GIS to perceive how those areas fit into the whole cycle. Since much of the research will look at temporal changes in the cycle, maps can depict the passage of time in a manner that charts and graphs cannot.
As a hydrologist, Pavelsky marvels at what the data will reveal: “SWOT will usher in a new golden age for the science of rivers and lakes.”
SWOT is a revolutionary achievement, but it connects with the early days of water mapping.
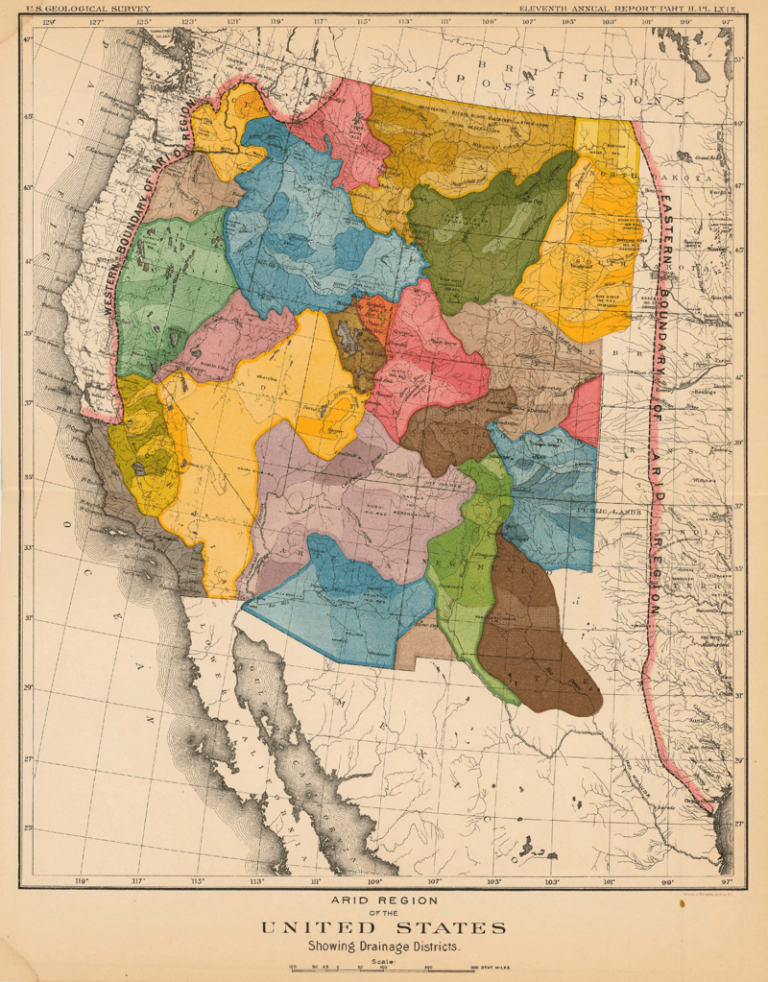
Pavelsky traces the roots of SWOT back to the pioneering work of John Wesley Powell, the second director of the US Geological Survey (USGS), and his obsession with the question of how much water would be available in the rapidly populating West.
More than 130 years ago, Powell oversaw the development of sensors housed in structures called streamgages that were placed in the Rio Grande to measure the volume of water flow. USGS set up thousands of stream gages in waterways across the country. But by the end of the 20th century, hydrologic scientists and engineers needed more than these analog sensor networks. The questions hydrologists were asking were too complex for the limited number of sensors available to answer them.
Remote sensing via satellite helps augment the readings from terrestrial sensors, and each works to calibrate the other. With SWOT, a whole new global water sensing picture was born. One can imagine that Powell would be excited by the new awareness. Researchers at the USGS John Wesley Powell Center for Analysis and Synthesis will be among those using the data to improve Earth system science.
Perhaps more than any part of the world, our knowledge of oceans has increased during the 21st century. GIS and maps have had a major influence on these developments.
Oceanographers are particularly excited about what SWOT can tell them about sub-mesoscale eddies, small swirling currents that spin off from major ones. Research suggests they are responsible for transporting downward much of the heat and carbon that the oceans trap, which has bought us time to mitigate carbon emissions.
“SWOT will provide the first 2D observations of the eddies’ stretching and straining,” said Rosemary Morrow, a SWOT oceanography team lead. “For me, this is one of the most exciting aims of SWOT.”
GIS has played an important role in unlocking new ocean understanding. The 3D mapped ecosystems of the ocean known as ecological marine units have been particularly instrumental. They enable a look through the water column at temperature, salinity, dissolved oxygen, nitrate, phosphate, and silicate. The data is used for such things as climate impact studies, prioritizing areas of the ocean to conserve, and marine spatial planning.
With SWOT’s high-definition view of the world’s water bodies, it will generate a much more complete picture of Earth’s water cycle.
David Sandwell, a geophysicist and SWOT project investigator, predicts that SWOT will help scientists model the ocean with unprecedented clarity. “The deep ocean,” he said, “remains the last uncharted frontier of the inner solar system.”
Learn more about the hydrology capabilities and questions hydrologists address with GIS.
March 28, 2023 |

July 19, 2022 | Multiple Authors |

April 22, 2022 |