We’re not creating the map as an academic exercise. This is about providing a prompt for community conversations and changing the grand narrative.
Kirsten Delegard
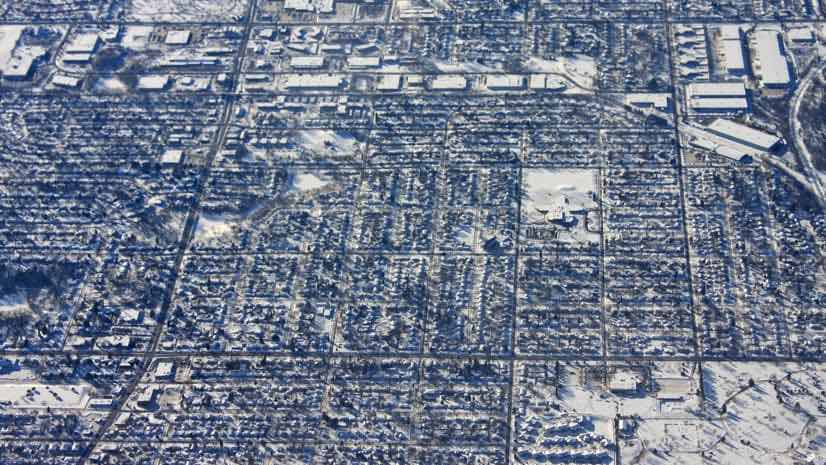
Minneapolis has a progressive reputation, wonderful parks, a thriving arts scene, great schools, a relatively low cost of living, good opportunities for millennials just starting work, but it also has a longstanding racial divide that is being freshly illuminated by modern mapping technology.
Rising racial tensions touched off by the shooting death of Philando Castile in a city suburb in the Summer of 2016 inspired many to ask about the underlying causes of increasing poverty in black communities.
“There’s a lot here that nobody is talking about,” said Kirsten Delegard, director, Historyapolis Project and scholar-in-residence in the history department at Augsburg University. “I was interested in digging beneath the surface and looking at the past to understand why we have some of the highest racial disparities in the country.”
Walls with Deeds
Delegard’s desire to bring historical truth to light spurred the genesis of the Historyapolis Project, which chronicles the city’s past. The project often turns to maps to help tell these stories. The story about the city’s racial segregation was so intriguing that it warranted a spin-off project.
Mapping Prejudice began with discussions with members of the Jewish community who spoke of areas in the city that had been off limits to Jews. This revelation compelled the team to research historical records and property deeds to uncover any covenants containing language that specifically rejected Jews.
“In 1946, Minneapolis was named the anti-Semitism capital of the United States by journalist Carey McWilliams [in an article for Common Ground],” Delegard said. “So, I expected to find that Jews were excluded from many neighborhoods through these codicils and property deeds.”
Restrictive racial language in property deeds was a common practice throughout the US. It ties to English land law and the ruling that a restrictive covenant can ‘run with the land,’ making all future owners subject to restrictions that prior owners conceived. In Minneapolis, developers typically placed these covenants. They used the fears and prejudices of the time as a marketing tool to sell new developments. This practice is referred to as redlining, and the institutional practice has been found in hundreds of US cities where a federal agency, the Home Owner’s Loan Corporation created residential security maps and banks and real estate firms perpetuated the practice for decades.
The practice began in the early 1900s, and had been allowed by the US Supreme Court. However, in 1948, the landmark case of Shelley v. Kraemer ruled that courts could not enforce racial covenants on real estate. This did little to restrict the practice as the famous Levittown on Long Island that became the model for many similar developments was infamously all white. It wasn’t until the Fair Housing Act (1968) that such discriminatory housing practices were stopped, making it “. . . unlawful to refuse to sell, rent to, or negotiate with any person because of that person’s inclusion in a protected class.”
The initial search for deeds in the locations recounted as “No Jews Allowed” failed to turn up specific restrictions. However, researchers uncovered deeds that contained other disturbing racially-motivated language.
“The language included words like Japanese, negro, Mongolian, colored,” Delegard said. “We found quite a few covenants that specified that the property could only be transferred to those of the Caucasian race and Aryan branch.”

Digging up Documents
Revealing all of the racially restrictive covenants in Minneapolis was the next logical goal, but navigating the physical documents in the Hennepin County Recorder’s Office quickly led to frustrations.
“It takes a tremendous amount of skill to excavate these records,” Delegard said. “Within a few hours we were literally weeping with frustration.”
Penny Petersen, a property researcher and historian, helped guide the Historyapolis team’s initial foray into the County’s archives. After Petersen retired, she took up the task to dig further into real estate records and, in a matter of months, uncovered 1,500 deeds with racial restrictions.
Delegard called this discovery “mind blowing,” because the only other effort of its kind, in Seattle, had achieved the prior high mark of 400 racially restrictive deeds.
Mapping Prejudice quickly snowballed when Delegard recruited Kevin Ehrman-Solberg, who had previously interned with the Historyapolis Project, to make the data mappable using a geographic information system (GIS).
“GIS has the capacity to convey a remarkably complex set of information in a visual way that’s immediately understandable to anyone,” Ehrman-Solberg said.
Rather than stop at the 1,500 records that Petersen found, Ehrman-Solberg started thinking about the larger trove of information that was available in Hennepin County’s recently digitized records.
“People had talked about these deeds as individual documents, and sometimes as legal categories, but nobody has ever gathered all this data together and put it on a map,” Delegard said.
We’re not creating the map as an academic exercise. This is about providing a prompt for community conversations and changing the grand narrative.
Going Cityscale
Hennepin County provided 1.4 million scanned warranty deeds from the period of 1900 to 1960. Having the deeds in digital form meant the team could bypass piles of paper, and introduce automation.
“I wrote some scripts that could push the records through the Google Tesseract Optical Character Recognition (OCR) engine, which scanned the documents for racial terms,” Ehrman-Solberg said.
The OCR Engine churned through all the deeds, and returned 25,000 suspect deeds. Looking at sample sets, the OCR had an 80 percent accuracy due to anomalies. For instance, while looking for language like, ‘Property can only be conveyed, mortgaged or sold to a member of the white race,’ the OCR engine also turned up records of Richard White buying a house in South Minneapolis. This reinforced the need to view, verify, and extract information from each deed.
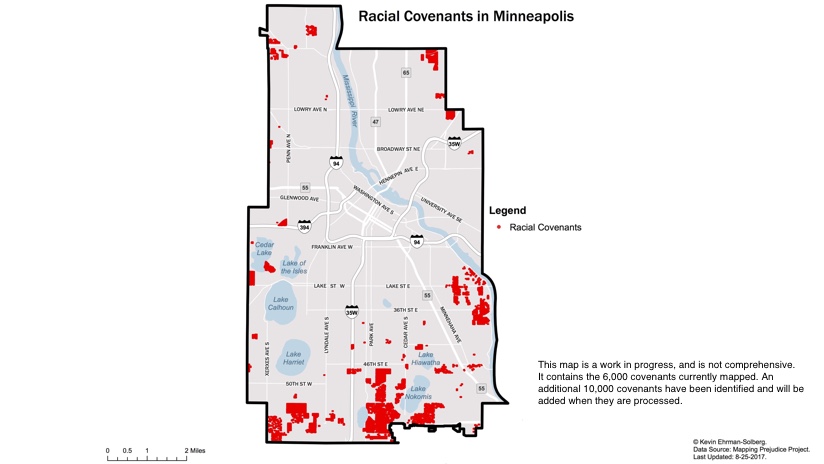
Again, thinking about scaling their efforts, the project leveraged the online crowdsourcing platform Zooniverse so that individual deeds could be verified by volunteers. To date, 450 volunteers have validated more than 2,500 deeds. These deeds have been mapped alongside those that Petersen uncovered, and a compelling map of 6,000 deeds shows where entire neighborhoods were walled off for whites only.
The level of detail, the unprecedented city-scale data, and the visualization of change over time tells a compelling story of calculated racial divisions.
“You cannot look at the generalized map without gasping,” Delegard said. “It has an incredible visceral and visual impact.”
Examining the past
While searching for a cause of the covenants, the Great Migration in the first half of the 20th Century with its huge influx of African Americans from the rural South was seen as the source. However, records show that in 1910, there were 2,778 African Americans in Minneapolis and by 1940 that number grew to just 4,309. The influx that profoundly impacted Chicago and other cities had minimal impact on the number of African Americans in Minneapolis.
The pattern of segregation over time is deeply unsettling. The map shows that in 1910, very little segregation existed in the city, with the highest concentration of African Americans in a single census district at 12.5 percent. By 1940, that distribution had changed dramatically, with some census districts reporting as much as 50 percent African American residents.
Today, the areas that were once covenanted remain largely white and they are some of the richest parts of the city. Conversely, the areas that were engineered to be largely African American in 1940, are still that way today and remain some of the poorest parts of the city.
Racial inequality cannot be separated from segregation, nor can police brutality, as the incidents invoked in the Black Lives Matter movement have occurred in some of the most segregated areas of the country.
“Covenants created the structural underpinning that allowed, enabled, and promoted subsequent measures of inequality, segregation, and exploitation,” Ehrman-Solberg said.
Raising Dialogue
Because many Minneapolis citizens are unaware of the history of systematic racism in the city’s housing and community formation, few see the patterns or have challenged the city to change.
“We’re not creating the map as an academic exercise,” Delegard said. “This is about providing a prompt for community conversations and changing the grand narrative.”
The aim is to bring people together to think about the geography of their city, and to learn more about one another’s sense of place.
While the map is the primary output of the project, community engagement is seen as the key driver for change. The project team regularly presents the map and information to community groups, and recruits volunteers to help build the map by reading and verifying the documents.
“The goal is to change the way that Minneapolitans view race and space and the history of both in the city of Minneapolis,” Ehrman-Solberg said. “Having them do the work to shift that narrative has proven to be powerful.”
Learn how Esri helps nonprofits with tools for social innovation. Learn how smart mapping makes mapping easier and more impactful.