
April 13, 2023 |
Matt Ball |
Two sea star fossils found a thousand miles apart sit in glass cases in the same exhibit hall. One came from Minnesota, while the other came from West Virginia. Neither state holds an ocean today, but viewing the change on a map reveals how the American continent has evolved.
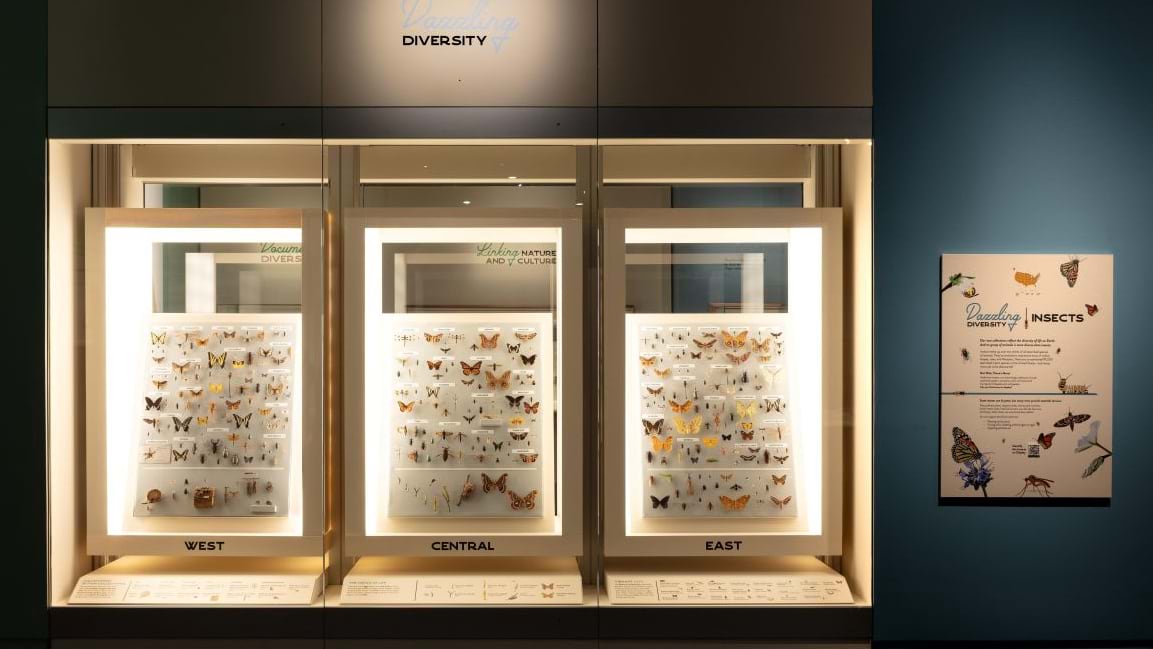
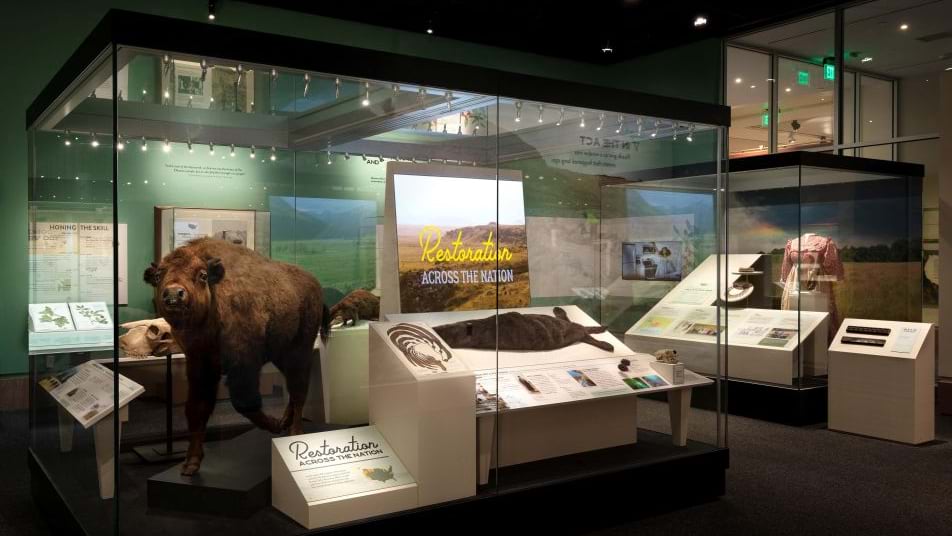
That pairing lives inside From These Lands: Sharing Our Natural and Cultural Heritage, on view at the Smithsonian’s National Museum of Natural History in Washington, DC, through December 2029. Built to mark the nation’s 250th birthday, the exhibit draws more than 600 specimens and cultural objects from all 50 states, the District of Columbia, and five inhabited US territories: Puerto Rico, the US Virgin Islands, Guam, the Northern Mariana Islands, and American Samoa.
Stewart Edie, a research geologist and co-curator of the exhibit, chose the fossils because they compress a large idea into two small objects. The ground under a state does not stay fixed. “It suddenly clicks,” Edie said. A paleogeographic map, rolled back far enough, shows how a shallow sea once split the middle of what’s now the US. The map reveals the linkages between states that today share no coastline but once did.

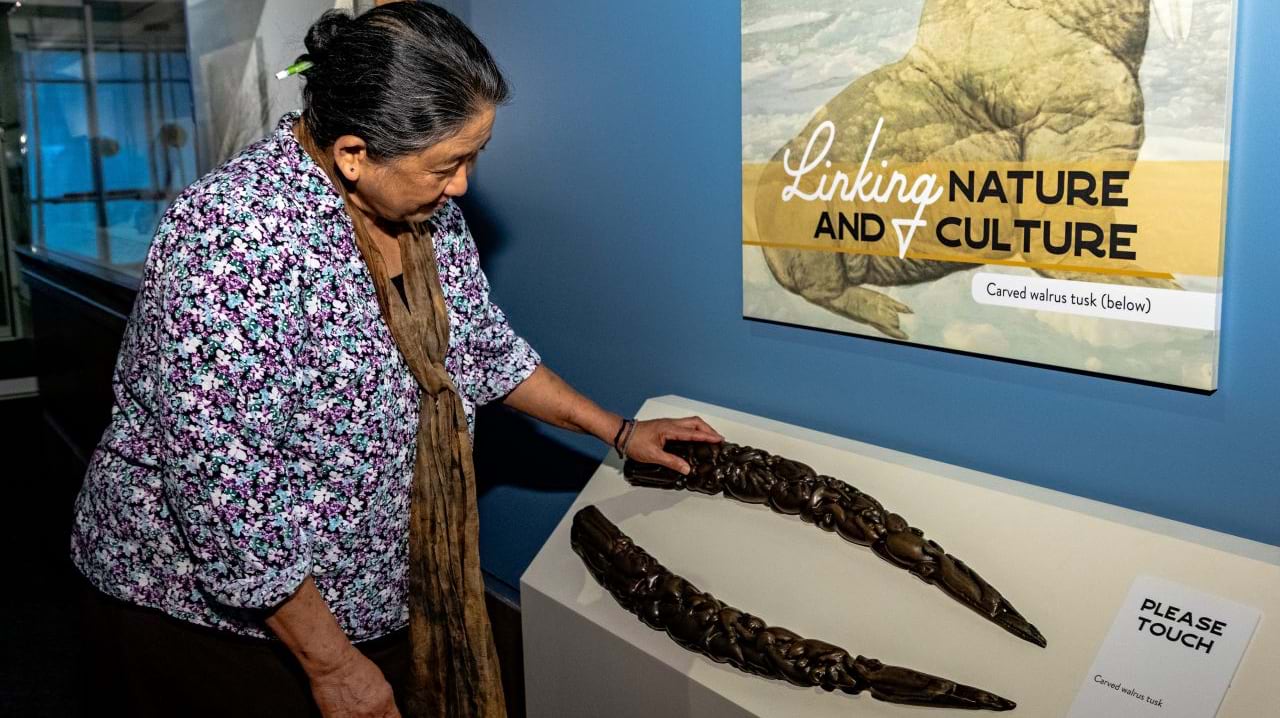
A carved walrus tusk near one entrance carries the same idea into cultural history. The tusk records the relationship between people and the land they depend on, a practice Edie called “deeply intertwined in the identities” of the communities who made it. A video beside the tusk shows how the carving came to be. Elsewhere, Samoan siapo textiles, made from stripped tree fiber, tell a version of the same story. Objects that record the people of the place, and its history.
The exhibit could have marched alphabetically from Alabama to Wyoming, with one case per state. The exhibit team ruled that out early. A state-by-state grouping would only tell what exists in each place and not how the places shape and knit together people, place, and history.
Geography solved that problem. Kirk Johnson, director of the museum, describes it as the exhibit’s organizing principle. “From These Lands brings the entire country into a single gallery, inviting visitors to imagine, for a moment, that there are no state lines,” he said. “The stories in the exhibit explore connections across regions, illustrating how America’s natural and cultural heritage is shared across the entire country.”
The Chesapeake Bay case shows how nature and culture connect through work and food. It ties Virginia oysters, Maryland blue crab, and Delmarva shad to the people who have worked those waters for thousands of years. “We wanted people to find the connections among states,” Edie said.
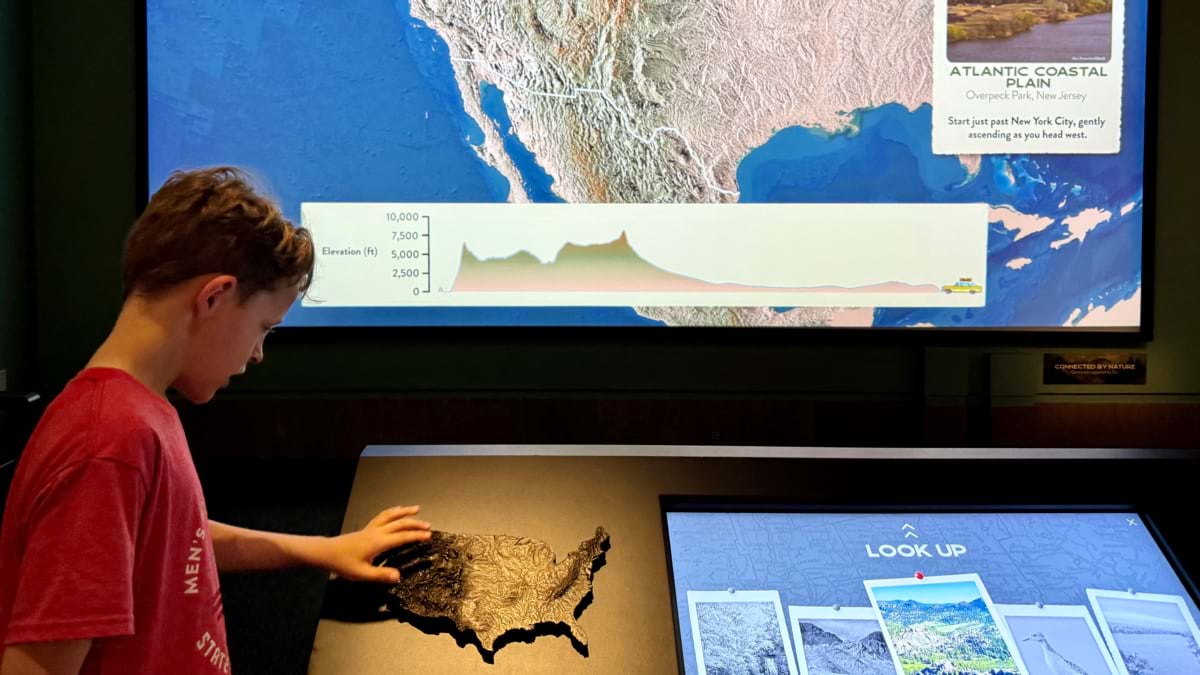
Jill Johnson, the exhibit developer, directed the creation of the interactive map at the center of the gallery around the same instinct. Start with a place a visitor already knows. Then show how that place connects to everything else. “The use of maps throughout From These Lands grounds visitors to where they are, familiar places they have lived in or visited, and widens their perspective to a much bigger landscape, from local to national to global,” she said.
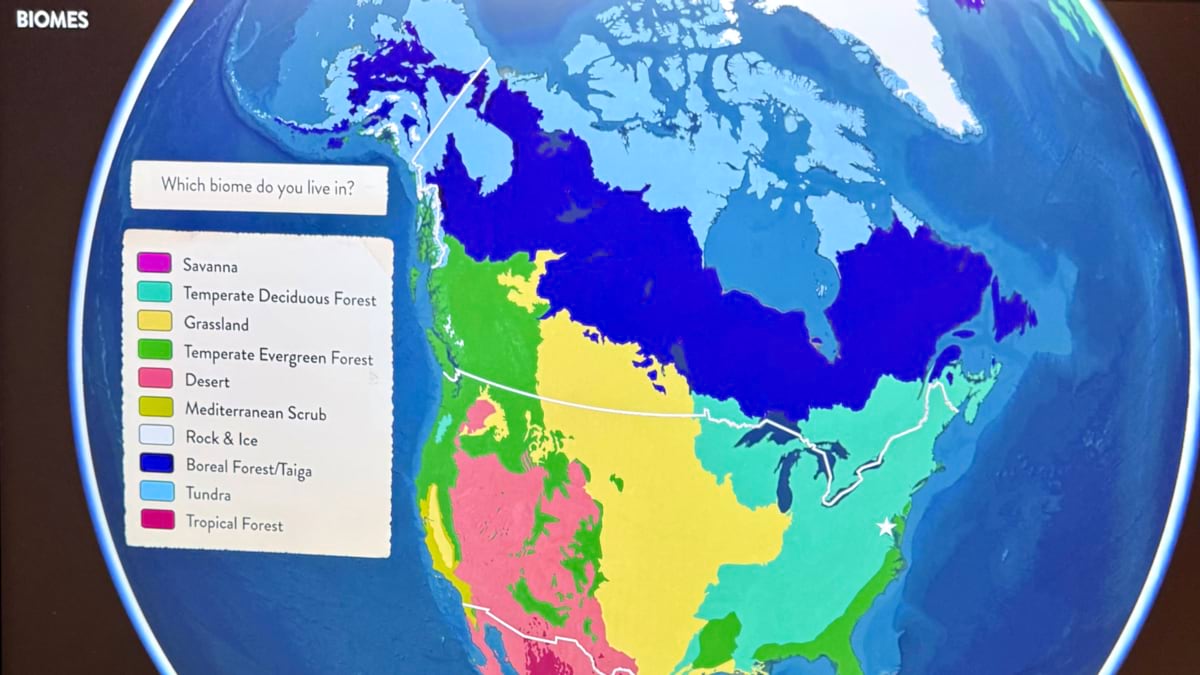
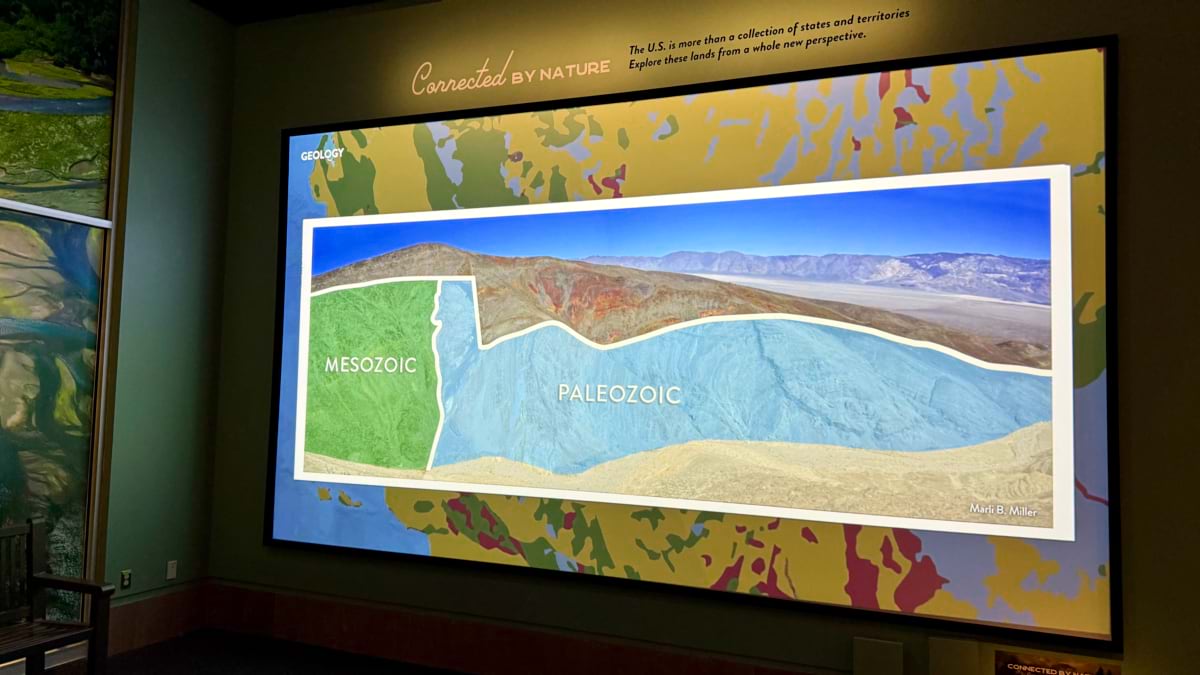
That perspective on our broad connections is featured on a screen measuring 16 by 9 feet. Built with Esri solution engineers, five geographic layers animate for 60 to 90 seconds each, displaying biomes, geologic age, bird migrations, topography, and watersheds. Each layer starts as a dataset too large to read on its own—thousands of individual bird-tracking records, or a geologic survey spanning four billion years. That data gets built into a single moving picture a visitor can take in at a glance.
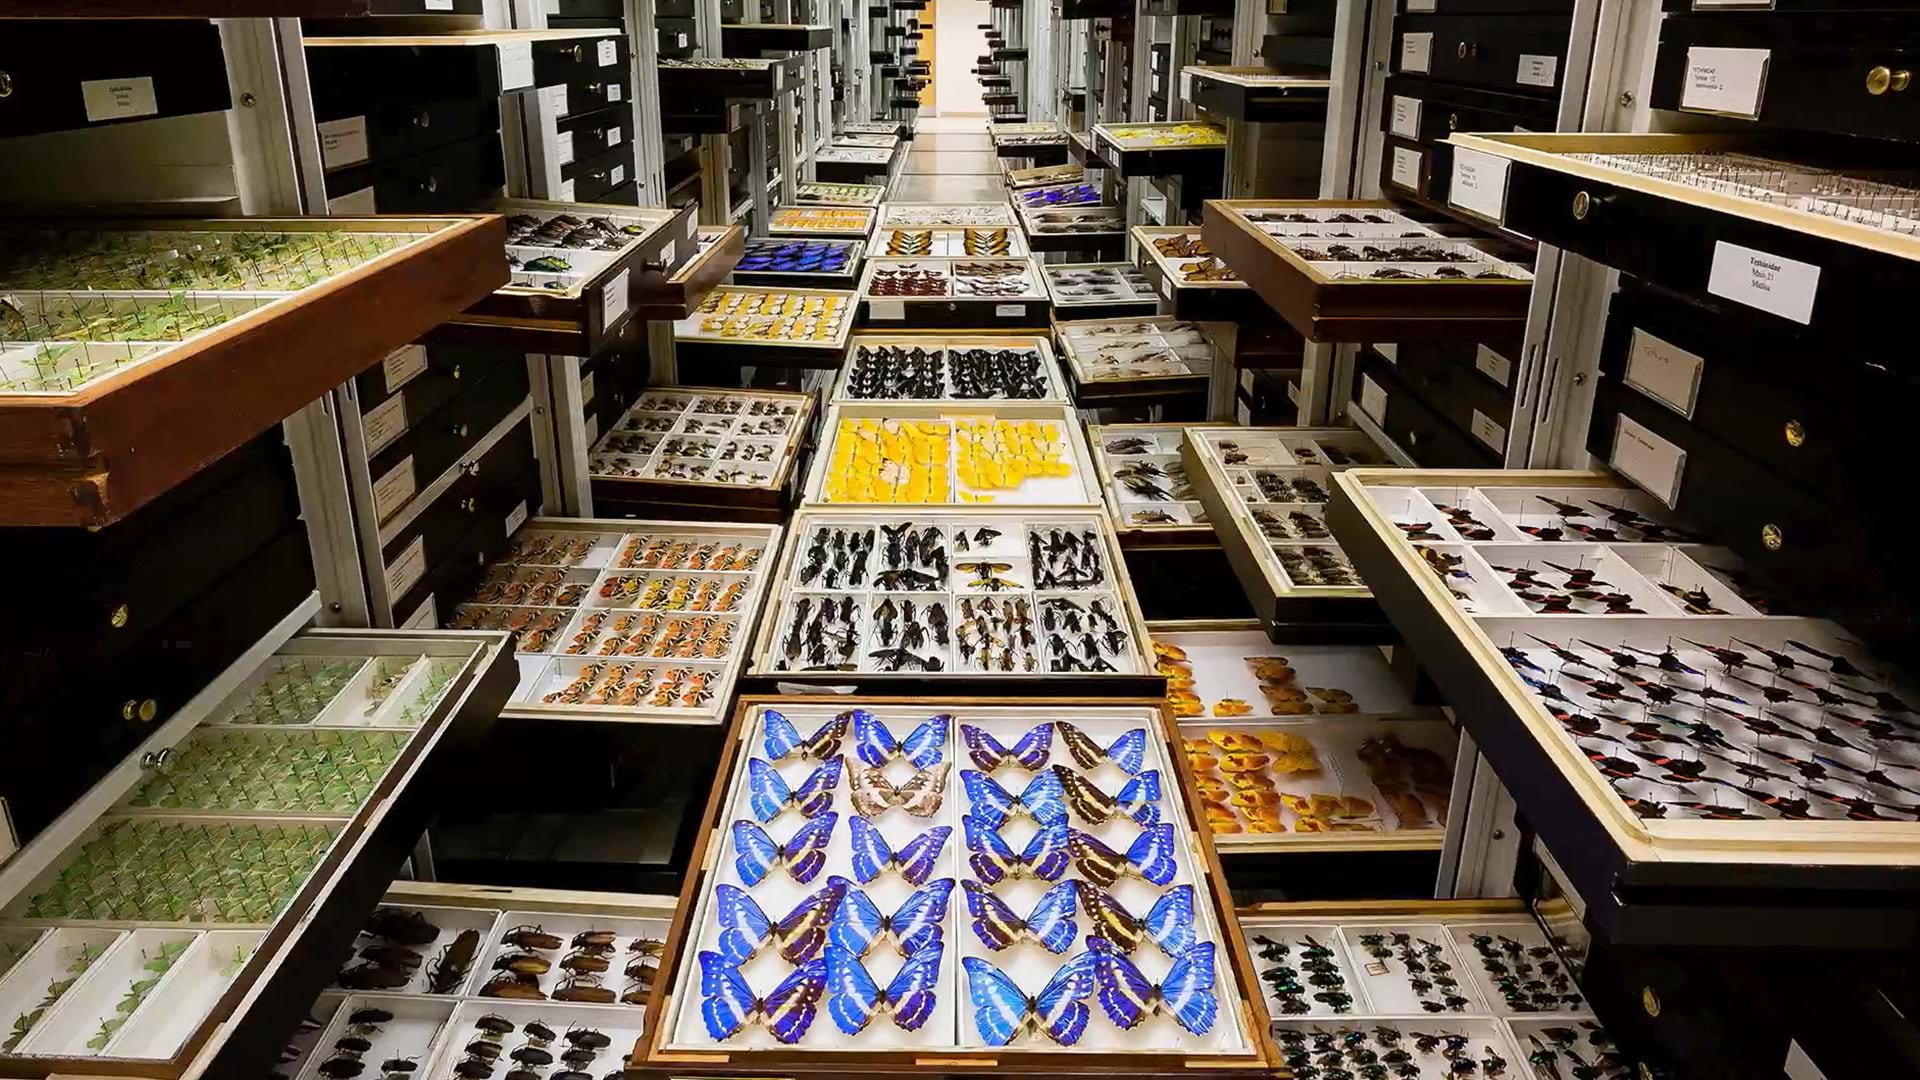
That’s what a geographic information system (GIS) does. It carries data in layers and compiles that complexity so it can be examined at any scale: the origin of a single mineral, a species’ migration route, or the changing geology of the whole planet. The same system that shows a bird crossing a hemisphere can, in principle, hold the location of every object in the museum’s collection, all 148 million of them, mapped to the place each one came from.
Biomes label the distinct ecological regions a person grew up in. Geologic age answers a question Edie considers hard to resist: How old are the rocks under your feet? The animation builds the Precambrian through the Cenozoic across the country, layer by layer. Bird migrations trace routes like the buff-breasted sandpiper’s run from South America through Texas to Alaska. Topography follows Interstate 80 coast to coast, over the Appalachians and down through the Rockies. Watersheds trace a creek in central New York to its outlet in the Chesapeake Bay, hundreds of miles south.
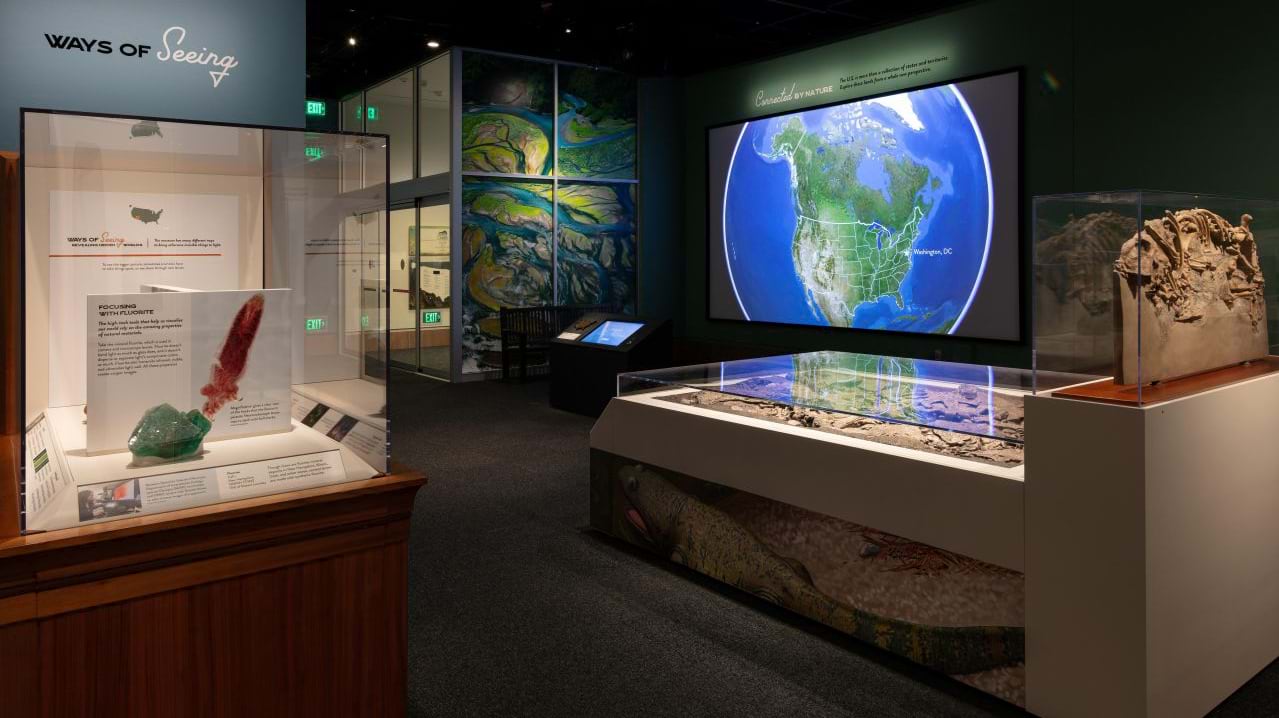
Although the map layers do not correspond directly to individual cases, they invite the same kind of connection-making that the exhibit encourages throughout the gallery. Visitors build those linkages themselves. People from West Virginia, possibly expecting a case about coal, instead find the state’s salamander diversity and its own ancient sea star fossil. People from Georgia, expecting peaches, find oysters. “That’s where it gets exciting,” Edie said, “because you can start to broaden what people consider to be natural history.”
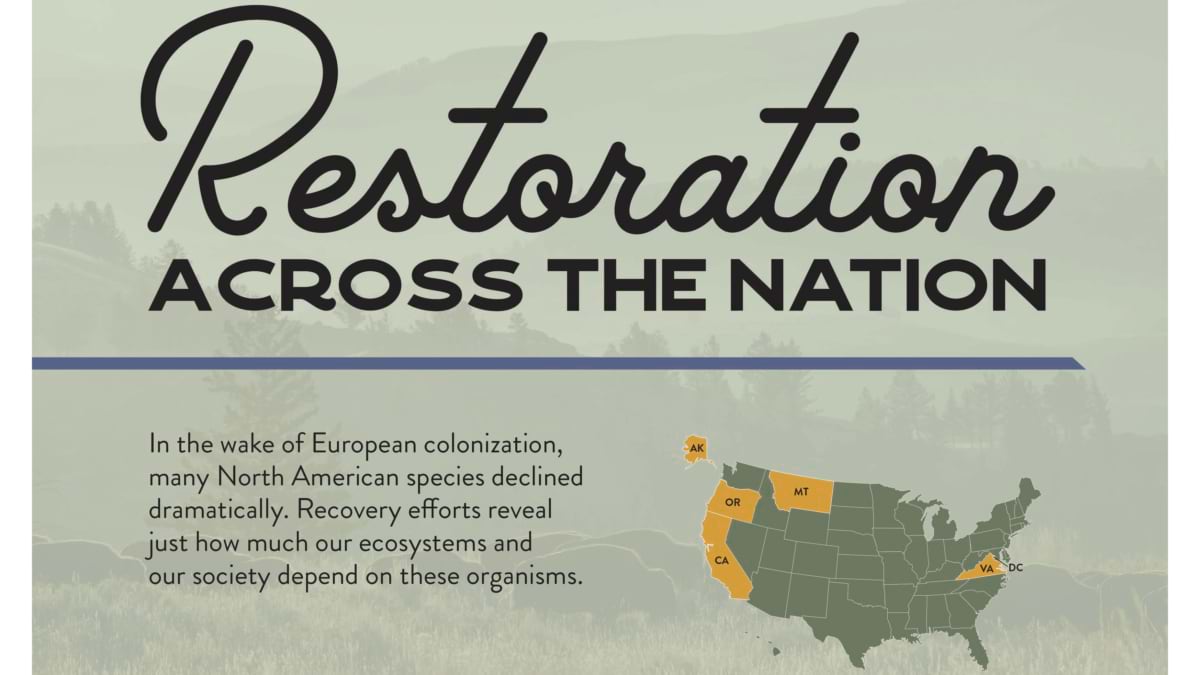
The museum’s collection is not simply a record of the past. It can also show how a place changes, and how it can be restored. Lichen specimens documented decades of environmental contamination from leaded gasoline, and then its decline after the fuel was banned. A DDT-thinned pelican eggshell sits beside a healthy one, physical evidence behind the science that ended the pesticide’s use and aided the brown pelican’s recovery. A fossil tooth that sat unexamined for years turned out to belong to an ancient hippo-like marine mammal, pushing the known origin of that group back tens of millions of years. “These kinds of discoveries are waiting to happen in the collections,” Edie said. “They aren’t static and gathering dust, they continue to generate new knowledge.”
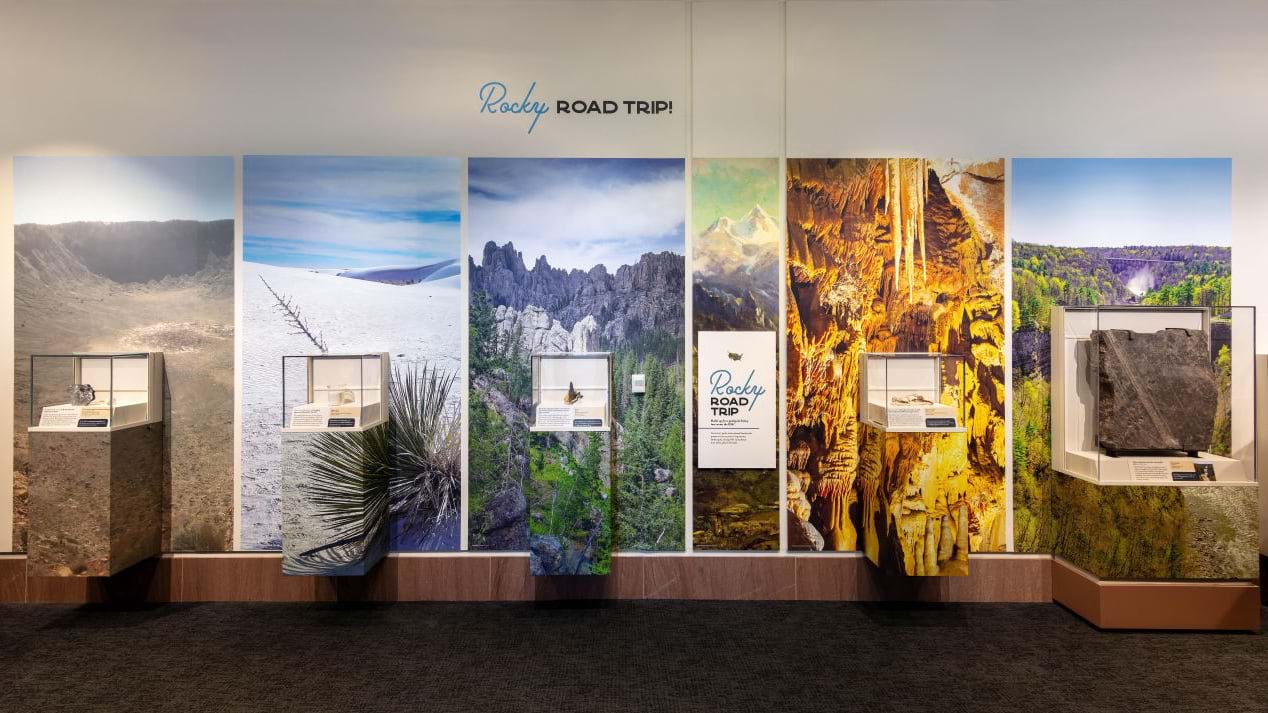
A visitor who walks the full length of the exhibit passes fossils, textiles, carved bone, and animated maps built from the same conviction: a place is never just a dot on a map. It carries millions of years underneath it and generations of people on top of it. Geography is what lets a museum say that in one room.
“I hope visitors walk away with a sense of wonder and connection,” Kirk Johnson said. “This exhibition shows that the story of the United States includes its landscapes, ecosystems, cultures and people interacting over time. I hope people see themselves represented in that story and leave with a deeper appreciation for how interconnected our natural and cultural heritage really is.”
If you’re unable to visit the exhibit in person, this digital story will help you experience the objects, narratives, and connections at the heart of the collection. Learn how GIS advances the power of geography.