May 12, 2026 |
Nick Short | Natural Resources
July 28, 2026
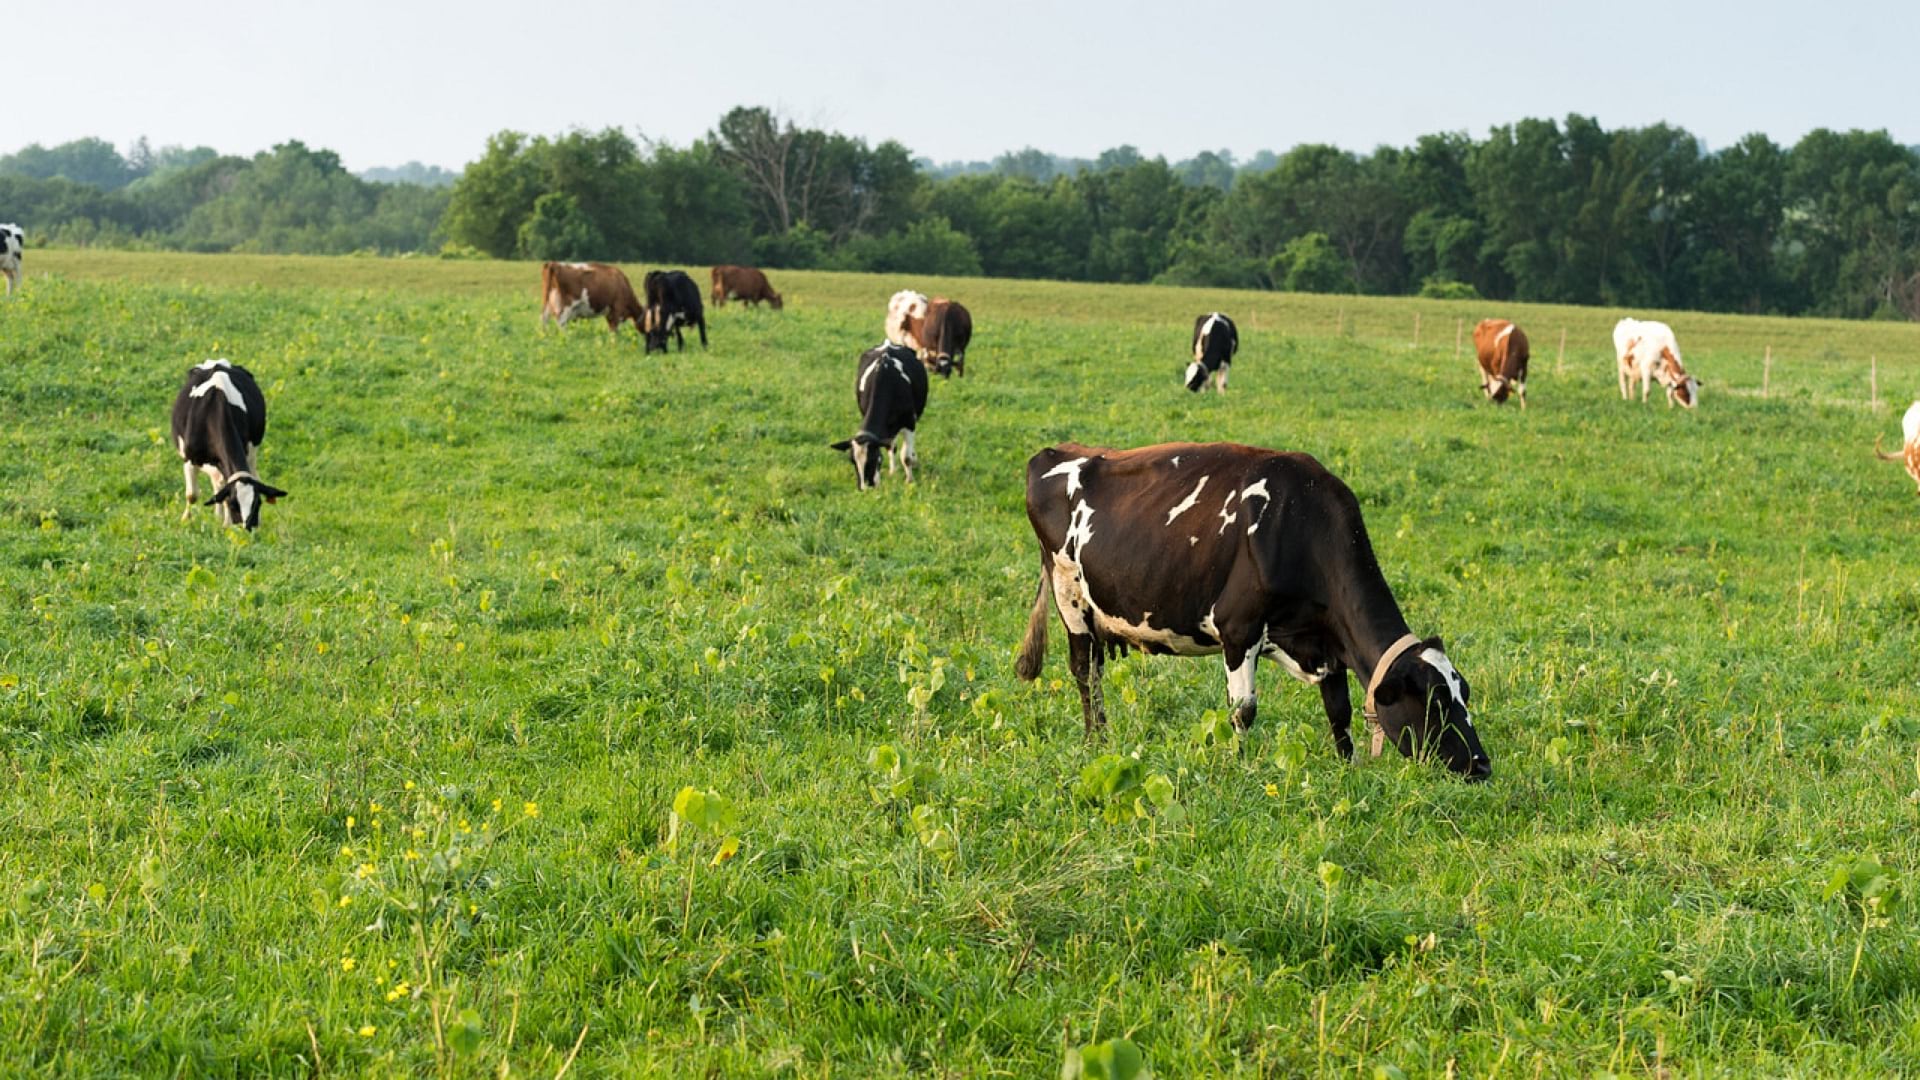
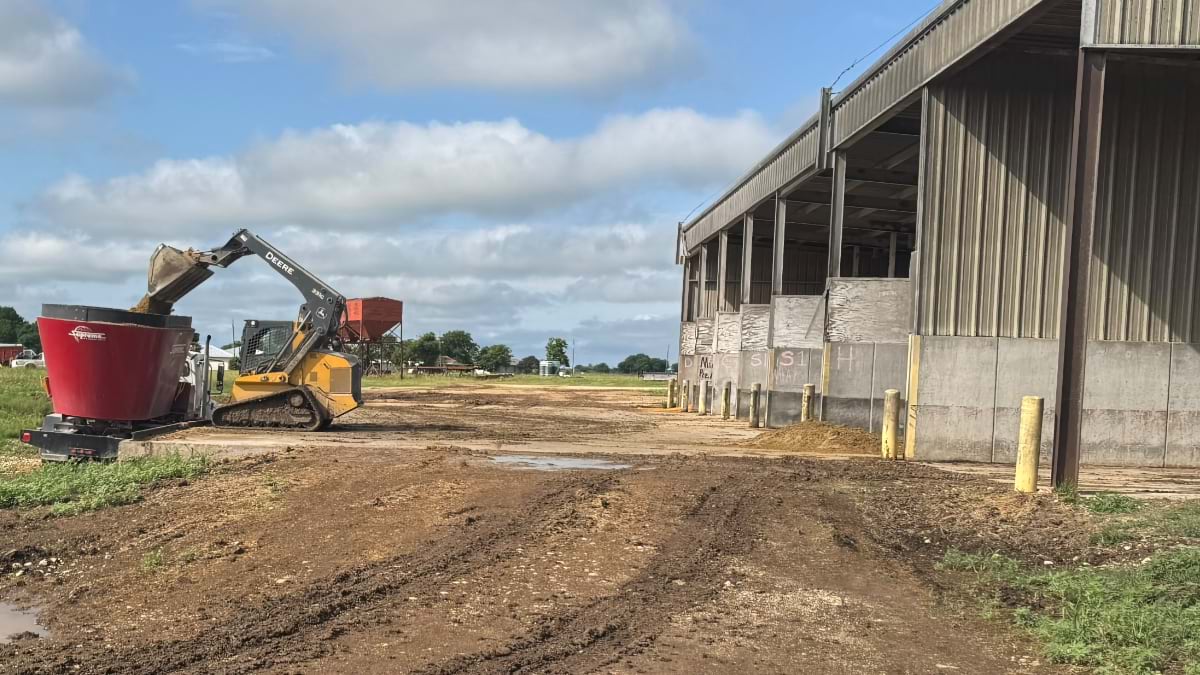
Texas A&M is building the ranch of the future in McGregor, Texas. The AgriTech Innovation Farm Hub opens 6,400 acres of working pasture, rangeland, farmland, and feedlot to companies testing cattle management technologies at commercial scale. The mission is practical: Improve outcomes for producers.
The stakes behind that mission are immediate. The national cattle herd has fallen to its smallest size since 1951. Beef prices have climbed to record highs as costs stack up across the supply chain—the animals, feed, transport, and processing. Producers need tools that improve efficiency now.
Dr. G. Cliff Lamb, director of Texas A&M AgriLife Research, makes the pitch to companies that are building tools for cattle producers in engineering environments. McGregor is where they test against real-world wind, dust, connectivity gaps, and 1,500-pound animals that don’t cooperate.
Stephen Cisneros, who leads business strategy for the AgriTech Innovation Hub, calls it providing the canvas. Scientists, developers, and entrepreneurs paint the picture of modern cattle ranching in partnership with the research center.
Dr. Ryon Walker runs the McGregor Research Center. Here he describes what it takes to manage a 6,400-acre ranch as a technology proving ground.
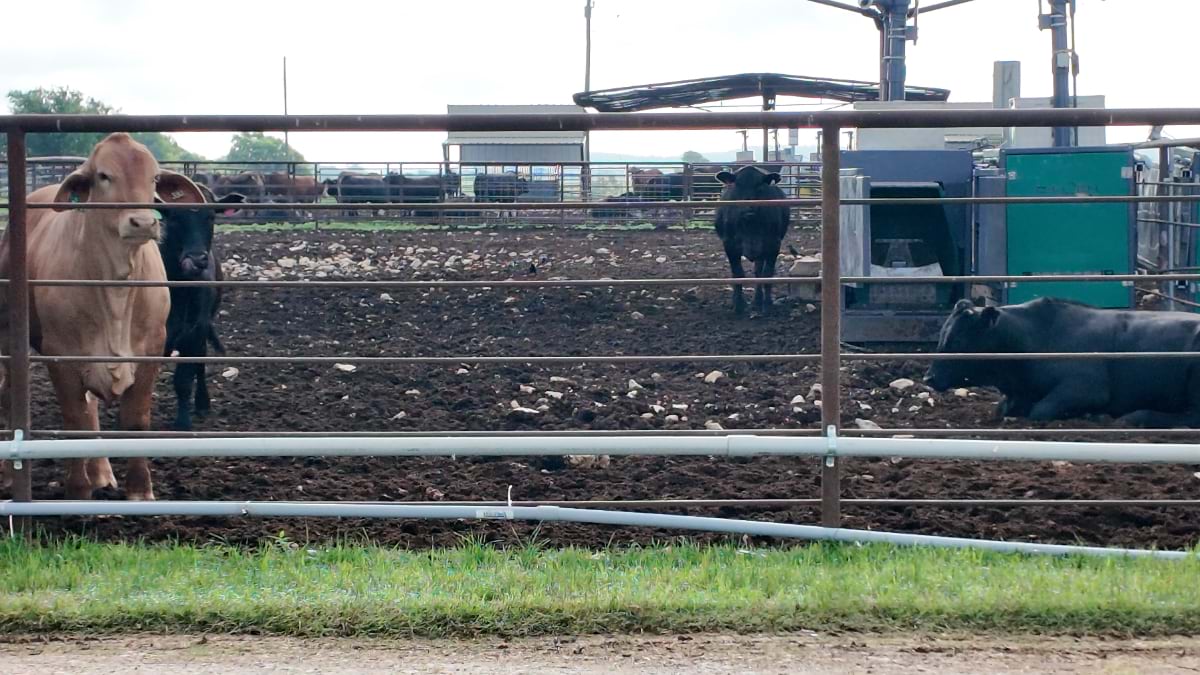
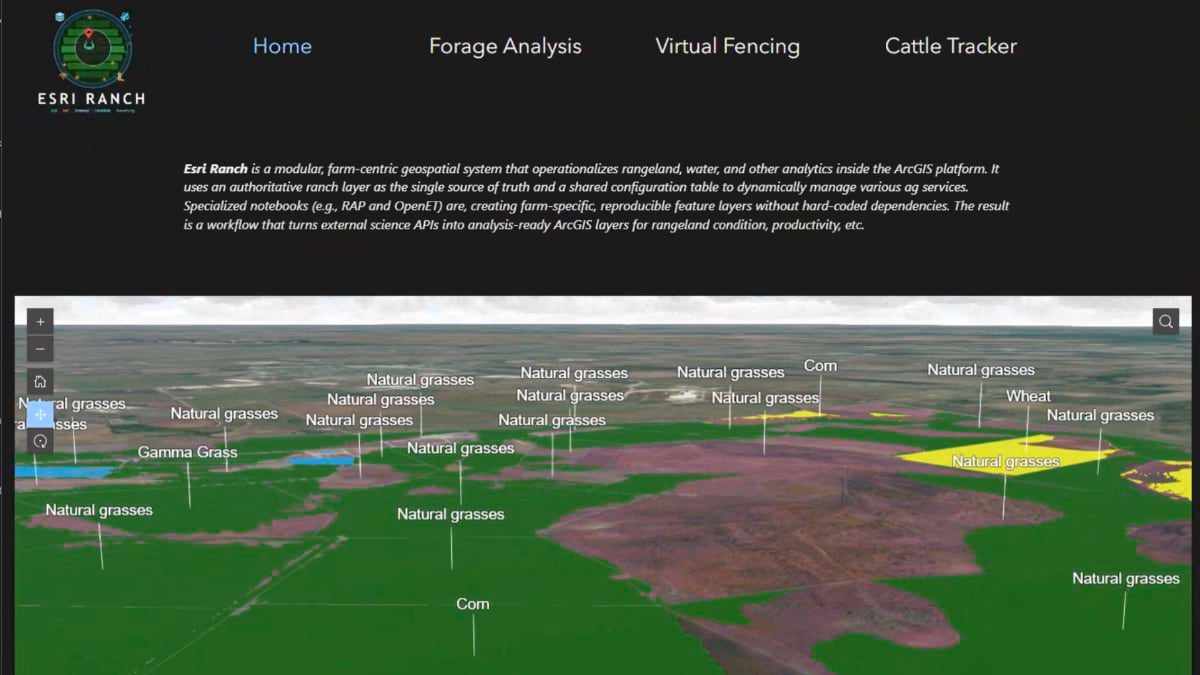
McGregor runs the full cattle cycle. Around 1,000 cows calve out every year. Bulls run with the cow herd through the breeding season. Some calves are sold. Others are brought into the feedlot and fed to market weight. Researchers monitor all aspects to gain knowledge and direct efficiency gains. Ninety percent of the feed comes from what McGregor grows. Ranch managers monitor pastures, water, feed inventory, and herd locations on maps and dashboards covering all 6,400 acres at once.
That commercial scale is the point. Researchers run test plots on one or two acres or on a limited number of livestock. A producer needs to know if a technology holds up at hundreds of acres and the whole herd. With McGregor’s thousands of acres and 1,000 cattle, they can show what will work at scale, giving producers tools to improve profit margins and grow their operations.
The AgriTech Innovation Hub formalizes that argument. A new facility is being designed with three components: a veterinary lab, a maker space where companies can secure proprietary work while running field trials, and the full infrastructure of a working cattle operation. Construction is expected to start in early 2027. Companies will bring technologies to prove out, while researchers bring questions that only scale can answer. The ranch generates more data with every cycle, feeding the development of digital tools ranchers can put to direct use.
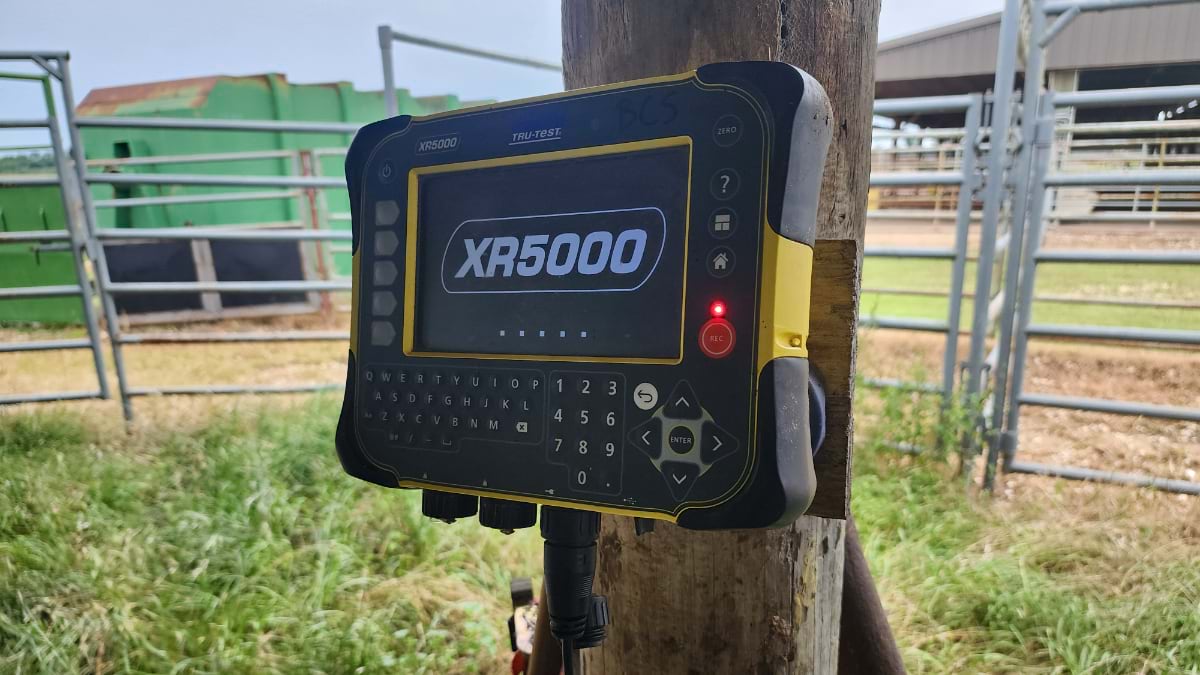
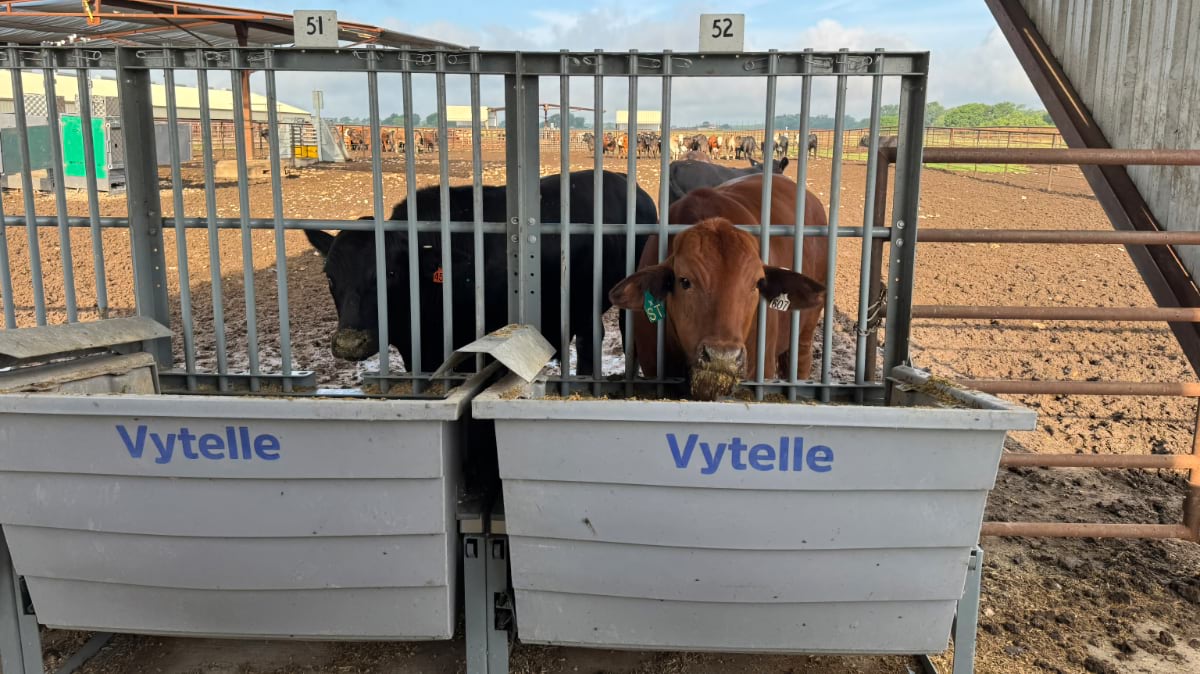
Individual feed bunks in the feedlot measure how much each animal eats every 24 hours, tracked by ear tag. Feed cost is the largest variable expense in cattle production. Knowing which animals convert feed most efficiently into weight gain allows producers to breed for that production efficiency trait. Weight, water consumption, and daily gain accumulate alongside feed data, giving researchers and managers ongoing data on performance across the herd. That data feeds the dashboards ranch managers use to make daily decisions and the models researchers use to answer questions at industry scale.
At the O.D. Butler, Jr. Animal Science Complex in College Station, Dr. Karun Kaniyamattam describes his work as a game of optimization. His field is computational epidemiology. He builds models spanning the whole system, from an individual animal’s feed conversion to a supply chain’s antibiotic load to a region’s greenhouse gas footprint.
He is a veterinarian by training who now teams biologists with data scientists. His veterinary students know the disease pathways, the nutrition science, and the animal behavior. His engineering collaborators know machine learning, data models, and visualization tools. The problems get designed by the people who understand the biology and the solutions get built by the people who can compute at scale.
The problems he works on are the same ones a rancher faces, enlarged to industry scale. Bovine respiratory disease, the leading cause of illness and death in feedlot cattle, costs the US beef supply chain between one and three billion dollars a year. More than 45 percent of feedlot deaths trace back to it. The antibiotics used to manage it run to 1,500 tons annually, about 42 percent of all antibiotics used in the United States. Kaniyamattam builds models that find where in the system interventions reduce disease without breaking the economics. If it costs the rancher more than it saves, it doesn’t get used.
The same logic applies at every scale above the individual animal. Breeding decisions that improve one ranch’s efficiency show up in the environmental footprint of the US beef industry. Feed data connects to genetics. Methane measurements connect to supply chain accountability. The same questions recur at every level—producer, commodity, environmental oversight, land management—across 500 million acres of grazed American rangeland. The larger ambition is to build the data infrastructure that answers them at every scale. McGregor is where that work begins.
Dr. Michael Buser sees McGregor as a node in something national. Here, he describes the data infrastructure that connects this ranch to research networks across the country.
The data layer being assembled at McGregor is designed to connect this ranch to USDA facilities, universities, and producers willing to share their own operational data. Standardized and open, it turns individual ranch measurements into a shared research resource.
The vision is a common framework—one map per ranch that captures what works locally. A shared data layer rolls those results up across breeds, geographies, and management practices, surfacing answers no single ranch could find alone.
The questions it helps answer are the ones producers have always had. Which breeds hold up in this heat? Which feed protocols cut cost without cutting gain? Which interventions break the disease cycle before it reaches the feedlot? Sensors, models, and ranchers in the field work the same problems at the same scale, with more information than any previous generation had access to.
The maps that sit above that data become powerful in proportion to what feeds them. A single ranch’s pasture layout and herd locations are useful. The same map layered with breed performance, methane measurements, water consumption, daily gain, and grazing patterns across dozens of research sites starts to reveal a holistic understanding of cattle grazing.
The only agricultural research operation larger than Texas A&M in the United States is the USDA. Texas A&M works with this federal agency on many of these fronts.
McGregor is 6,400 acres. The system it is helping to build is considerably larger, with a mission to show better ways of ranching.
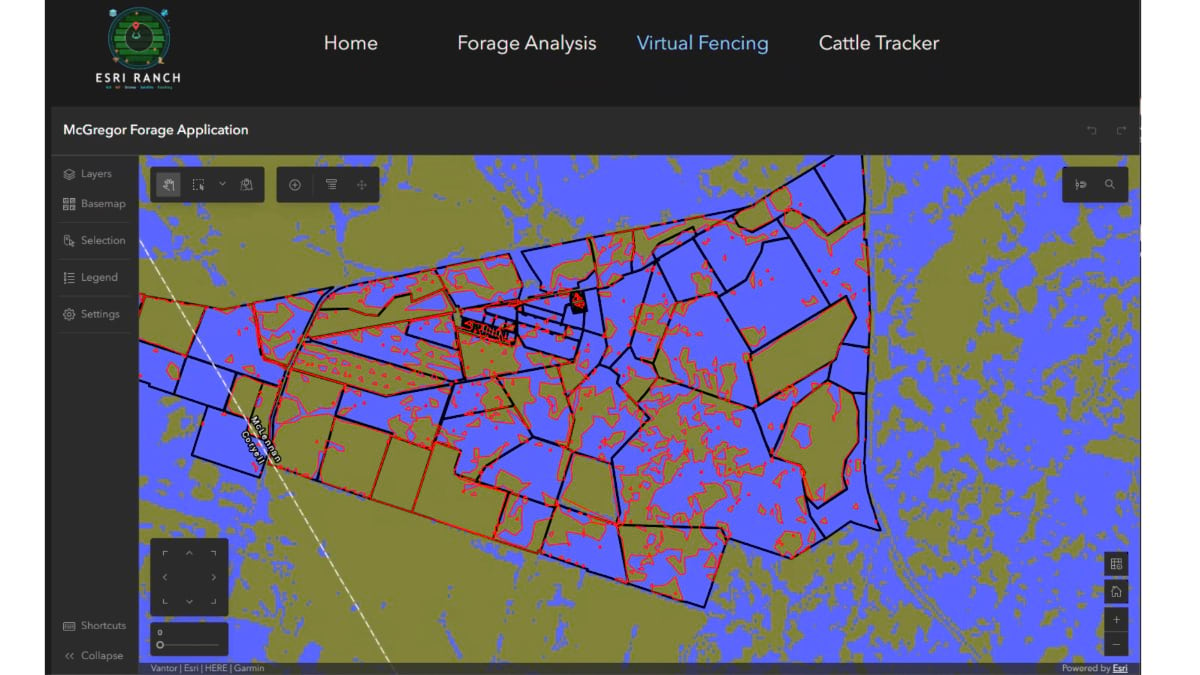
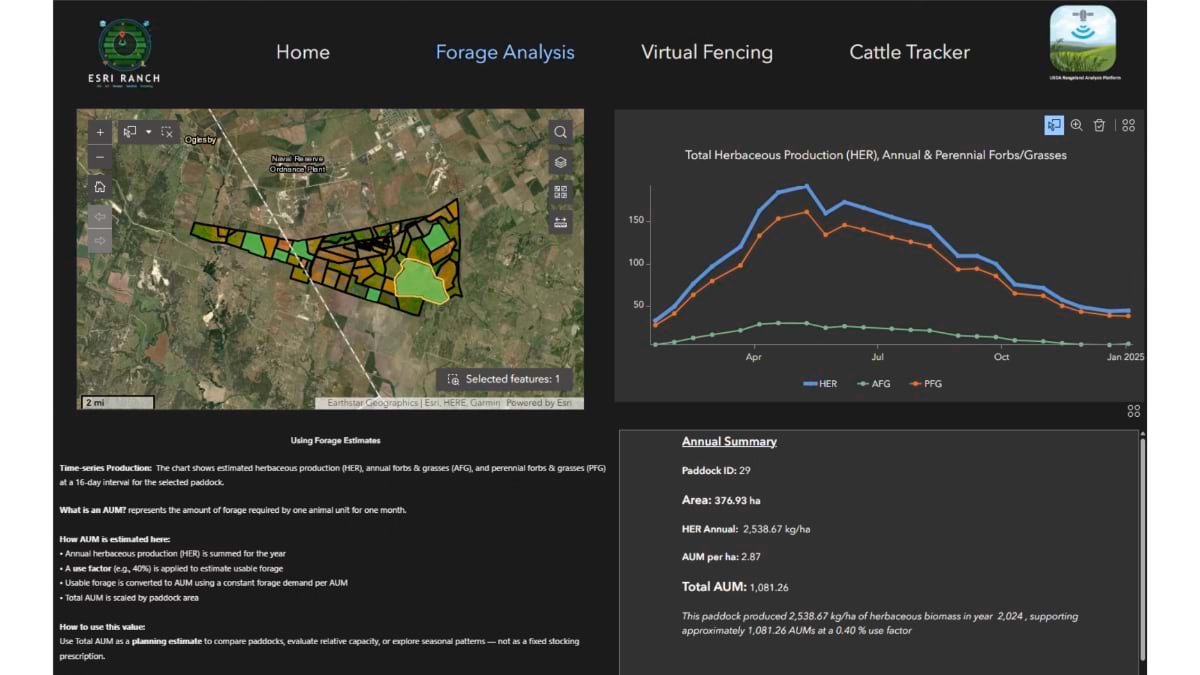
Satellite imagery processed through the USDA’s Rangeland Analysis Platform returns paddock-level estimates of vegetation health and forage quality, updated on a 16-day cycle. A rancher can pull that layer up, see which pastures are producing and at what carrying capacity, and make informed grazing decisions.
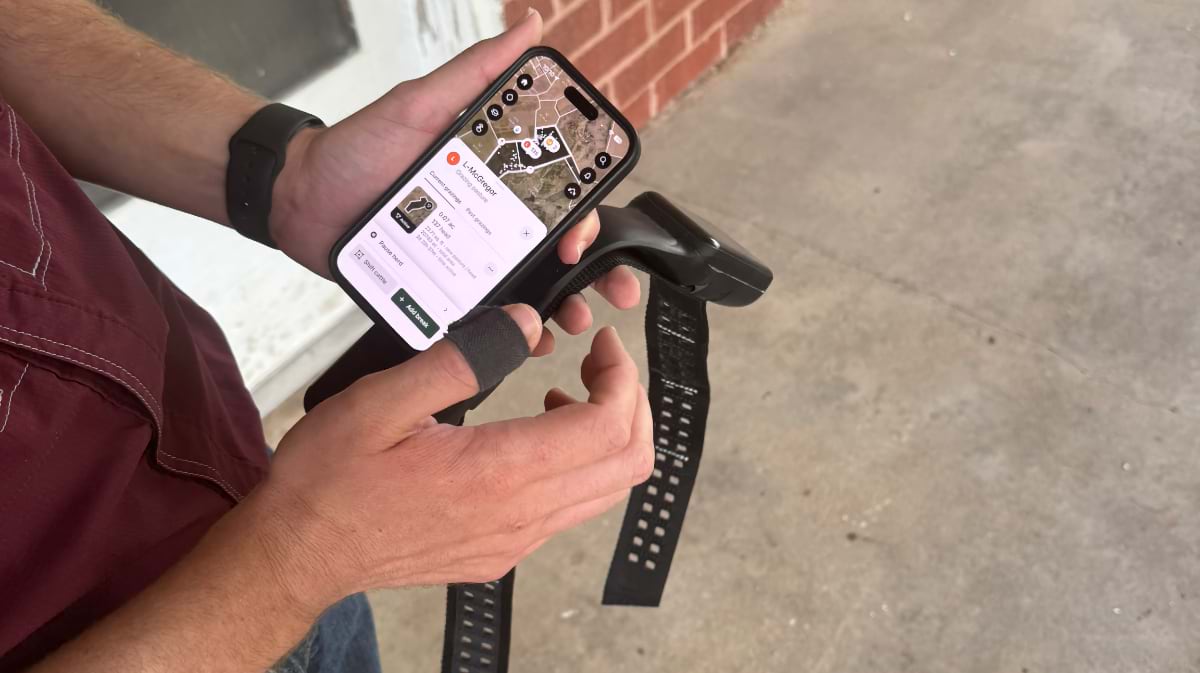
That same map connects to the virtual fencing system. The forage layer tells the rancher where cattle should graze next, and the collars carry out the move. Draw the boundary, move the herd.
GIS integrates what would otherwise be separate systems: public science from federal agencies, sensor data from collars and feedlot bunks, pasture layouts, and herd locations. Together they give producers, researchers, and federal agencies the same information about what is happening on the land. That shared view is what makes coordinated action possible, whether the decision is where to move a herd or how to get ahead of an outbreak moving north.
The New World screwworm doesn’t travel on the wind. It travels with cattle. Spatial analysis of the outbreak’s spread through Central America showed it moving at the speed of trucks, along the same contraband routes that conservationists have monitored for years.
Texas A&M has been preparing since 2024: detection technology, treatment protocols, and communication networks built before the outbreak arrives. The largest land ports of entry for agricultural products in the country run through Texas. If the screwworm crosses, every producer in the US feels it.
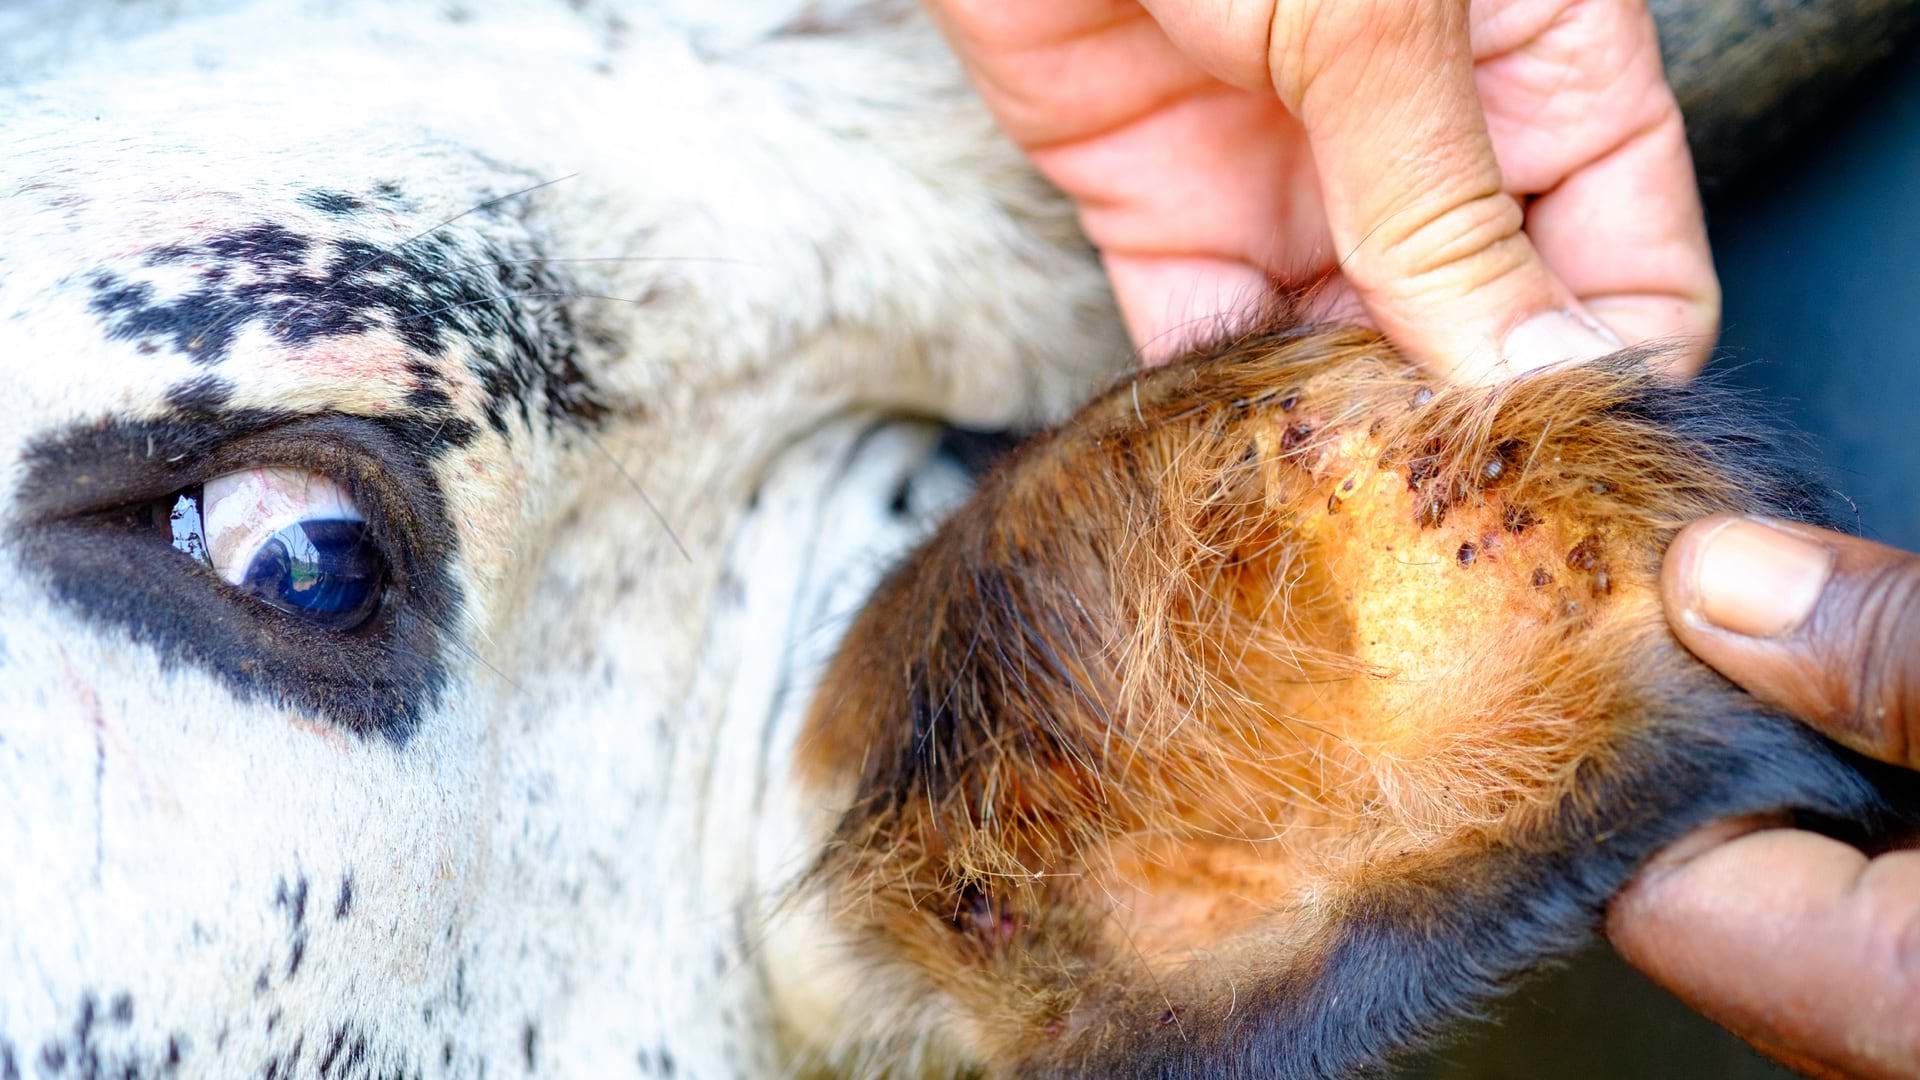
The tools to contain an outbreak like this have already been tested along the same border corridor. The USDA’s century-old cattle fever tick eradication program now runs on GIS-based field apps that turn inspection data into near real-time maps—showing where ticks are active and where they’re likely to appear next. Inspectors log every treatment in the field, and the data flags outbreaks before they spread. Texas A&M is pursuing the same approach for the screwworm.
Explore how GIS is used to analyze all field data in one centralized system.