April 25, 2019 |
Ryan Lanclos | Public Safety
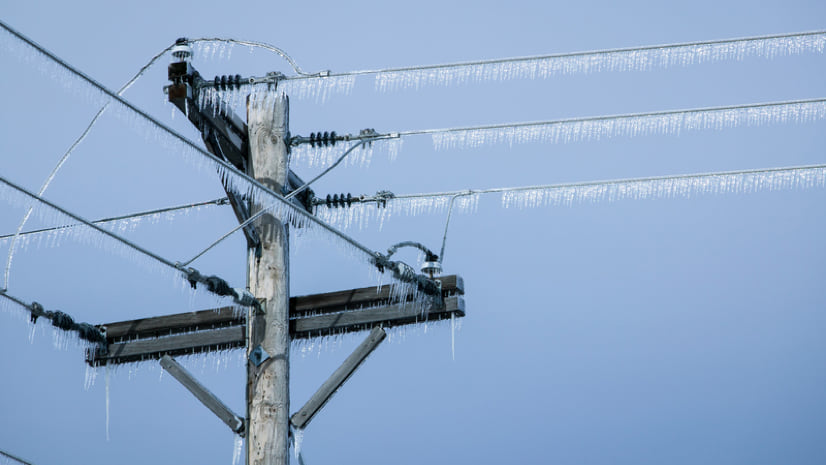
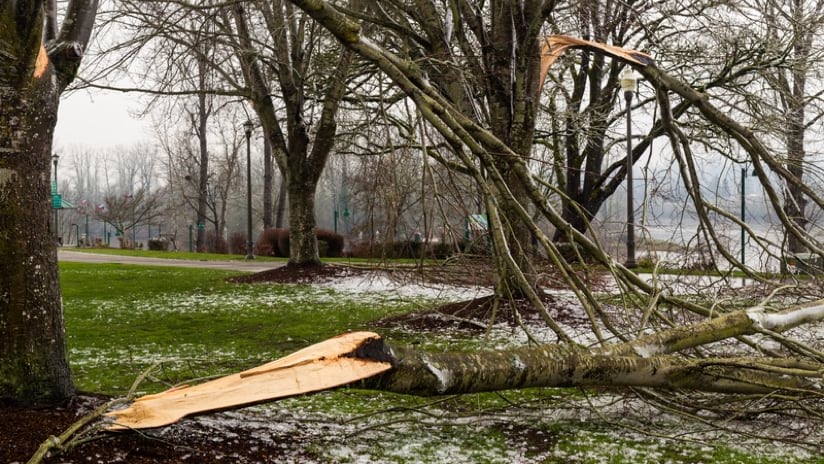
Newscasters warned an evening winter storm would make landfall in Salem, Oregon, on February 12, 2021. Overnight, ice covered the city, rupturing electric transformers and sending tree branches crashing onto streets. By morning there were city-wide road closures, more than 260,000 people without power, and almost 2,000 residents reporting hazardous debris. Devin Doring, technical services supervisor for the city’s public works department, knew his team members needed a system to collect and share all of the information streaming in so that they could respond quickly.
Doring enlisted a familiar technology—the smart maps the city had in place for managing routine operations.
“We realized quickly that we would need to go out; do damage assessments; and, as public works, go make sure the streets were passable,” said Doring. “So… the first path we explored was knowing the conditions and sharing the damage with maps.”
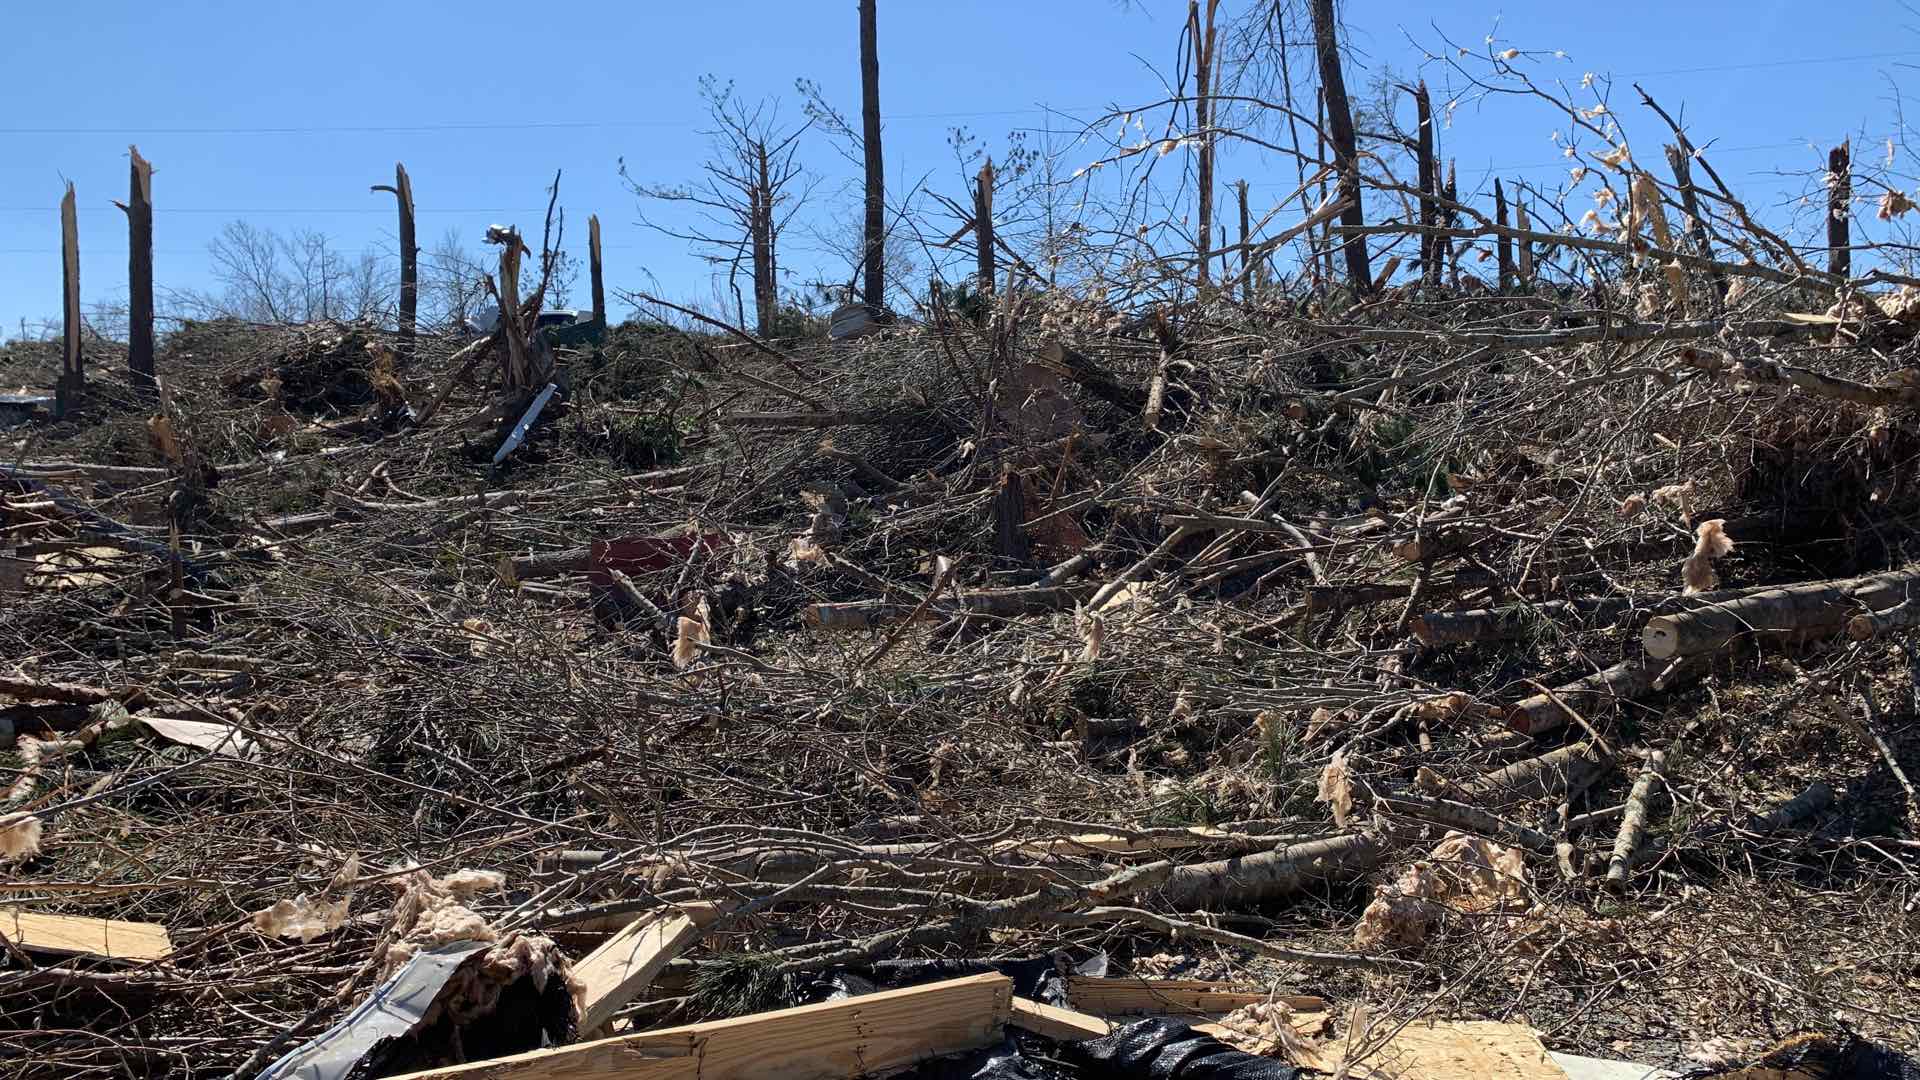
For Doring, the initial response was shock—the forecasts had not predicted the severity of the ice. “I remember waking up to see this inch or two inches’ worth of buildup, trees folded in half, and power lines on the ground. The magnitude of the ice caught everyone by surprise.”
First steps for the public works team included making the roads accessible for utility crews to repair power lines. The team rallied sanding trucks and tree trimming crews. But for the ongoing emergency management effort, the team needed a way for ground crews to communicate with office staff about the damages.

Doring turned to longtime collaborator Daniel Brown, the city’s geographic information system (GIS) supervisor for the enterprise service department. “We didn’t have a playbook for a citywide ice storm event, but we first determined what we could do with GIS.”
To get a holistic picture, Salem’s GIS staff mapped layers of existing data such as information from the city’s 311 call center database and damage reports collected by crews. Staff in the field used GIS-based survey apps to snap photographs and record information such as the location of damaged assets or any hazardous materials. Crews also recorded information such as response priority level (critical, high, medium, or low), type of repair work and equipment needed, the species of downed or damaged trees, and type of infrastructure affected.

The damage reports and photos were synced with other GIS apps on a shared online dashboard. Whether staff members were in the command center, the office, or working from home, they kept an eye on the dashboard maps to assign work orders, track completion, and share updates.
“I think we always knew that the potential to share and collaborate with other agencies was very high,” said Doring.
The dashboard also proved useful for sharing data with other groups to support their response efforts and for Federal Emergency Management Agency (FEMA) reimbursement. All told, estimated costs for Salem’s ice storm response and recovery add up to approximately $6.8 million.
“Whether or not we would qualify for a declared disaster and receive reimbursement from FEMA, we took the lead,” said Brown. “In every decision we made, we built the damage assessment so we could send information to the county or the state or the federal level because we have that understanding of how that can happen.”

A year later, the road to recovery now focuses on damage documentation and tree canopy restoration. “The extent of the damage isn’t something that just stops when all of the debris is collected,” said Doring. “Our urban forester said it will be a years-long restoration process.”
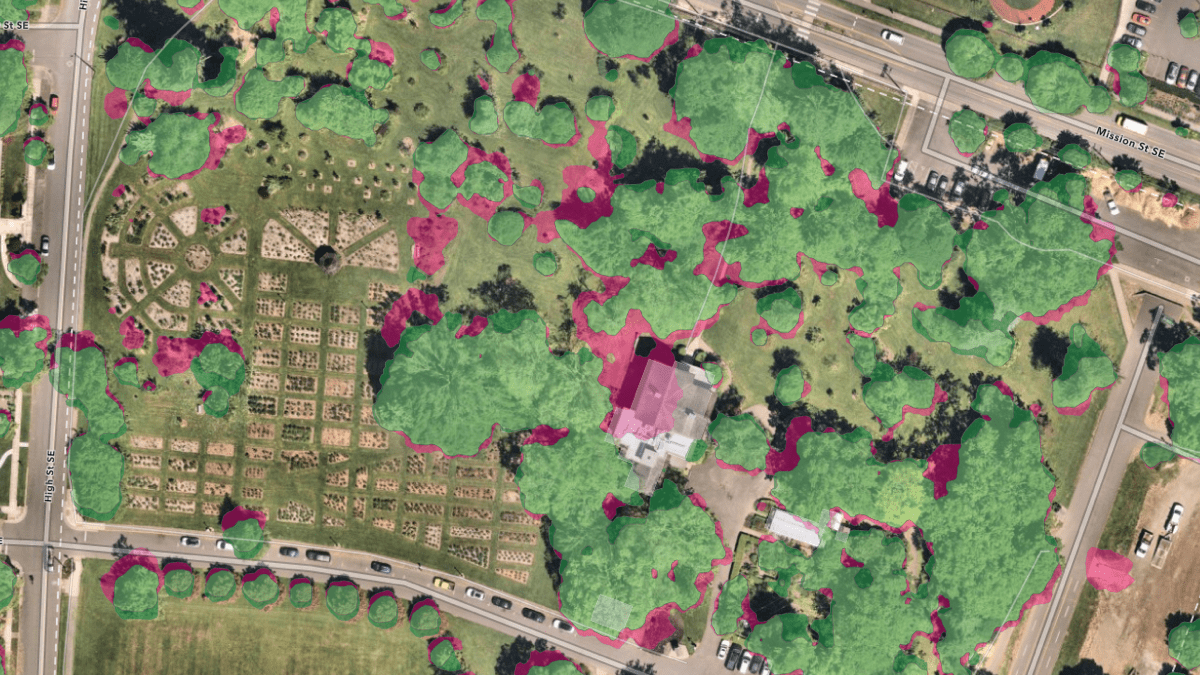
The team used imagery and machine learning tools from Esri partner Nearmap to examine before and after aerial imagery to come up with a citywide measurement of the quantity of trees lost.
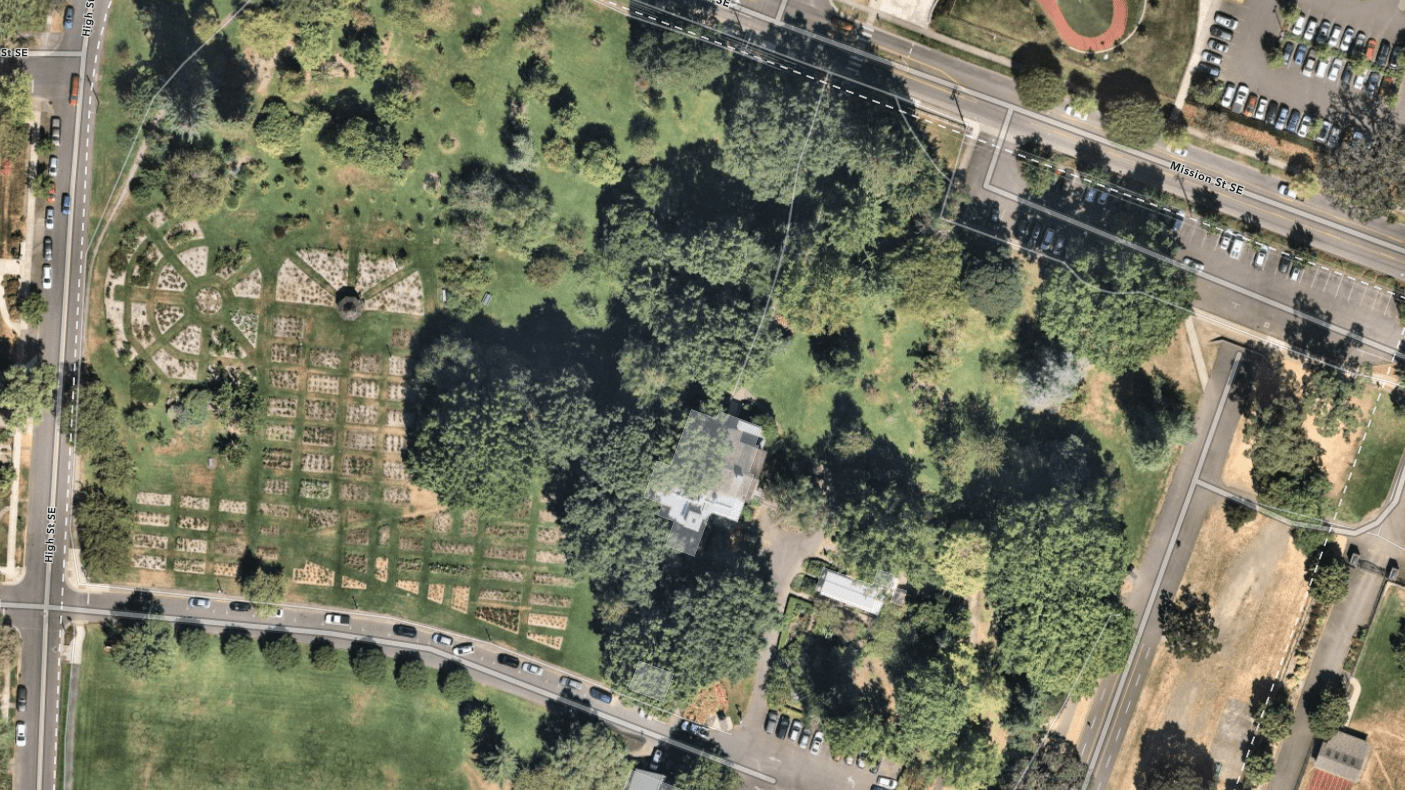
The team created a public-facing tree canopy impact application to show an estimate of how many trees are were destroyed and how the canopy has changed in parks or neighborhoods. People can select specific areas—such as council wards, city parks, public rights-of-way, or stream corridors—to see where to plant new trees.
Building on the tree restoration maps, the team brought in drone imagery to determine where to plant new trees in a local park and cemetery. The team compared data from a recent drone flight to aerial imagery collected in August 2020 and May 2021, providing context for understanding tree canopy loss citywide.

Tallying the metrics of its overall recovery, Salem hauled away 20,600 vehicle loads of debris with a total of 31,000 cubic yards collected. From the downed trees and limbs, the city generated 6,050 tons of wood chips and 214 logs for public use.
Now, staff across departments—having had the chance to use smart maps, GIS apps, and dashboards—are seeing the technology’s potential for decision-making and day-to-day operations. “I think events like this show that GIS can be more than a map, and that it can be a core solution to help us improve our business decisions,” Brown said.
When Doring reflects on the ice storm emergency and its aftermath, he says a successful response comes down to people. “I would say the biggest thing to consider in an emergency is that your response is only as good as your people because they make it happen. We have an awesome GIS team for the city who crushed it, and this is a shout-out to the people and the work they did.”
Learn more about how GIS helps municipalities respond and recovery when disasters strike.