
September 10, 2019 |
July 28, 2020
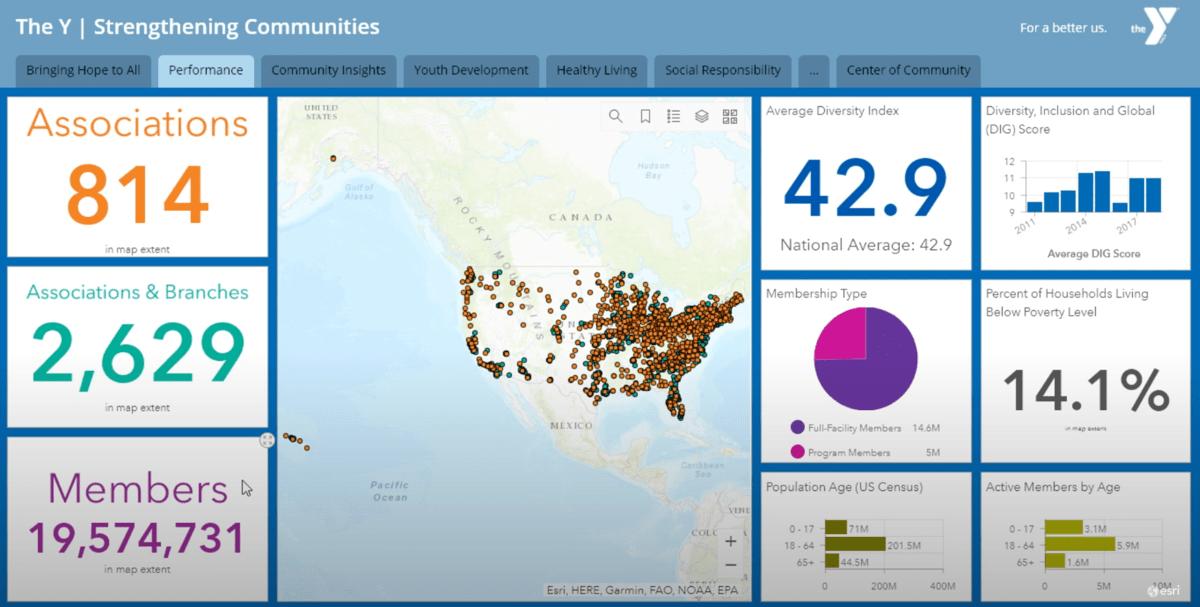
The United States is home to more than 2,600 branches of the YMCA, serving around 20 million members, or one out of every 16 Americans. It is perhaps the only institution so universal it can be identified by a single letter.
But this ubiquity presents a challenge. Every Y serves communities with different needs. In a diverse society, it can sometimes be difficult to discern those needs let alone satisfy them.
Adding to this challenge is the Y’s federated structure. YMCA of the USA (Y-USA), the national resource office for local YMCAs, provides support for the more than 800 independent nonprofits that operate each facility. “Because we are everywhere, decisions about where to invest can be difficult,” said Maria-Alicia Serrano, Y-USA’s senior director of Research, Analytics, and Insights.
The director of a YMCA in Boise, Idaho, recently contacted the national office in Chicago for advice on strategic planning. He was looking for ways to increase membership, particularly among seniors.
The Y-USA representative who took the call launched a dashboard on his computer and shared his screen. The dashboard displayed data from a geographic information system (GIS) that Y-USA makes available to every location. A map of downtown Boise appeared on the screen, including the Y in question.

A GIS map displayed a 12-minute drive-time around the Boise facility. Highlighting a demographic layer on the map revealed that the dominant age group in the zone was people in their 20s.
The director pointed out that those are areas where developers are converting old industrial buildings into lofts and apartments. “Maybe there are some communities I’m not engaging,” he said.
Next, the Y-USA rep turned on a penetration analytics layer of the map. Color-coded areas revealed neighborhoods of lower and higher community engagement with the Y. Two stood out as particularly low. “It looks like I don’t need an older-adult strategy,” the director said. “I need a Boise Junction and southeast-of-downtown strategy.”
The Y adopted its data-driven approach around five years ago as a way to better understand how American society was changing, and how these changes should affect the Y’s operations on a national, regional, and local level. Part of the implementation challenge has been in helping local staffs feel comfortable using GIS tools.
“At first, some of them are afraid they’re going to break it,” Serrano said. “And they literally mean that the tool is going to make smoke come out of the back of their computer! So some of what we do is just sitting with them and saying go have fun with it.”
The median revenue of a local Y is $3.2 million, and the median number of full-time staff is 12. So, Serrano explained, they need support to access and apply data and insights on their communities. Using GIS, staff can research their communities and follow up on hunches about which programs are needed.
Local insights often resonate on a national level. A Y branch in Minneapolis launched women-only swim classes, in part to respect the cultural and religious mores of the large Somali population in its service area. That prompted the Y to use its GIS to search for other large Somali pockets around the country, displaying them on the map alongside Ys with operating revenues and membership sizes comparable to the Y in Minneapolis. The search yielded 180 other branches nationwide that could benefit by offering similar swim classes.
The original Young Men’s Christian Association movement, which began in Great Britain in the mid-19th century, was a reaction to the Industrial Revolution’s rampant urbanization. Reformers feared cities were not offering enough wholesome recreational and leisure pursuits.
Although the Y long ago became inclusive, multigenerational, and nondenominational, supporting childhood development is still the core of its mission. Even with more than 2,600 branches, effectively serving the young means partnering with community organizations, especially schools.”To effectively reach these young people, the Y has to go to them and not ask them to come to us” Serrano explained.
For instance, youth programs such as summer day camp and after-school enrichment at the West Cook Y in Oak Park, Illinois, attract strong interest from economically diverse neighborhoods in the western portion of Chicagoland. The Y identified 50 schools that could potentially partner with West Cook on these programs.
Rather than approach all 50, the Y’s tools mapped out 15-minute walk times for all Y members under 18 in these neighborhoods. The data revealed that partnering with just four schools would allow West Cook to reach 80 percent of these community members.
The Y’s data tools can also serve a more generalized function that furthers its mission of community engagement.
Serrano mentioned someone from the Midwest who recently became acting director of a Y branch in the South. He realized that the tool could give him a crash course in the area’s social and cultural demographics.
“He wasn’t even thinking about using the tool from the perspective of ‘how am I going to get more membership?'” Serrano said. “It was more like, ‘how am I going to relate to community leaders? Who are they? What’s their background?’ So it’s fascinating to me the various ways it can be used. The biggest aha moment is when people sit down and say, ‘Oh, this is what my community looks like.'”
Learn more about self-service location analytics.


September 10, 2019 |

September 24, 2019 |

April 13, 2020 | Multiple Authors |