The successes of electrification are increasingly hard to miss. The International Energy Agency expects over $1.7 trillion to be invested in wind power, solar power, batteries, and electric vehicles this year, compared with $1 trillion spent on fossil fuels. New ultralong-range EVs can travel 500 miles without a charge. Breweries, colleges, and office buildings are adopting heat pumps as an energy-efficient alternative to natural gas.
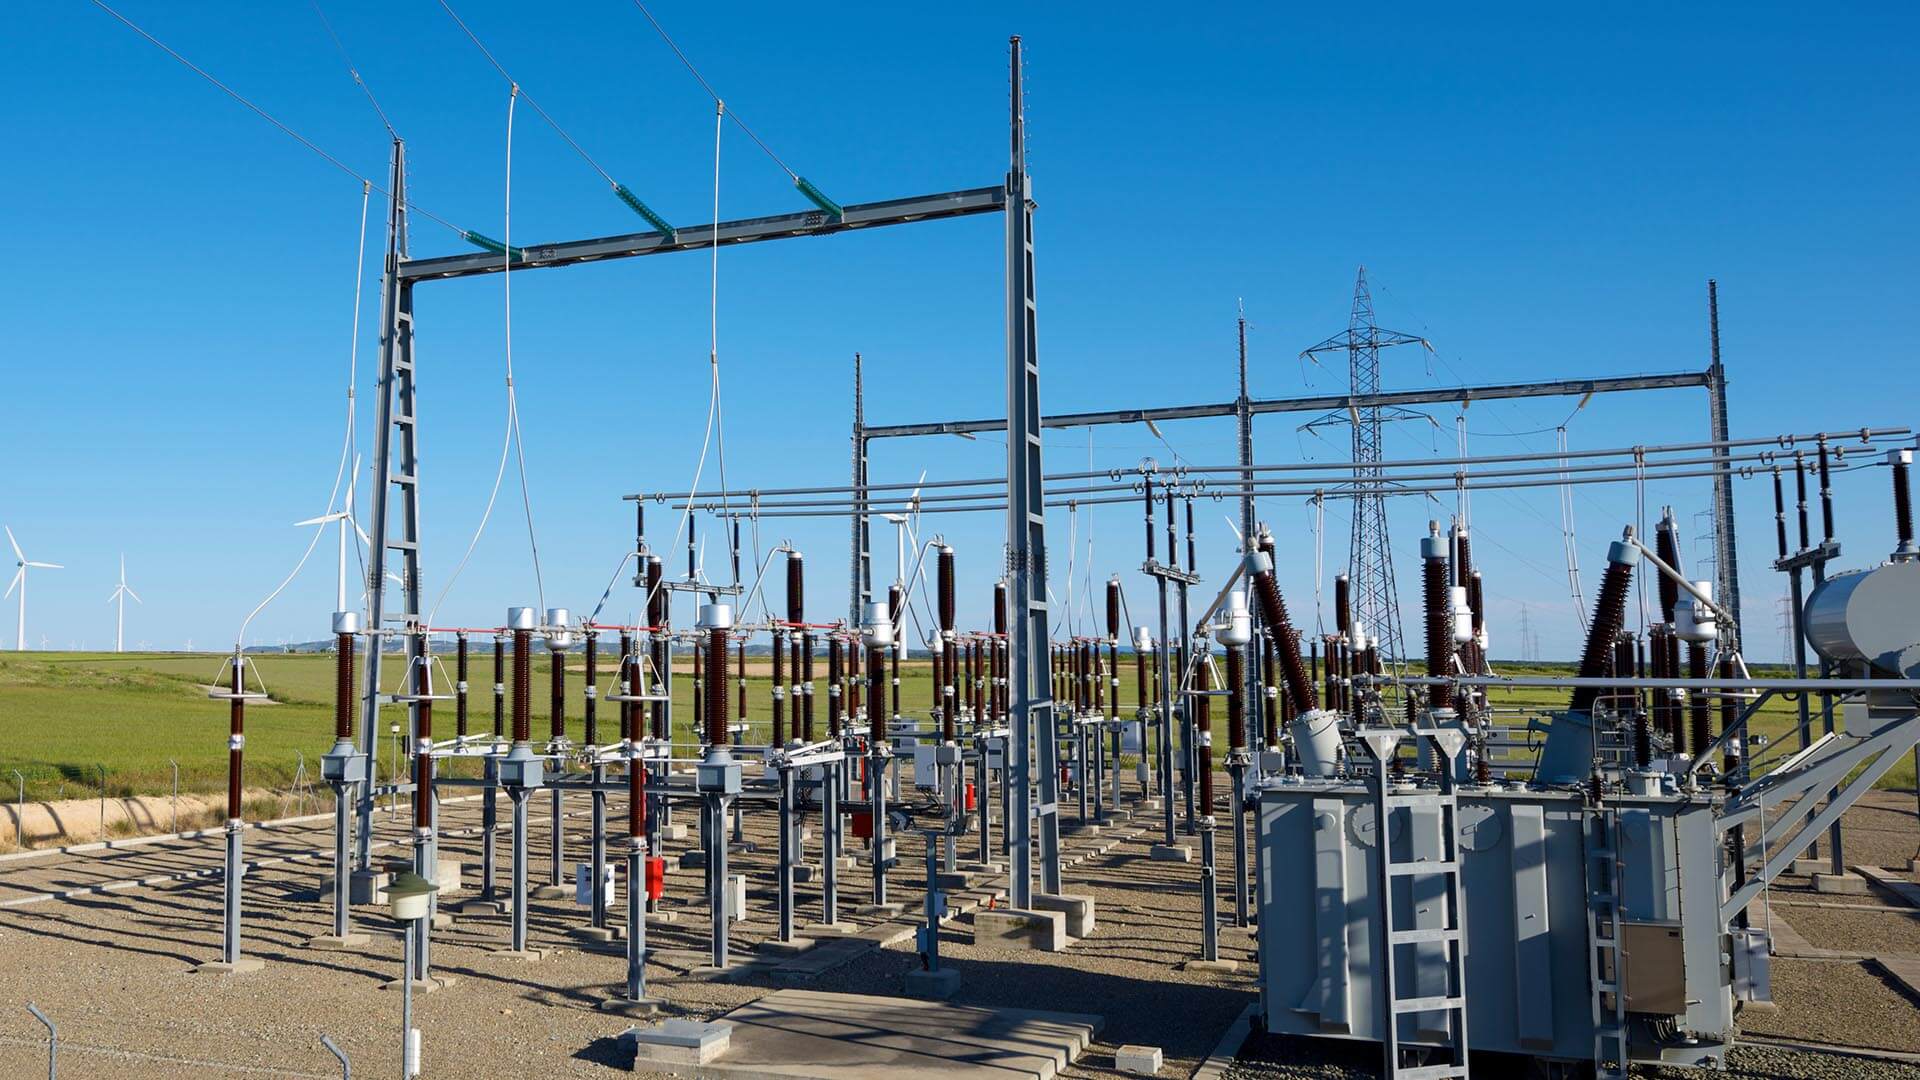
But a lesser-known problem dogs the energy transition: No matter how much renewable energy is created, it can’t reach consumers unless the transmission grid is significantly expanded and upgraded.
America’s ambition to create a 100 percent clean energy grid by 2035 will require between 1,400 and 10,100 miles of new high-voltage transmission—about 1.3–2.9 times the current capacity, according to the Department of Energy’s National Renewable Energy Laboratory. More than 2,000 gigawatts are waiting to be connected to the grid.
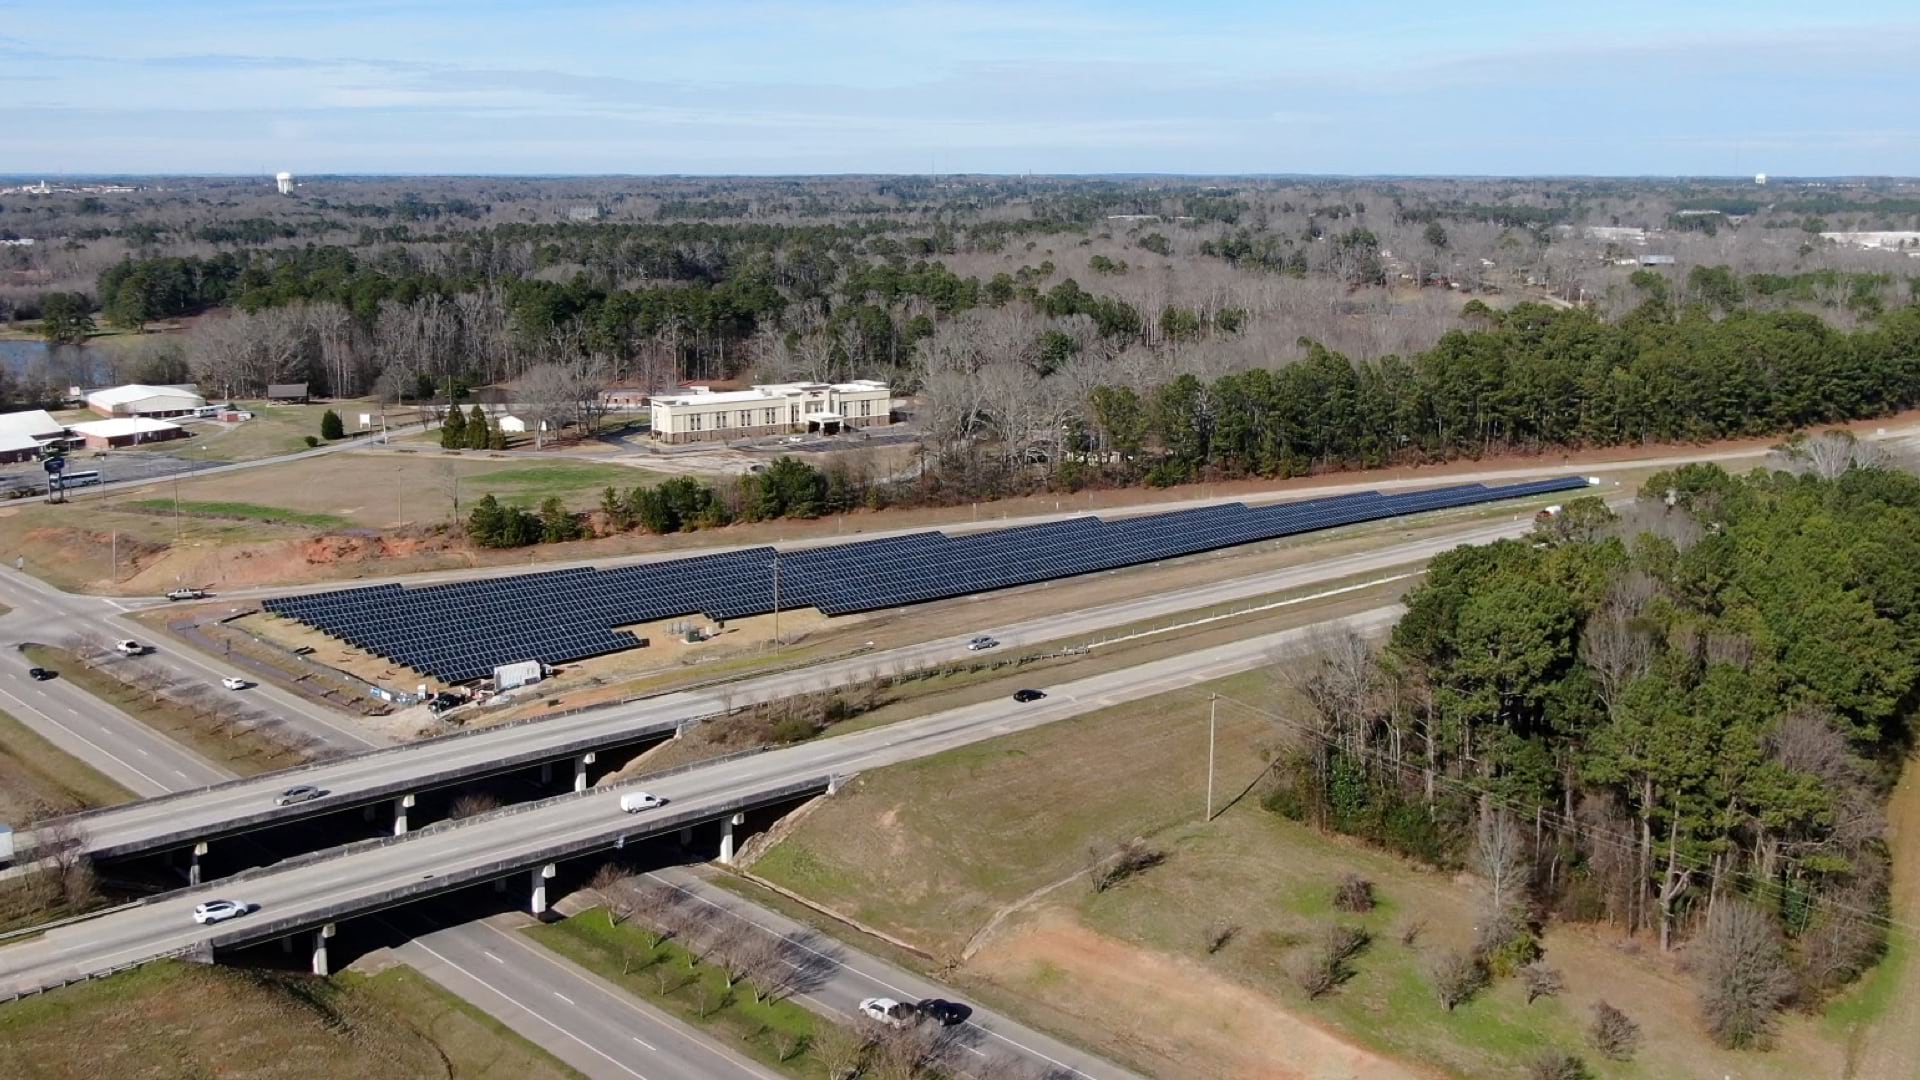
Allie Kelly, executive director of the green energy nonprofit The Ray, believes an elegant solution lies in an inconspicuous type of land: right-of-ways (ROWs). By knitting together government-owned parcels that line roadways and railroads, grid operators can develop corridors to bury underground high-voltage transmission lines. This would expand the grid’s capacity while avoiding property disputes, and reduce the risk of wind or storm damage to the interconnection system.
The Ray has adopted a geographic approach to help state agencies like departments of transportation analyze the suitability of transmission corridors. With geographic information system (GIS) technology, the team combines dozens of datasets with cost estimates and 3D visualizations, guiding transportation officials toward the most efficient, cost-effective ways to grow the clean energy grid.
A Suitability Analysis for Transmission—Driven by Location Data
In the video below, Kelly shares a GIS map displaying highway ROWs throughout Minnesota. A sidebar highlights the many layers that drive a suitability assessment—everything from soil type and topography to critical wildlife habitats and ROWs that are too narrow for construction.
A location analysis color-codes potential transmission corridors for suitability. Railroad crossings, overpasses, or marshy areas are marked red to convey the likelihood for higher costs and complications. Green signals less challenging and less expensive sections.
Developers can use more granular forms of location intelligence as decision-making cycles progress. A GIS-based 3D visualization—akin to the project’s digital twin—can help planners balance project objectives with realities of the terrain. The technology calculates basic build costs of a transmission path by analyzing the spending associated with water and road crossings, boring and trenching. Such location awareness lowers project risk and promotes better cost control.
For Kelly and other clean energy advocates, growing the grid’s capacity for renewable energy sources is arguably today’s most urgent task. By combining data and visuals into a powerful scenario-planning platform, GIS is playing a key role in helping states find the fastest routes to an efficient, resilient clean energy grid.
For a closer look at how location analysis aids energy planning, view the full video of Allie Kelly’s presentation.
The Esri Brief
Trending insights from WhereNext and other leading publicationsTrending articles

December 5, 2024 |

June 23, 2026 |

March 3, 2026 |

March 17, 2026 |

April 7, 2026 |

June 2, 2026 |