The global energy transition has a bright future and a formidable challenge.
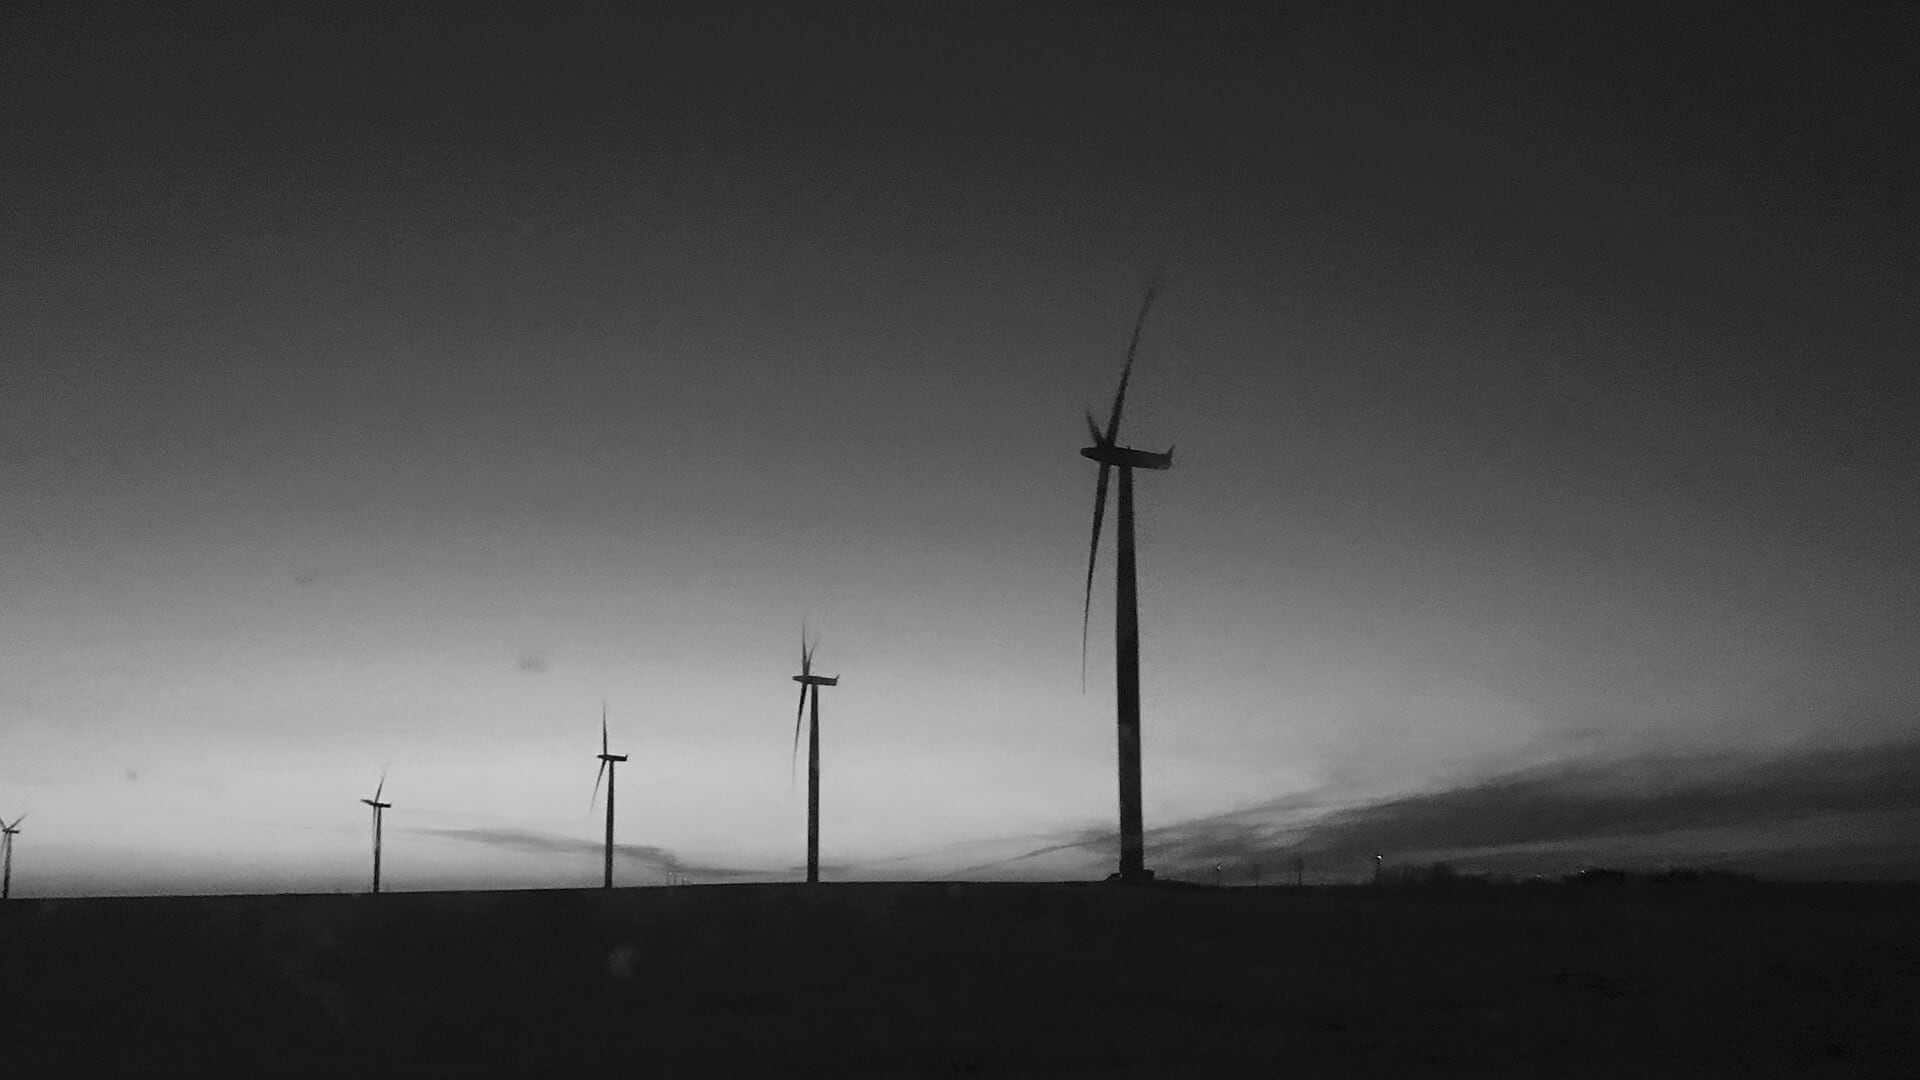
Renewables are expected to exceed coal as the world’s largest source of electricity by 2025, and in many places, green energy is now cheaper than oil, coal, or gas. Wind farms in the High Plains region of Texas, for instance, have the capacity to generate enough energy to power 9 million homes at a rate cheaper than in other parts of the state.
But many of those turbines in the Lone Star State must be turned off to limit production because of insufficient transmission networks. Modern electric grids were designed to accommodate a few centralized power plants, not the growing number of geographically diverse renewable projects. As a result, wind energy producers seeking a connection to the grid today face an average wait of around five years while system operators study the transmission upgrades needed to reliably support the new interconnection.
To speed up development of new projects—including power generation and power transmission—clean energy leaders are turning to geographic information system (GIS) technology. The operational picture GIS creates through smart maps helps power producers identify where they might connect to the grid and helps grid operators track planned wind farms that may demand new transmission capacity (see sidebar below).

To power the US entirely with renewable energy by the president’s target date of 2035, the number of power lines spanning state lines needs to double or triple, according to the National Renewable Energy Laboratory.
Location Insights Lay the Groundwork for Clean Energy at NextEra Energy and Beyond
Location intelligence is essential for today’s wind projects. Decision-makers use GIS analysis to find markets and sites for favorable investments, and project managers study maps to assess land availability and composition.
In an industry focused on unleashing pent-up demand, GIS is accelerating time to insight and action.
At NextEra Energy, the world’s largest producer of wind and solar power, the technology is a center of activity.
“We have a presence in 49 states and Canada, and multiple teams that are using GIS, so having a resource that brings multiple sources of information together drives transparency and helps all of us to make better decisions based on the latest data,” says Kevin Gildea, NextEra Energy’s vice president of development.
Meanwhile, grid operators like Fingrid are employing GIS to plan expansions that will accommodate new sources of energy.
“It’s very important to understand, Where’s the demand to connect production and where’s the demand to connect consumption? And then to analyze, What are the requirements for the power grid to enable the planned projects?” says Ari Tuononen, a specialist for grid services at Finland’s grid operator.
When meeting with clean energy producers, Fingrid’s customer managers use maps to visualize the system’s connection capacities. The data-rich operational picture can steer planners away from areas that are becoming crowded in favor of locations where renewable production can connect more quickly.
For the US and Europe to achieve ambitious clean energy goals, collaborations between energy producers and transmission operators will be key. “I’m a firm believer in geography as a great common language that we can all leverage,” says Andrew Norris, head of GIS at NextEra Energy. “You put a map on the table or up on the screen and everybody understands what you’re talking about.”

There’s a lot of other things you can do in situ that required a ton of manpower, long lead times, and delays. Geospatial technologies and data have made that a lot easier.
A Wind Energy Industry in Rapid Transformation
When Gildea joined NextEra Energy in 2007, tracking available land was still an analog process. Gildea would record land rights in a plat book with a green highlighter.
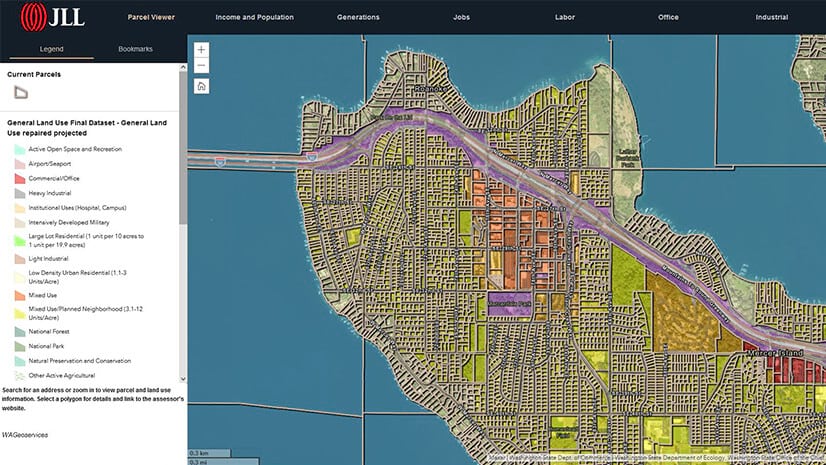
Today, digital maps guide nearly every step of NextEra Energy’s development process, from land management to market analysis to operations and maintenance. In the site selection stage, GIS allows decision-makers to see wind speeds in areas where high-voltage transmission lines are available. Maps also reveal data on population density, land use regulations, slope, and other location-sensitive factors.
“When building new projects, these insights provide real-time information that helps us make smart investments,” Gildea says. “It allows us to continuously improve our development processes, enhance project reliability and sustainability, and build better relationships with our customers and the communities we serve.”
Location insights also facilitate communication with communities. As development progresses, project planners can communicate with landowners through iPad-based maps to demonstrate, for instance, that a planned service road won’t compromise access to crops. Once land rights have been secured, a GIS dashboard guides the construction process with meteorological data and environmental assessments.
At NextEra Energy, a single operational view is essential to risk management, alerting the team to climate threats like hurricanes and potential mitigation measures.
“Throughout these efforts, wind producers must communicate with grid operators,” Gildea says. “When we connect into their substations, we’re using GIS to have that conversation about how our line is going to come into their facilities, how their lines are coming out of the facilities, and how we need to route around.”

GIS technology today helps me better see land ownership, topography, wind resource, where it is that we're thinking about siting infrastructure, and existing infrastructure that's on the ground that we need to be cognizant of, and that is very helpful.
A Geographic Approach to Growing the Power Grid
For grid operators, adapting to the clean energy era means building new transmission lines and substations at an unprecedented pace. Through location software, grid planners can monitor proposed wind farms and plan transmission expansions accordingly.
On one of Fingrid’s color-coded public GIS maps, green communicates a project in permitting, yellow indicates a project with approved permitting, and red designates a project under construction or in operation.
“You can immediately get a picture of what’s going on,” says Tuononen of the operational view location technology provides.
When Fingrid receives a new connection inquiry from a power producer, it is logged in GIS with basic data about the project, including its status and projected output. As meetings progress, data is added and updated by the producer and Fingrid’s customer managers, planners, and experts.
Fingrid’s ability to visualize future development and current capacity helps the utility company advise wind energy producers. A less desirable connection point might be available today, but if a producer waits a few years, a new power line could provide an easier connection and more capacity.
“We forecast the development of renewable production capacity in various regions for the years to come, and we update the outlook with new data each year,” Tuononen says.
Because the power generated by turbines is less stable than that of nuclear or hydropower plants, GIS analysis can also show energy producers where more investment is needed to smooth out volatility.
For clean energy producers and the grid operators transmitting power to consumers, location insight is central to the energy transition. GIS provides a holistic picture of operations, enabling coordination that speeds progress and improves investment decisions.
“The journey we’ve been on is about collaborating,” says NextEra Energy’s Norris. “It’s about folks having that information at their fingertips and not just consuming it but enriching it and improving it.”
The Esri Brief
Trending insights from WhereNext and other leading publicationsTrending articles

December 5, 2024 |

March 31, 2026 | Multiple Authors |
January 6, 2026 |
February 17, 2026 |

March 3, 2026 |
July 25, 2023 |