John Nelson
Connect:

I have far too much fun looking for ways to understand and present data visually, hopefully driving product strategy and engaging users. I work in the ArcGIS Living Atlas team at Esri, pushing and pulling data in all sorts of absurd ways and then sharing the process. I also design user experiences for maps and apps. When I'm not doing those things, I'm chasing around toddlers and wrangling chickens, and generally getting into other ad-hoc adventures. Life is good. You might also like these Styles for ArcGIS Pro: esriurl.com/nelsonstyles
Posts by this author
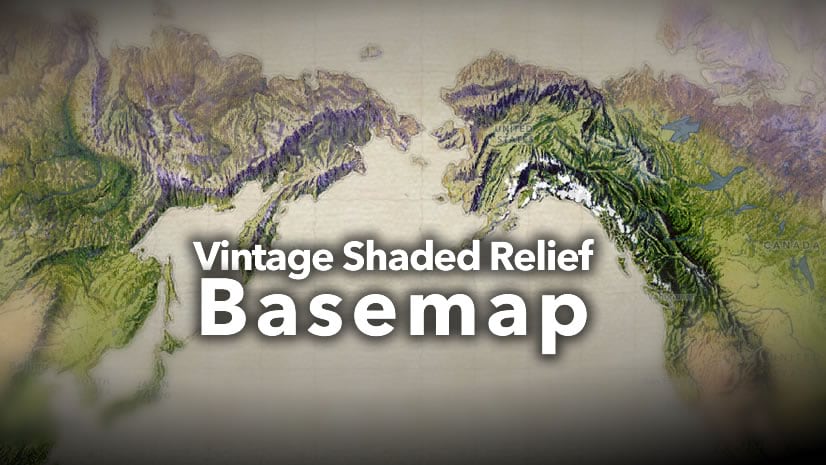
Vintage Shaded Relief Basemap

This basemap blends wonderful vintage hand-painted tones and hillshades with modern satellite imagery.

Continue Reading

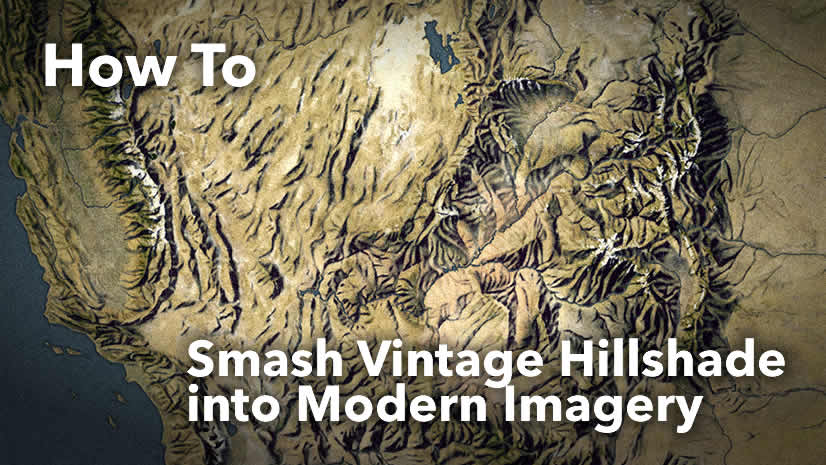
How To Smash Vintage Hillshade into Modern Imagery

No doubt, vintage shaded relief maps are just bonkers beautiful. Here's how to coax some of that craftsmanship of yore into your own maps.

Continue Reading

Iceberg Map: Part 2, Animation

How to make a huge heaping pile of data dance in time.

Continue Reading

Iceberg Map: Part 1, Cartography

How to make this map of heaps and heaps of spectacular iceberg tracking data.

Continue Reading

40 Years of Piracy

Real honest to goodness pirate attacks. How to make this map with NGA data.

Continue Reading

Understanding the Grand Canyon by Turning It Inside Out

Sometimes the best way to understand something is to think of its exact opposite.

Continue Reading

Create a Mappy Background Graphic in 3 Steps

Three mega-simple steps to create those vaguely geographic background grid things graphic designers love so much.

Continue Reading

Hillshade Blending Sorcery via JavaScript API

Smash hillshade and imagery together with math on the fly in the browser to make cool maps.

Continue Reading

5 Ways to Make Your Overview Map Sizzling Hot

Turn that zero overview into a hero overview

Continue Reading

1 25 26 27 28 29 37