Did you miss the January 2020 “Highlights of ArcGIS Living Atlas” webinar? No problem! If you have 57 minutes to spare, you can watch the recording here. But if you’re short on time, this quick recap will show you some of what you missed. Buckle up!
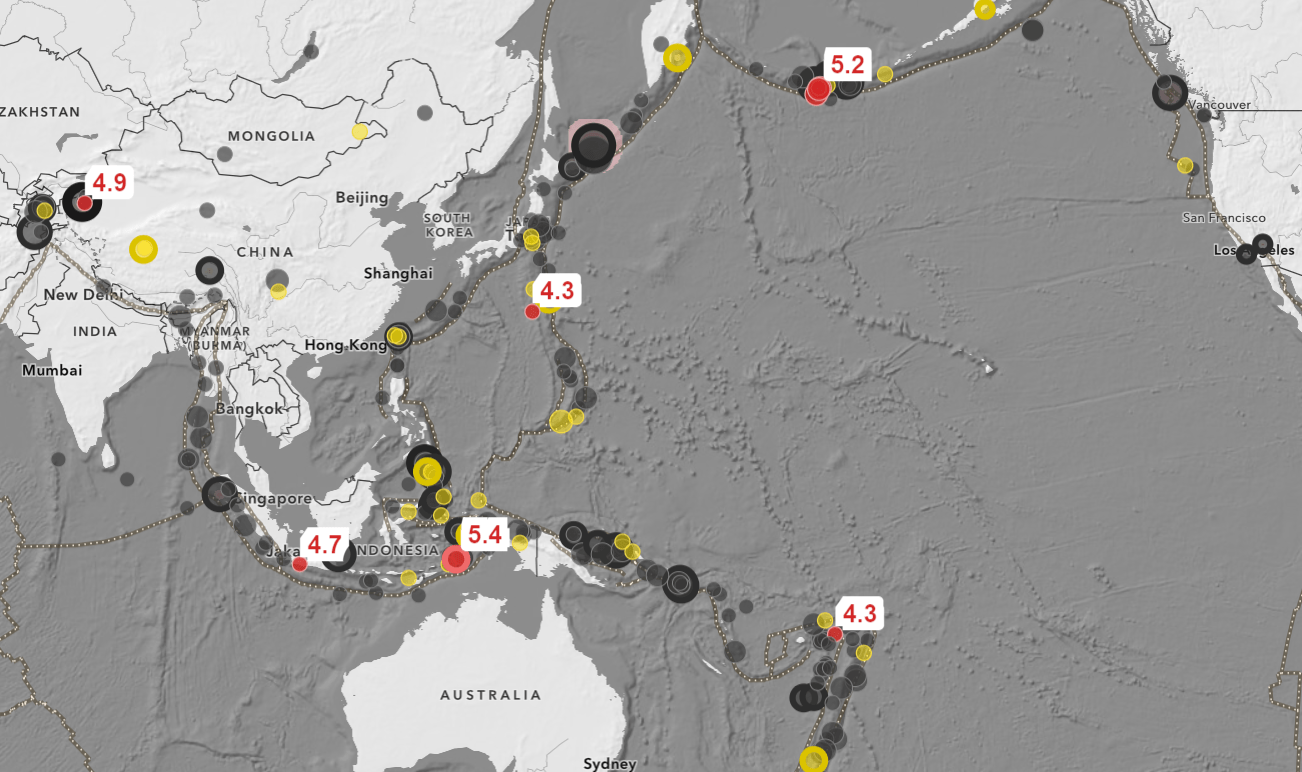
Live Feeds
Find live, authoritative data layers covering topics such as weather, fires, ocean temperatures, and many others. New to Living Atlas, many of the live feeds services are now offered as hosted feature services, giving you much more flexibility in their use. Also, the new hosted layers don’t require a subscription. Just add them into your maps, and these layers will show the updated data automatically. Click here to see all live feeds available in ArcGIS Living Atlas.
Sea Ice Aware
See how sea ice is changing in the Arctic or Antarctic regions with this interactive application. Visualize patterns of monthly average sea ice change over time and use the interactive charts to learn more. Click here to view the application. You can also find the layers shown within the app and use them in your own maps.
American Community Survey (ACS)
Learn more about the population with these layers containing the most current ACS data from the US Census Bureau. The layers are automatically updated each year when the Census releases their new data, so you know you’re always getting the most current values. Customize these layers to your needs to learn more about the human landscape of the United States. Click here to learn more about these layers.
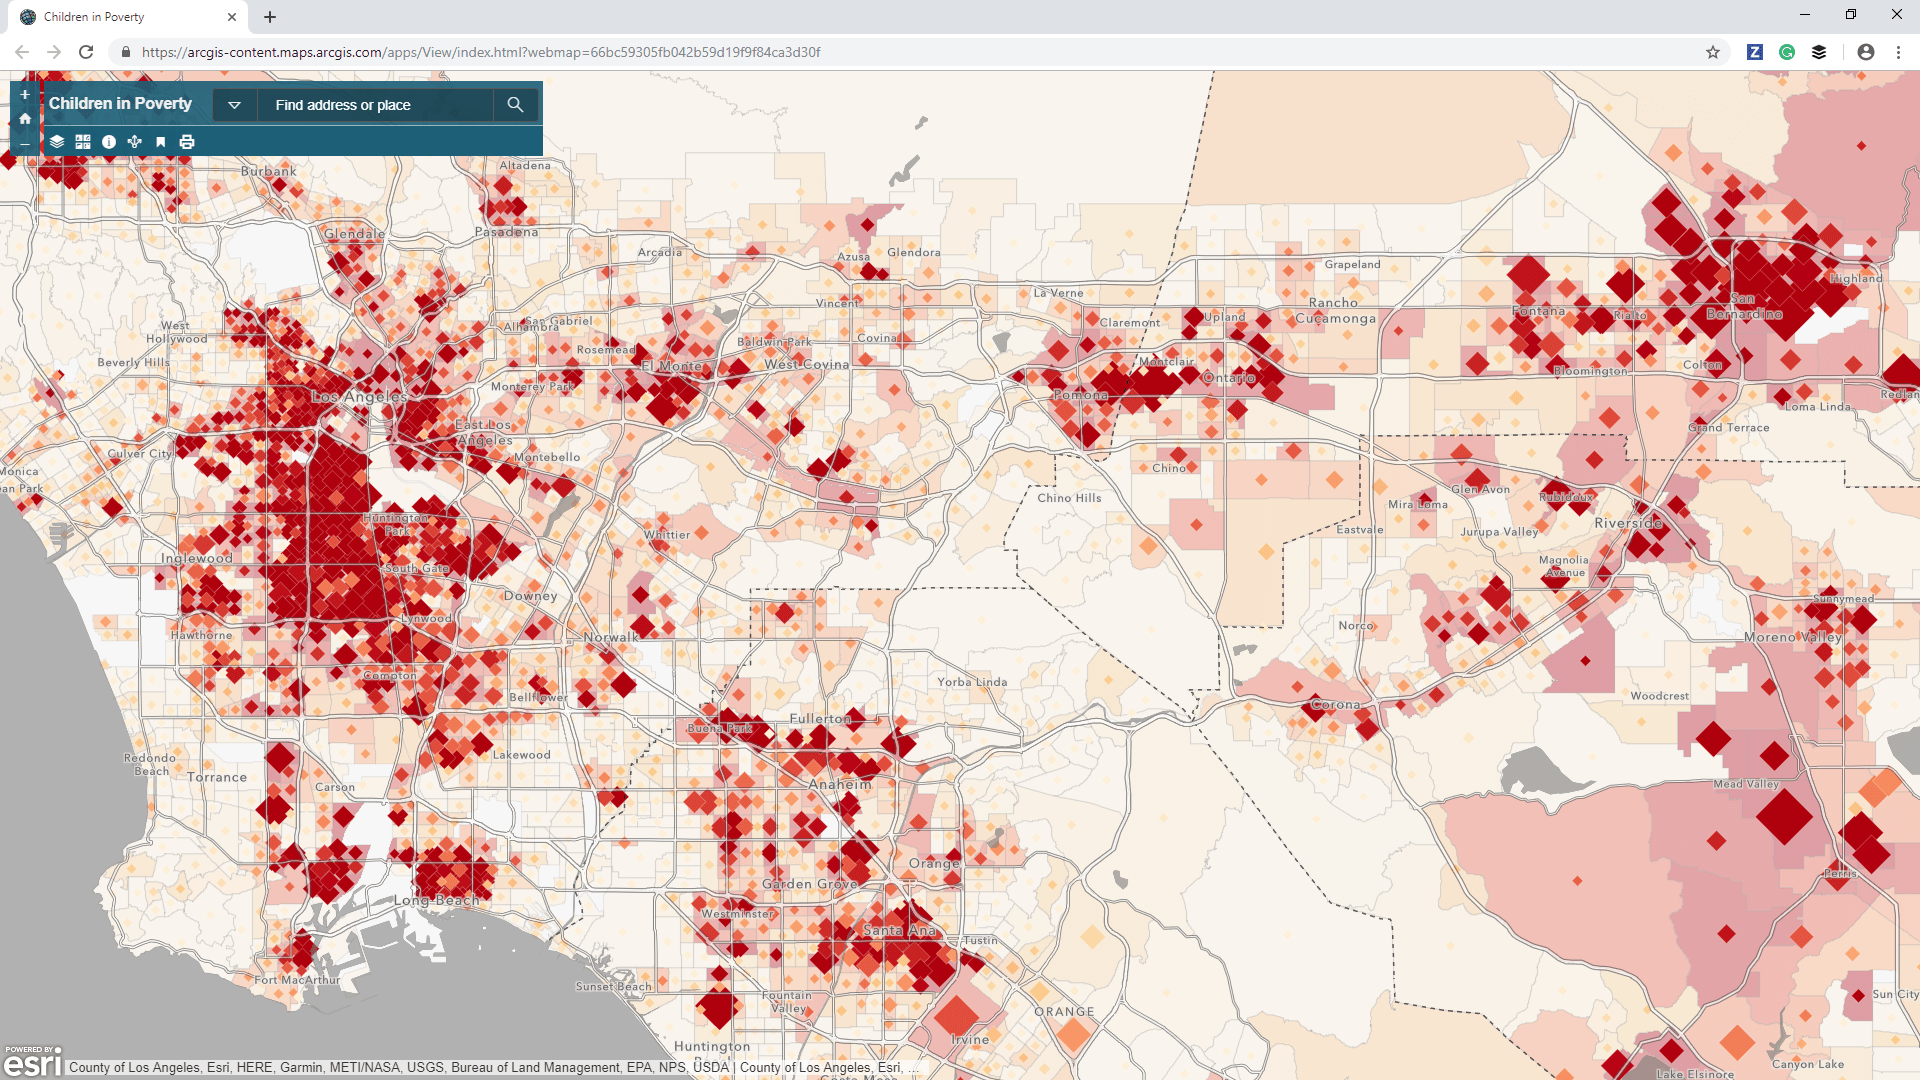
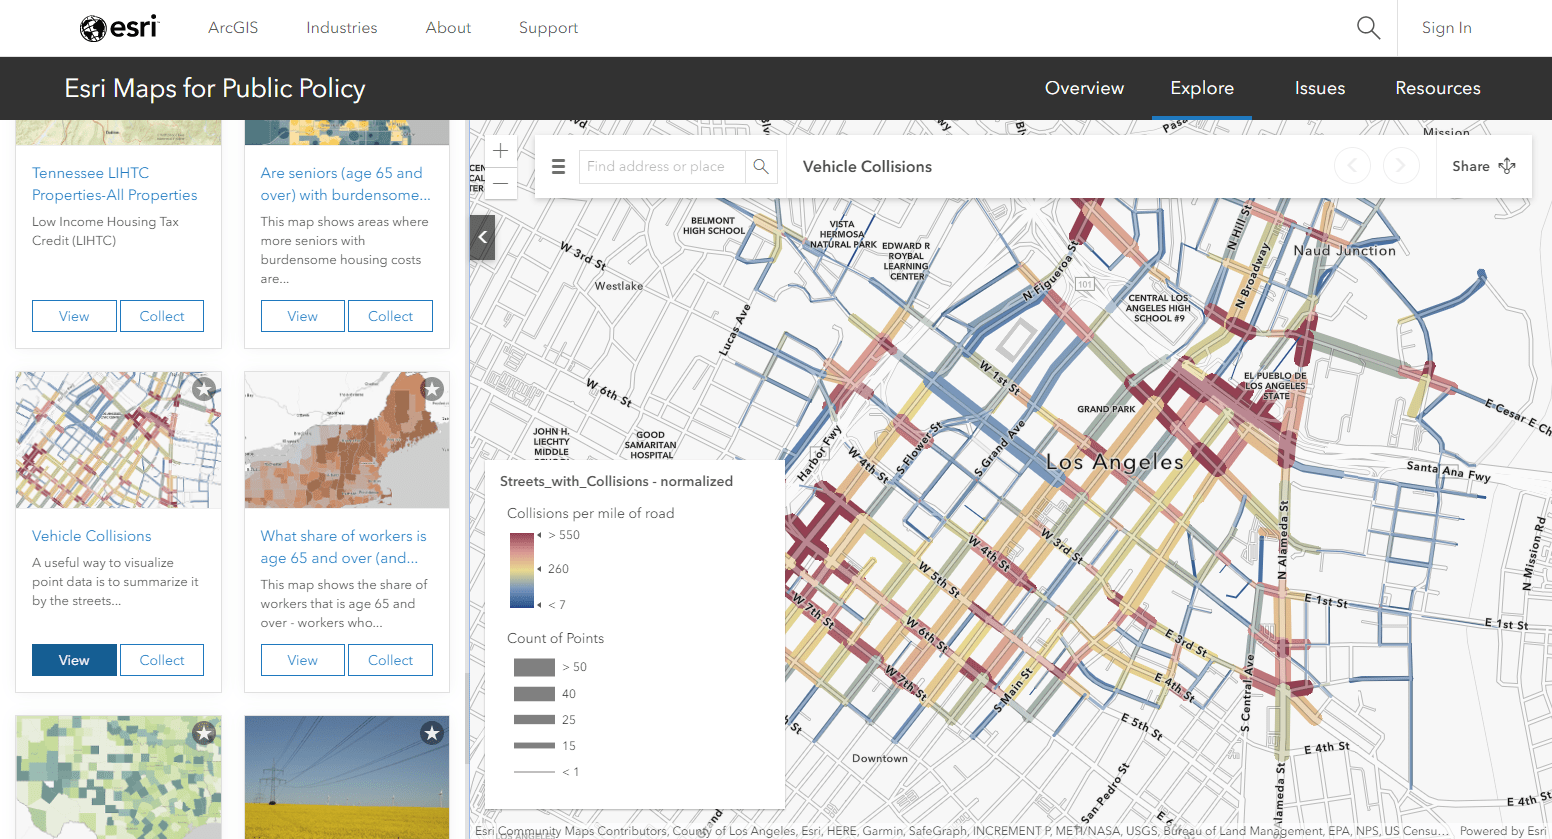
Esri Maps for Public Policy
Raise the level of spatial and data literacy used in public policy with the new Esri Maps for Public Policy site. Explore different topics about your city, or find resources to make your own maps that highlight opportunities to intervene with policy. Click here to visit the Esri Maps for Public Policy site.
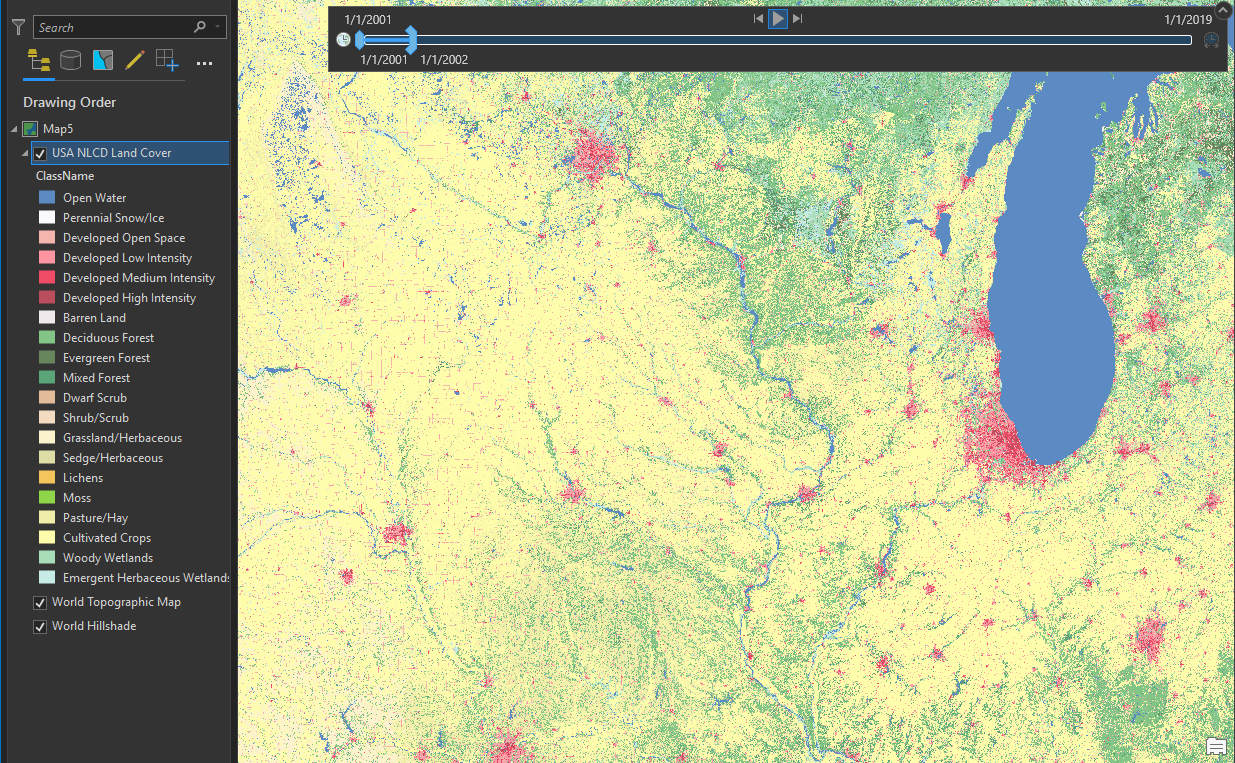
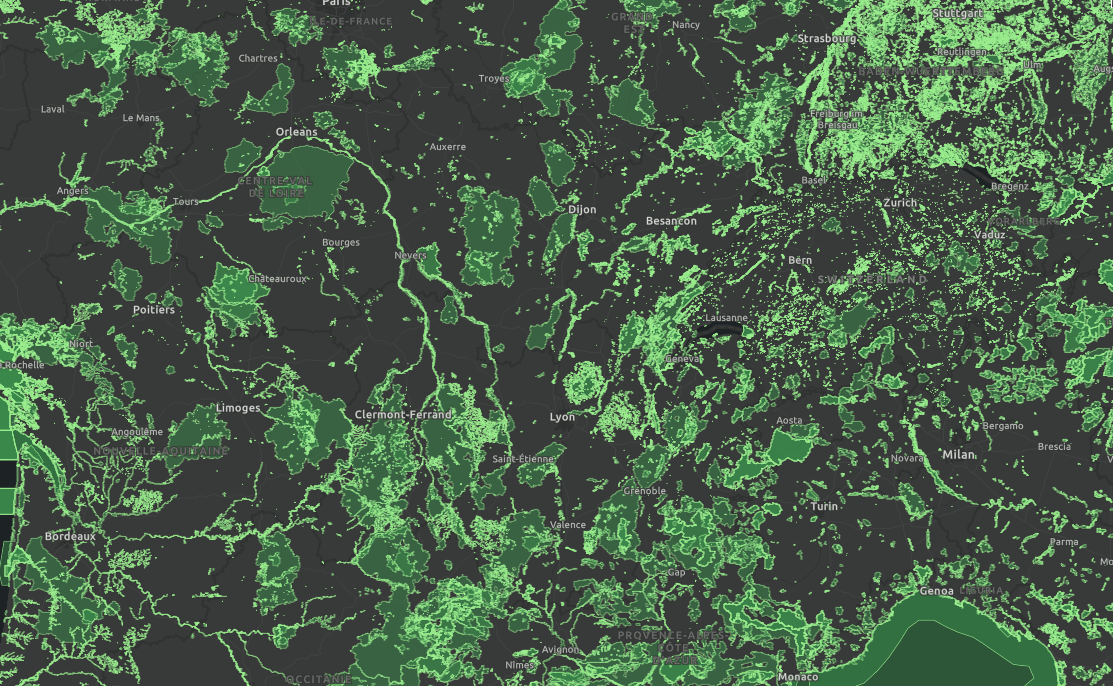
USA NLCD Land Cover
Land cover describes the surface of the earth. This time-enabled service of the National Land Cover Database groups land cover into 20 classes based on a modified Anderson Level II classification system. Classes include vegetation type, development density, and agricultural use. Find this layer and related NLCD datasets here.
Mapping the Ocean and Hydrology
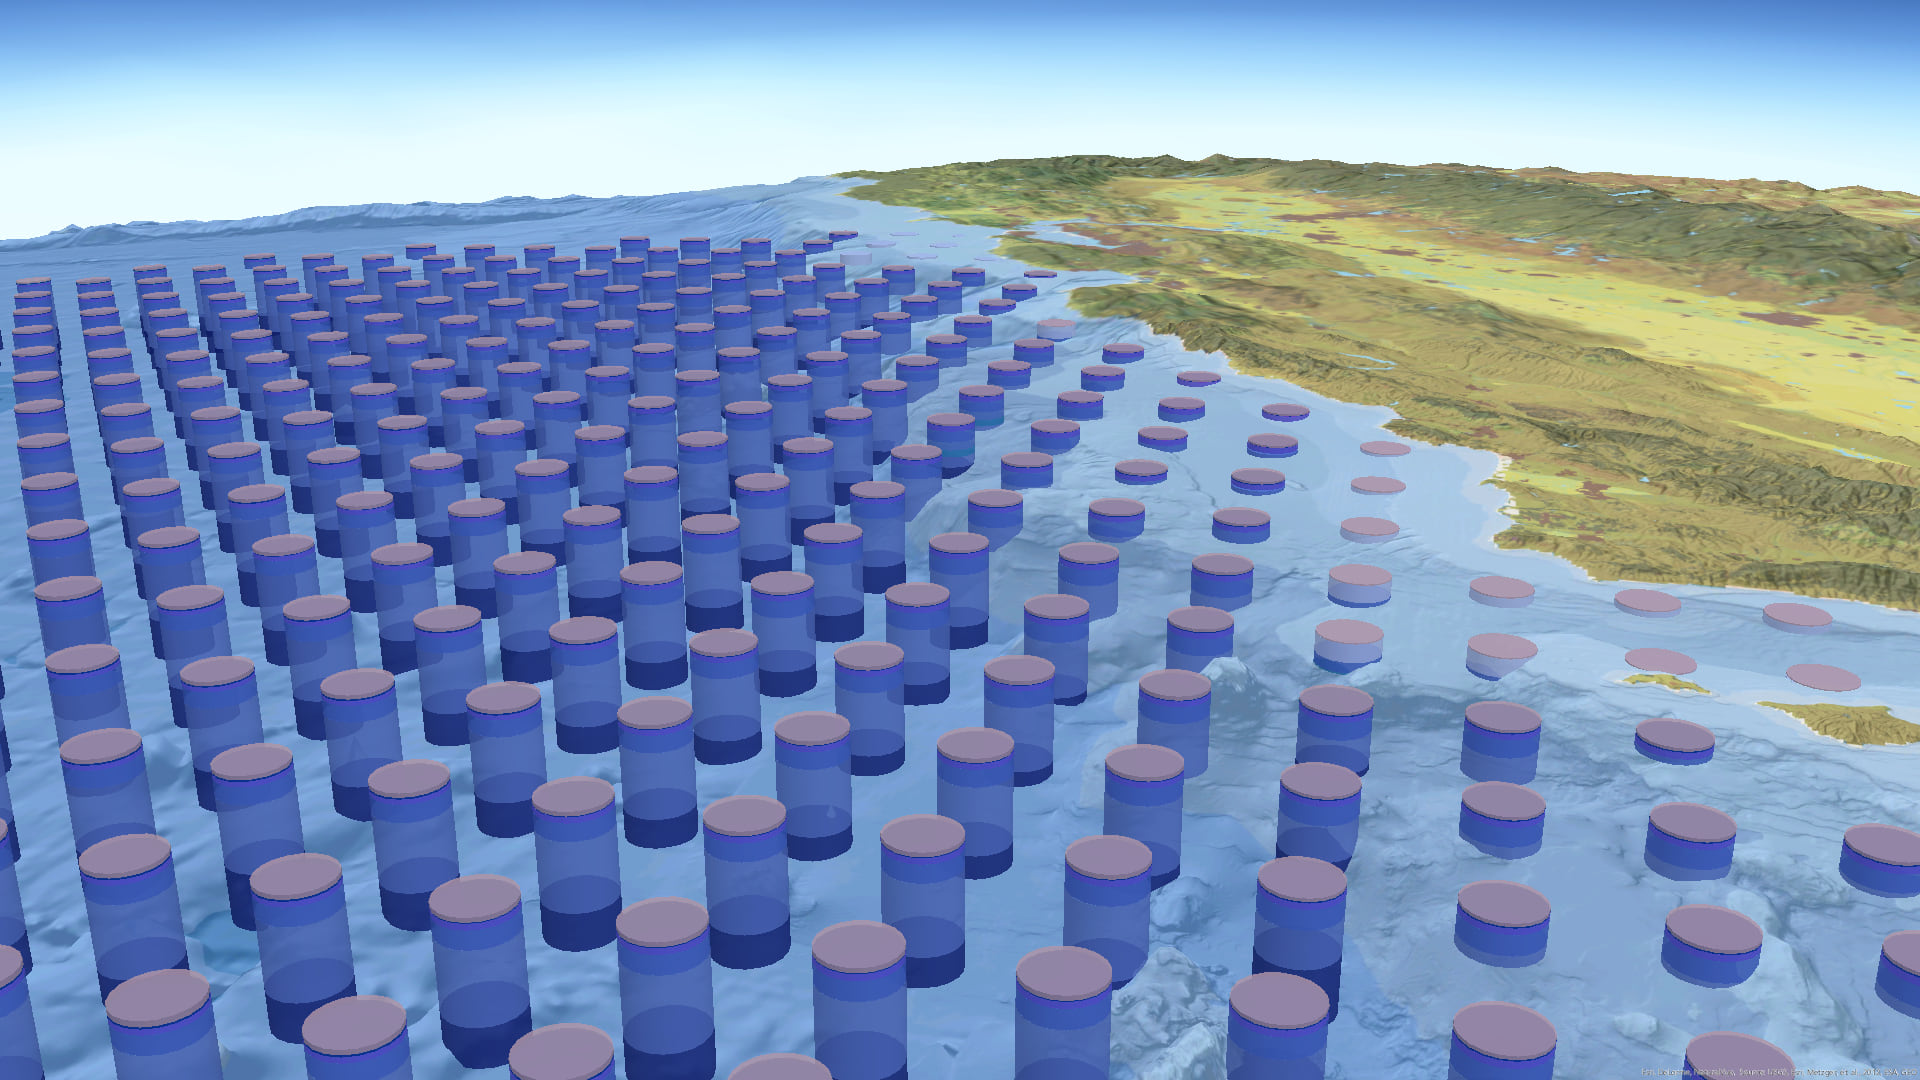
Ecological Marine Units
Use the Ecological Marine Units to get a detailed, three-dimensional view of the ocean. See a breakdown of physical and chemical types at various depths within the ocean. Click here to find layers about the ocean and hydrology within Living Atlas. You can also build your own local ecological marine unit using this Pro Project.
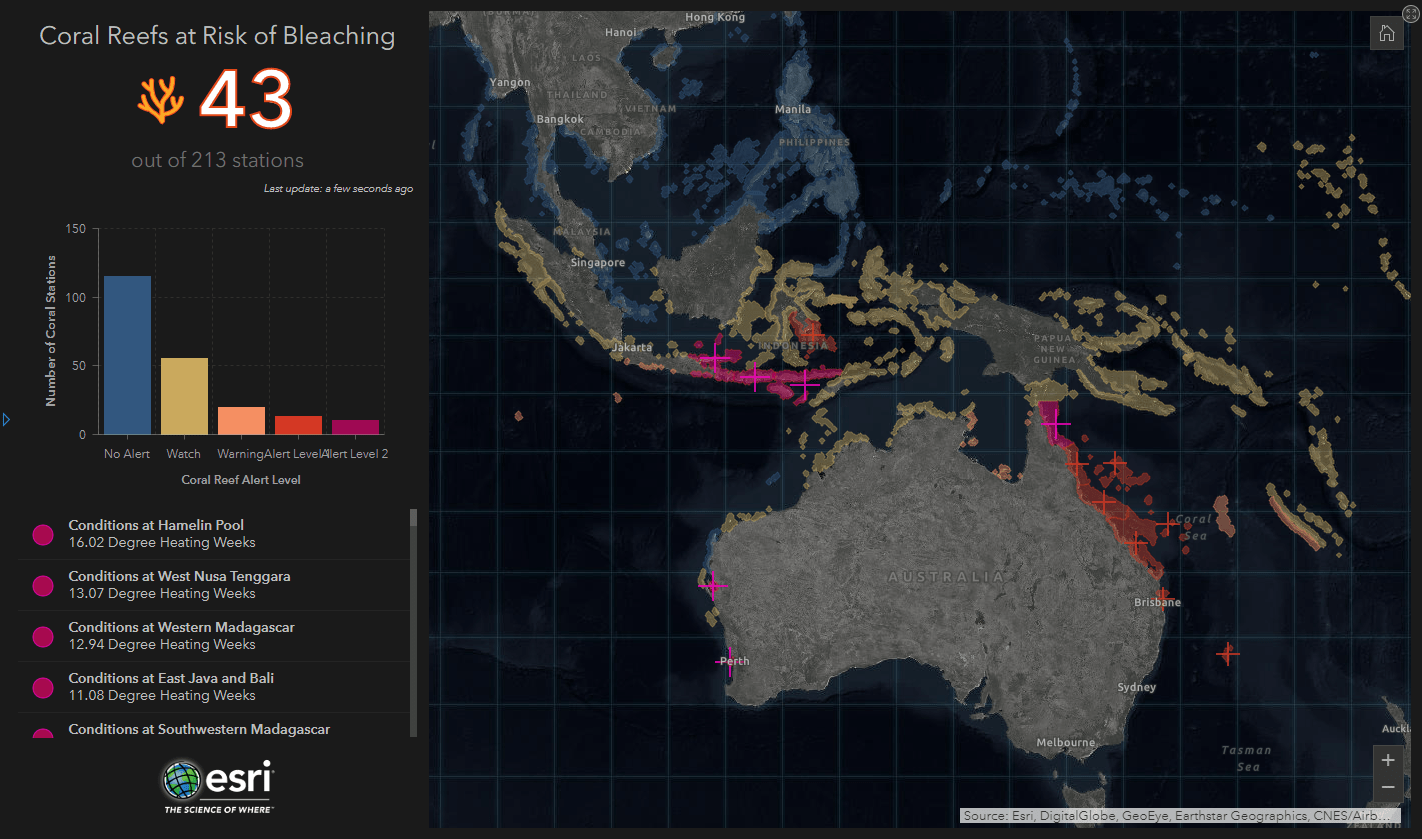
Coral Reef Bleaching
View real-time updates of coral reef bleaching with this powerful dashboard. To utilize the layers behind this app within your own maps and analyses, they can be found in Living Atlas.
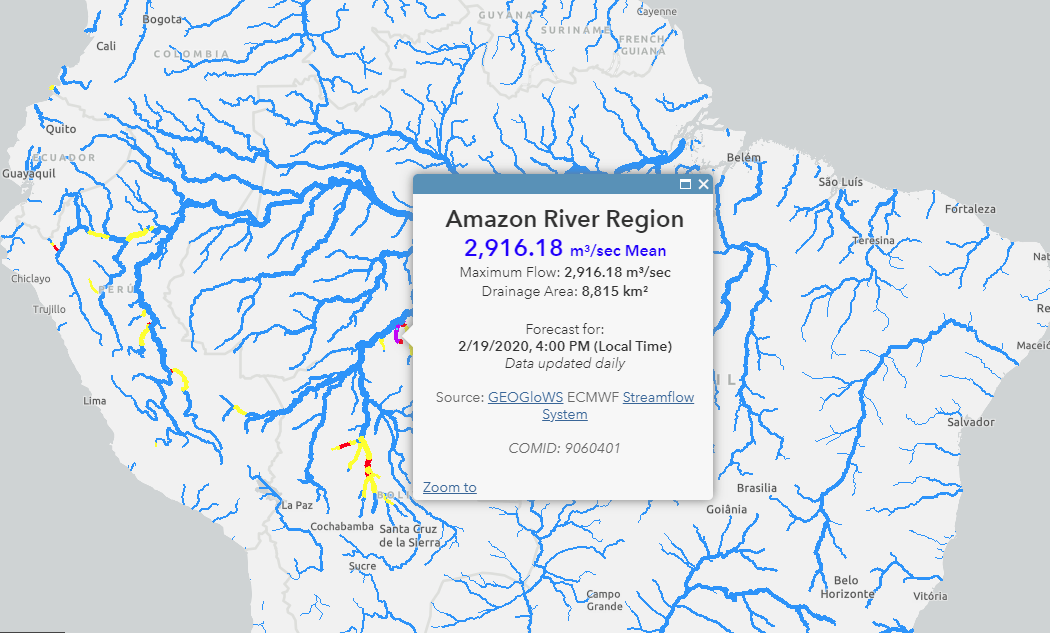
Global Flood Modeling for Rivers and Streams
This brand new flood forecast model was produced as part of the GEOGloWS Partnership with collaboration from BYU, ECMWF, esri, NOAA, NASA, SERVIR, USAID, ICIMOD, JRC, Copernicus, World Bank, and Microsoft Azure. This is a live feed global stream and river forecast for the world with a 6 day forecast, which can help identify flood risks around the world. Find the layer here.
Mapping Protected Areas
Find the new World Database of Protected Areas (WDPA) layers managed by the United Nations Environmental Program (UNEP). These detailed areas are updated each month with authoritative data from UNEP, and can be combined to identify biodiversity risks and opportunity within a given area. Click here to find the layers in Living Atlas or here to learn more about these layers.
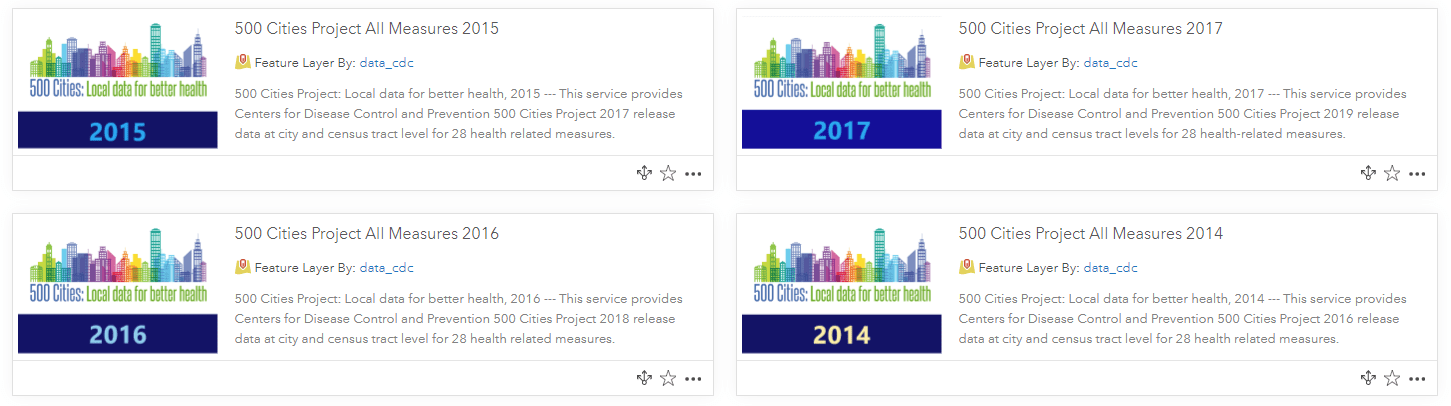
Centers for Disease Control and Prevention (CDC)
The CDC offers many different layers in Living Atlas to help promote a healthy population. These layers cover topics such as heart disease, social vulnerability, and so much more. The most recent contribution from CDC is multiple years of their 500 Cities data. These layers highlight 27 health indicators in the 500 most populated cities in the USA and can be customized to show these different indicators at different levels of geography. Click here to find CDC layers and maps in Living Atlas.
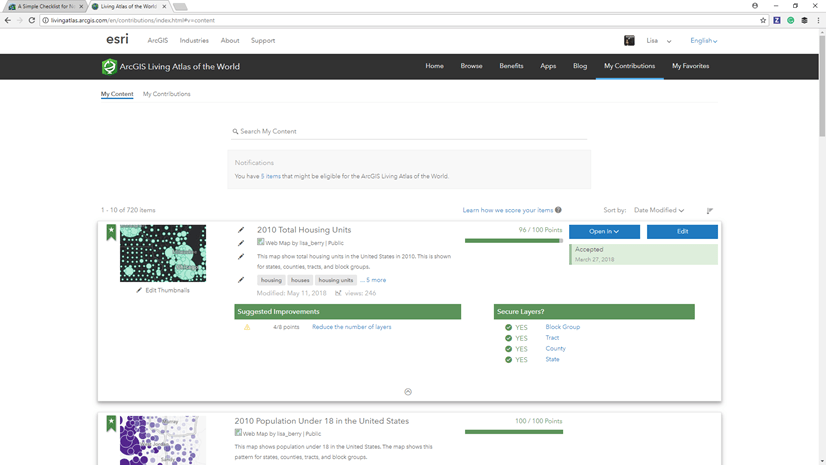
Contributing your content to ArcGIS Living Atlas of the World
Share your work with the global GIS community by nominating your layers, maps, and apps to Living Atlas. Not sure how to do this? Visit this StoryMap to learn how to prepare, nominate, and finalize your work into the largest collection of GIS content in the world.
Learn more
Get Started with ArcGIS Living Atlas of the World Learn lesson.
Follow along with this Learn path, showing different ways to find and use Living Atlas content.
Find more webinars like this by visiting the Spatial Data Webinar Series


Article Discussion: