Almost 20 years ago, my graduating cohort was dubbed “the class of the hurricane” from the university chancellor. After six storm impacts during our four-year tenure in Wilmington, NC, that title was well earned. That bullseye seemed to follow me around the Eastern Seaboard, with additional impacts from infamous storms like Katrina, Wilma, and Sandy.
Needless to say, over the years I became pretty well-versed in consuming and interpreting hurricane information, combing different websites to answer some basic questions:
- Is the storm going to hit here? If so, when?
- When will weather conditions start to deteriorate? If you’ve never put up hurricane shutters, which are essentially aluminum kites, you need to get them up before the winds start gusting.
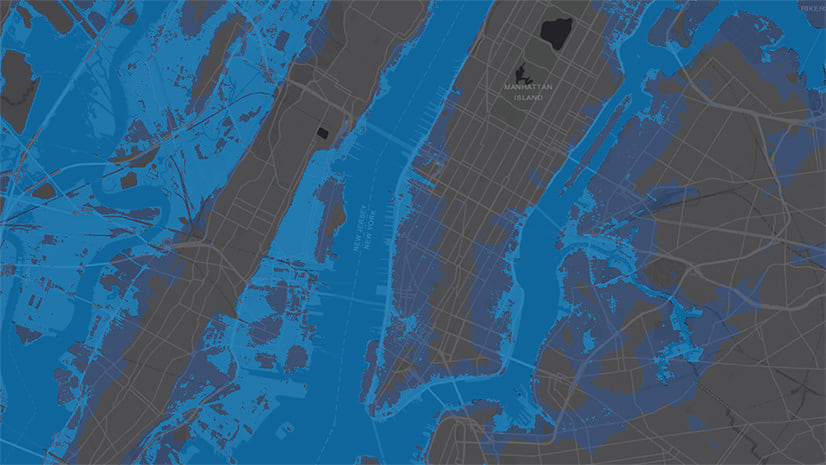
- Will I need to evacuate? If so which areas are outside the impact zone? Heading inland isn’t always the answer if heavy rains will cause flooding.
- Who else will be affected? Not only is this useful for emergency managers, but also people making personal evacuation decisions.
The Hurricane Aware Application
Luckily answering those questions is much easier now with the newly released Hurricane Aware app from ArcGIS Living Atlas of the World.

Is the storm going to hit here? If so, when?
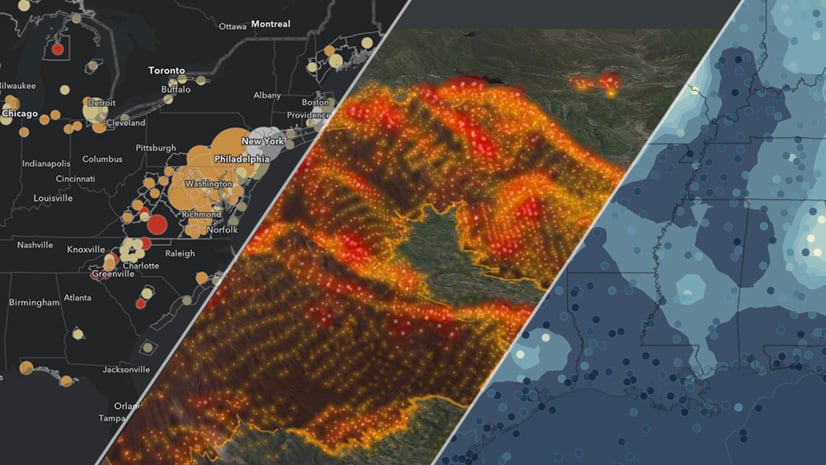
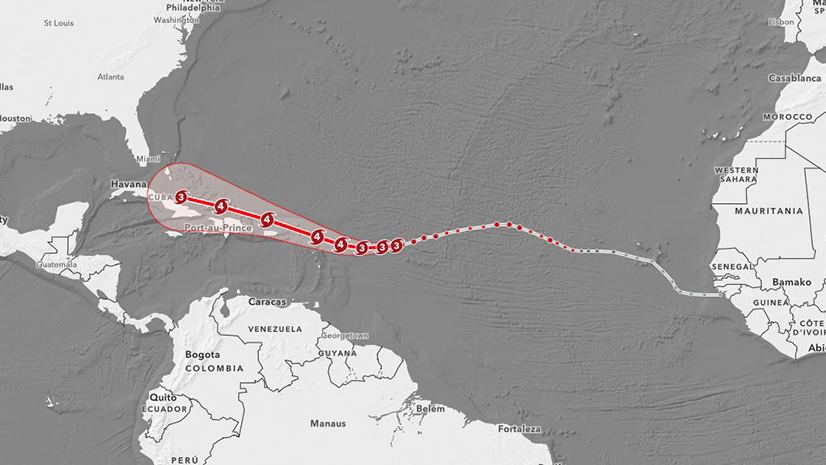
Leveraging the Active Hurricanes layer from Living Atlas, Hurricane Aware provides the most recent forecast information for all hurricanes, cyclones, and typhoons around the world from the National Hurricane Center and Joint Typhoon Warning Center. The app will also automatically check and display the latest forecast – no need to refresh the browser. The forecast intensity is provided as a read-out display for each 12-hr increment, with interactive display between the map and dashboard. Additional information can be accessed by clicking on the observed and forecast locations in the map to reveal a popup.

When will weather conditions start to deteriorate?
By selecting any location on the map within the contiguous United States (i.e., the lower 48), you’ll activate the localized impact analysis. Two graphs will appear: precipitation and wind gust. These pull local information from the National Weather Service NDFD Precipitation and Wind Gust layers in Living Atlas. The precipitation graph displays both the total for each 6-hr period (bar) and accumulated precip over 72-hrs (line). And while hurricanes are classified on 1-min sustained winds, it’s the earlier arriving gusts that can make driving and preparing your property dangerous

Where is a safer place to evacuate?
Since the app provides forecasts for the entire contiguous U.S., use it to understand how areas far outside the cone may be affected. Remember, the cone represents the possible centerline track of the storm, not the total area of impact. Keep in mind that the weather information in the app only extends 72-hours into the future, so please consult the National Weather Service for longer range information.
Who else will be affected?
The human component is where Hurricane Aware stands out from many other tracking apps – it provides demographic information for each localized impact analysis. Included are what we considered to be some of the most important vulnerable population stats, including:
- Total population
- Population % by age (under 18, 18-64, 65+)
- Percent with a vehicle
- Percent with a disability
- Percent that speaks English vs another language
- Percent with a cell phone
- Percent with internet access
Each of these stats and visualizations are summarized within a Census tract area (like a neighborhood) and are calculated from the latest American Community Survey demographic analysis in ArcGIS.

Additional Hurricane Resources
The Active Hurricanes, Precipitation and Wind Gust layers in Living Atlas are part of the Live Feeds collection of near-real time maps and layers. Recently many of these layers were upgraded – please check your maps and apps to make sure you’re using the latest version. Additional resources are available from the Esri Disaster Response Program.
The app was developed by Jinnan Zhang using the ArcGIS API for Javascript, and the source code can be downloaded from Github if you’re interested in making customizations. Cartography was developed by Emily Meriam, who has other really useful web maps, apps, and blogs for developing hurricane maps.
For questions or comments about this blog or the app, please visit our GeoNet.


Commenting is not enabled for this article.