When I hear about wildfires, the first thing I want to do is look at a map and explore the immediate area around the fire. So many questions go through my head. When you learn about a wildfire, what questions come to mind?
- Where is the fire and how big is it?
- Have there been fires in this area in the past?
- What is the weather like where the fire is located?
- Are there people or towns nearby?
- What ecosystem and vegetation types are in the area?
- What is the potential environmental impact?
Traditionally I’ve had to go to different places to find answers to questions such as these. Now by using the newest of Esri’s Aware apps, the Wildfire Aware application, I can find these answers and many more.

There are many unique aspects to this app, here are some of my favorites:
Symbolized by number of personnel assigned
Fires are often symbolized by acres or other attributes. We decided to turn the focus on the number of personnel because that indicates how many resources are being dedicated to that incident. As the number of personnel decreases it often indicates a lessoning of severity thus fewer resources are needed for suppression activities.
In addition to sorting by Personnel, you can change the way fires in your current view are listed by selecting the options of Date, Name or Size. You can also filter the fires in the list by zooming in using shift and drawing a box around the area to explore more closely.

Combined information
There are 22 data layers in Wildfire Aware from authoritative sources in Esri’s ArcGIS Living Atlas of the World. The combined presence of these layers enable me to learn about a fire and its surrounding area. The links to these individual layers can be found in the about window accessed at the top-right of the application.

Information Pane
Most of the questions asked at the start can be answered in the pane of information. Upon selecting a fire the map zooms in and displays the acres, weather, population and ecological information.

These results are based off of the area covered by the fire perimeter. If there is no perimeter or you have clicked on another place on the map you will see a circle with a 2 mile radius which generates the results provided.

Map Layers & Basemap
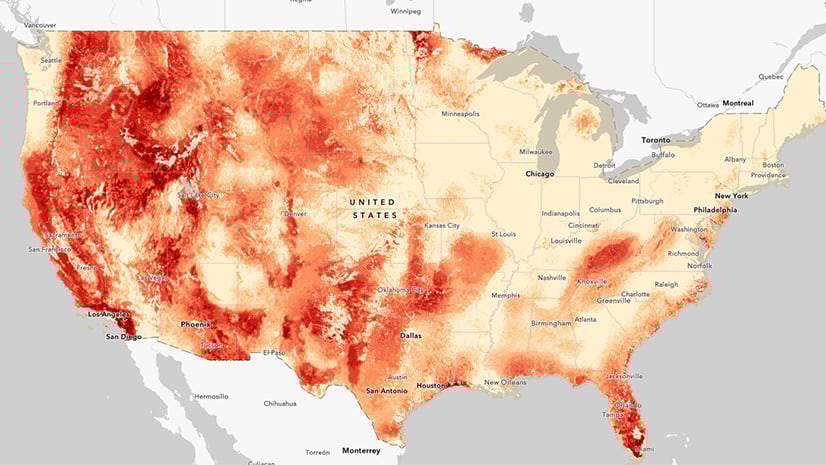
Use the Map Layers list at the bottom left for visual information not included in the information pane. Each layer is available to turn on based on ‘zoom level’ to provide visual contact to the fire area. Viewing areas burned by previous fires or zooming in closer to view population based on Census blocks both add more context to the immediate area. Upon Reset and Close, the changes made to the layers are reset but the map will stay focused on your selected fire.

These layers shown below include satellite hot spots which indicate current fire activity, burned areas displaying past fires, air quality conditions, and population based on 2020 Census block areas.

Beneath it all is a custom basemap highlighting map features that are especially important for situational awareness during wildfires. These features become visible as you zoom in. Drainages, topographic features, elevation points, public lands and protected areas were all styled in a way that the viewer can quickly understand the land around the fire. Each zoom level displays certain elements to aid in telling the story of the area.

Enjoy Exploring & Share The App
Share this with others using the URL which will store the current fire selected or extent of the map. Submit comments on the content item page.
For more information on Esri’s support for wildfires please visit our Wildland Fire webpage and our Disaster Response Program (DRP).
The app was developed by Calvin Manning using the ArcGIS API for Javascript, and the source code can be downloaded from Github. Cartography was developed by Emily Meriam, whose background in Wildland Fire prior to coming to Esri was critical for her work on this application. Explore other topics in the Aware series including droughts, air quality, sea ice, and hurricanes.
We hope you enjoy exploring the Wildfire Aware application!


Commenting is not enabled for this article.