The global streamflow service has just been updated with new modeling, new cartography, and is now wrapped into a web map with a custom basemap designed specifically for use with this layer.
Streamflow Modeling
Over the past 5 years, Esri has been collaborating with Brigham Young University (BYU), the European Center for Medium Range Weather Forecasting (ECMWF), the GEO Global Water Sustainability (GEOGloWS) program and others on a vision to provide global streamflow forecasts and historic flow through easy-to-use web maps. The earlier prototype has now evolved from the research environment at BYU into an operational system hosted at ECMWF, the authoritative provider of the daily forecast. This upgrade will ensure reliability and continued availability of this valuable data.
In addition to the move to ECMWF, the services are updated with symbology based on the ECMWF ERA5 data, which provides a 40 year historic record for computing the return periods. The return period is how frequently a streamflow, or potentially a flood, of that magnitude could be expected, based upon the 40 year record available. The return period provides an easy way to recognize in the map or graph how high the flow is relative to normal and historic flow.
 coming on November 19th as hurricane Iota leaves Honduras.")
The GEOGloWS ECMWF Streamflow system site provides additional information about the analysis methodology, REST API, integrated map-graph interface, and source code.
These services were recently instrumental in Latin America when they were struck by two category 4 hurricanes, Eta and Iota, only two weeks apart.

After Hurricane Eta, the Central American disaster organization (CEPREDENAC) used the service to improve their situational awareness, to know how much water was in the rivers at the time and how much water would be in the rivers each day as the next storm, hurricane Iota, approached and then moved through the region.
Cartography in Alignment with Industry Standards
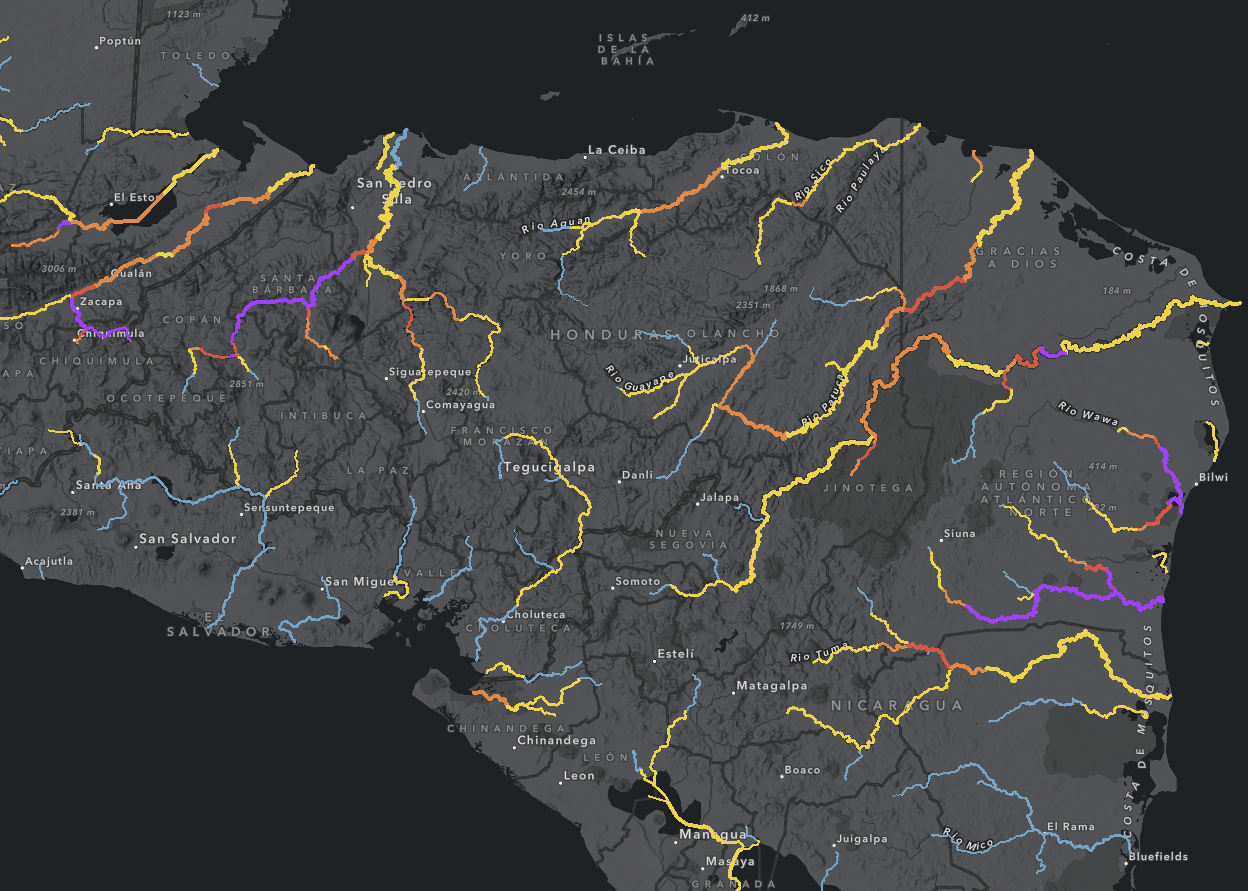
There is a precedent pattern already in place from NOAA and GloFAS for progression of colors from low (yellow) to high flood risk (purple).

In order to stay in sync with the palette that‘s already been in place, similar colors were selected and designed to increase in saturation as you moved from ‘Normal’ to ‘Exceeds 50 Year’ flow return. The width of the lines is representative of the amount of water in each stream reach at each time step of the forecast.

They also work on both dark and light basemaps and are color blind friendly.

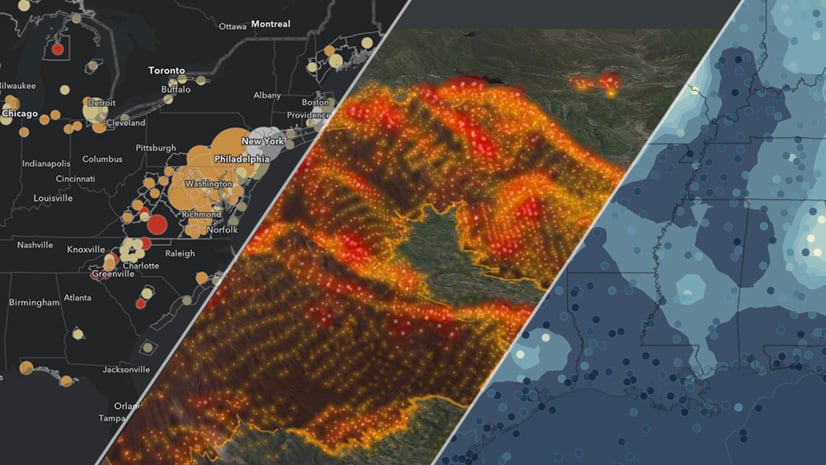
This layer is also offered within a web map that contains two customized vector tile basemaps created from the World Terrain Reference Local Language and Dark Gray Canvas Base, two of Esri’s signature basemaps. The basemap layers were customized with Esri’s Vector Style Editor which allows users to make custom modifications to these maps and then save them to their own organizations and share publicly.

This map was designed specifically for the GEOGloWS ECMWF Streamflow System. You will find that stream name labels are featured more prominently at all map scales. Additionally, global topographic features are also more noticeable and are shown with a reference layer that’s in the local language for some areas (streets, businesses, points of interest, etc.). By design there is an absence of color on the basemap (using the Dark Gray Canvas) so that the only color values on the map are the actual water line features. Transparency has also been set on the base layer to leverage the World Hillshade Dark, further accentuating the headwater areas. This results in a simple and beautiful surface water centric map, where streams with higher than normal flow values pop off the screen and get noticed.
Next Steps
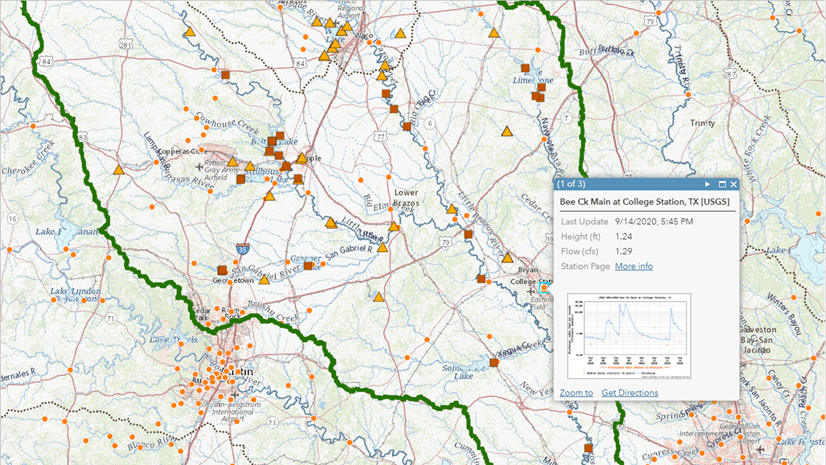
To make these services even more useful, we are developing a graph widget to show the forecast and historic flow information, like that shown above from the GEOGloWS ECMWF site. The graph widget will be part of a configurable web app template to make it easy for countries and regional authorities to deploy customized streamflow applications.
Project Collaborators
A big thanks to the diverse team of project collaborators from academia, government, industry, and NGOs who helped evolve this idea from a research vision to an openly available operational service.


Article Discussion: