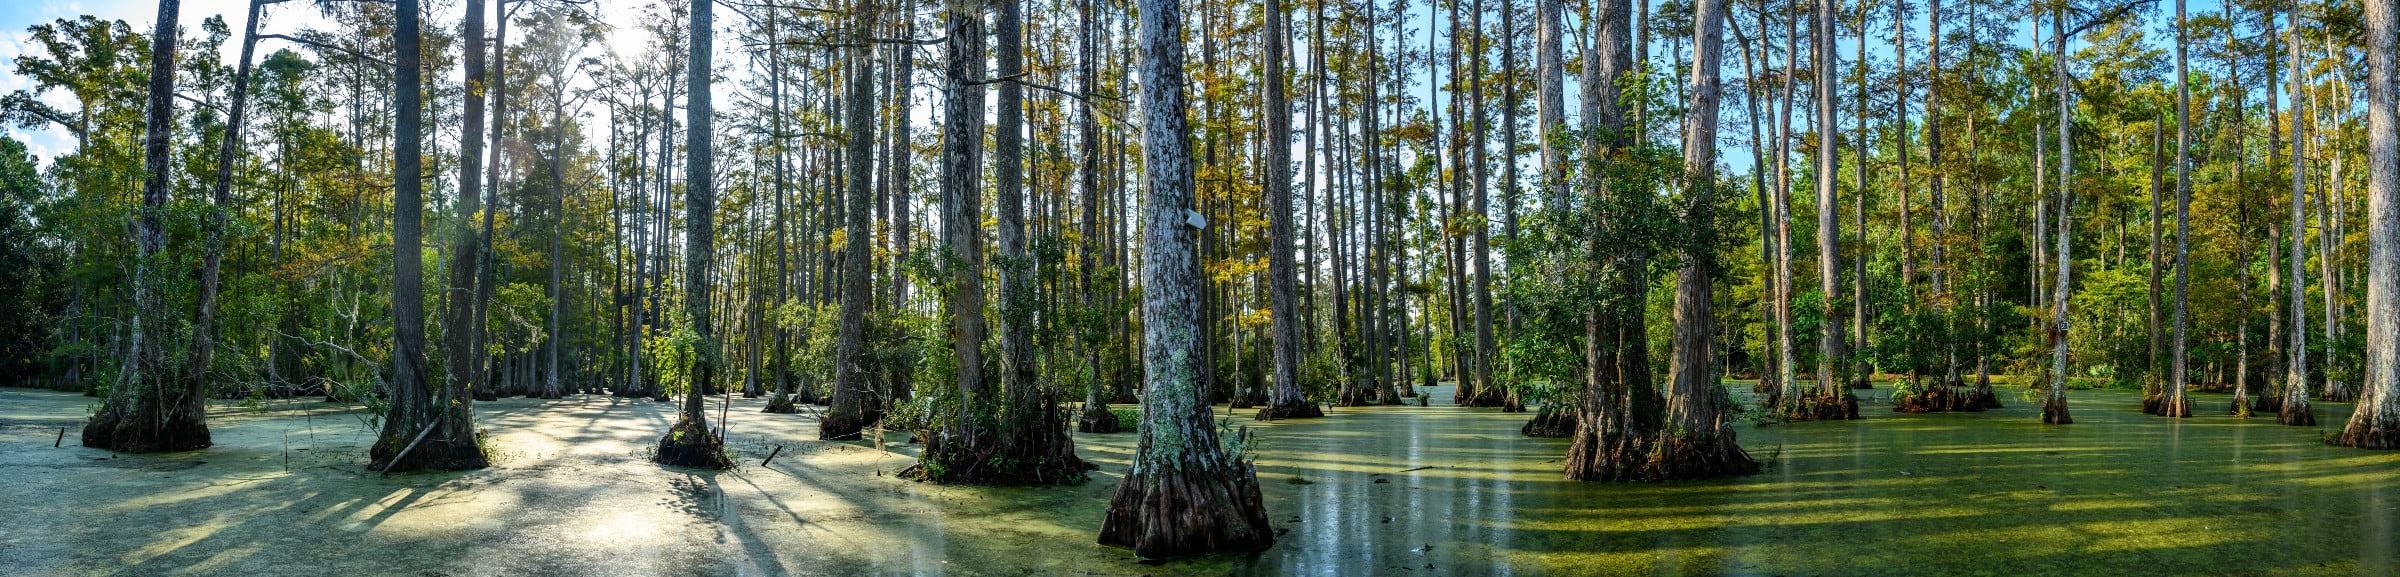
Wetlands provide valuable ecosystem services that benefit people and wildlife. Wetlands filter pollutants and nutrients improving water quality, act as sponges absorbing flood waters and releasing it in the dry season, and their complex physical habitats provide outstanding habitat for many species of fish and wildlife.
In North America, considerable areas of wetlands have been lost. The U.S. Fish and Wildlife Service estimated that more than half of all the wetlands in the contiguous 48 United States were lost between the 1780s the 1980s. Between the mid-1950s and 1970s an area twice the size of New Jersey was destroyed. As the tremendous loss and impacts were better understood, action was taken to stop the development of wetlands.
The long and complicated history of wetland regulations in the United States is far too much for a blog, but an important piece is that Section 404 of the Clean Water Act requires a permit from the Army Corps of Engineers to discharge dredged or fill material into waters of the United States including wetlands. Other laws and policies protect wetlands as well.
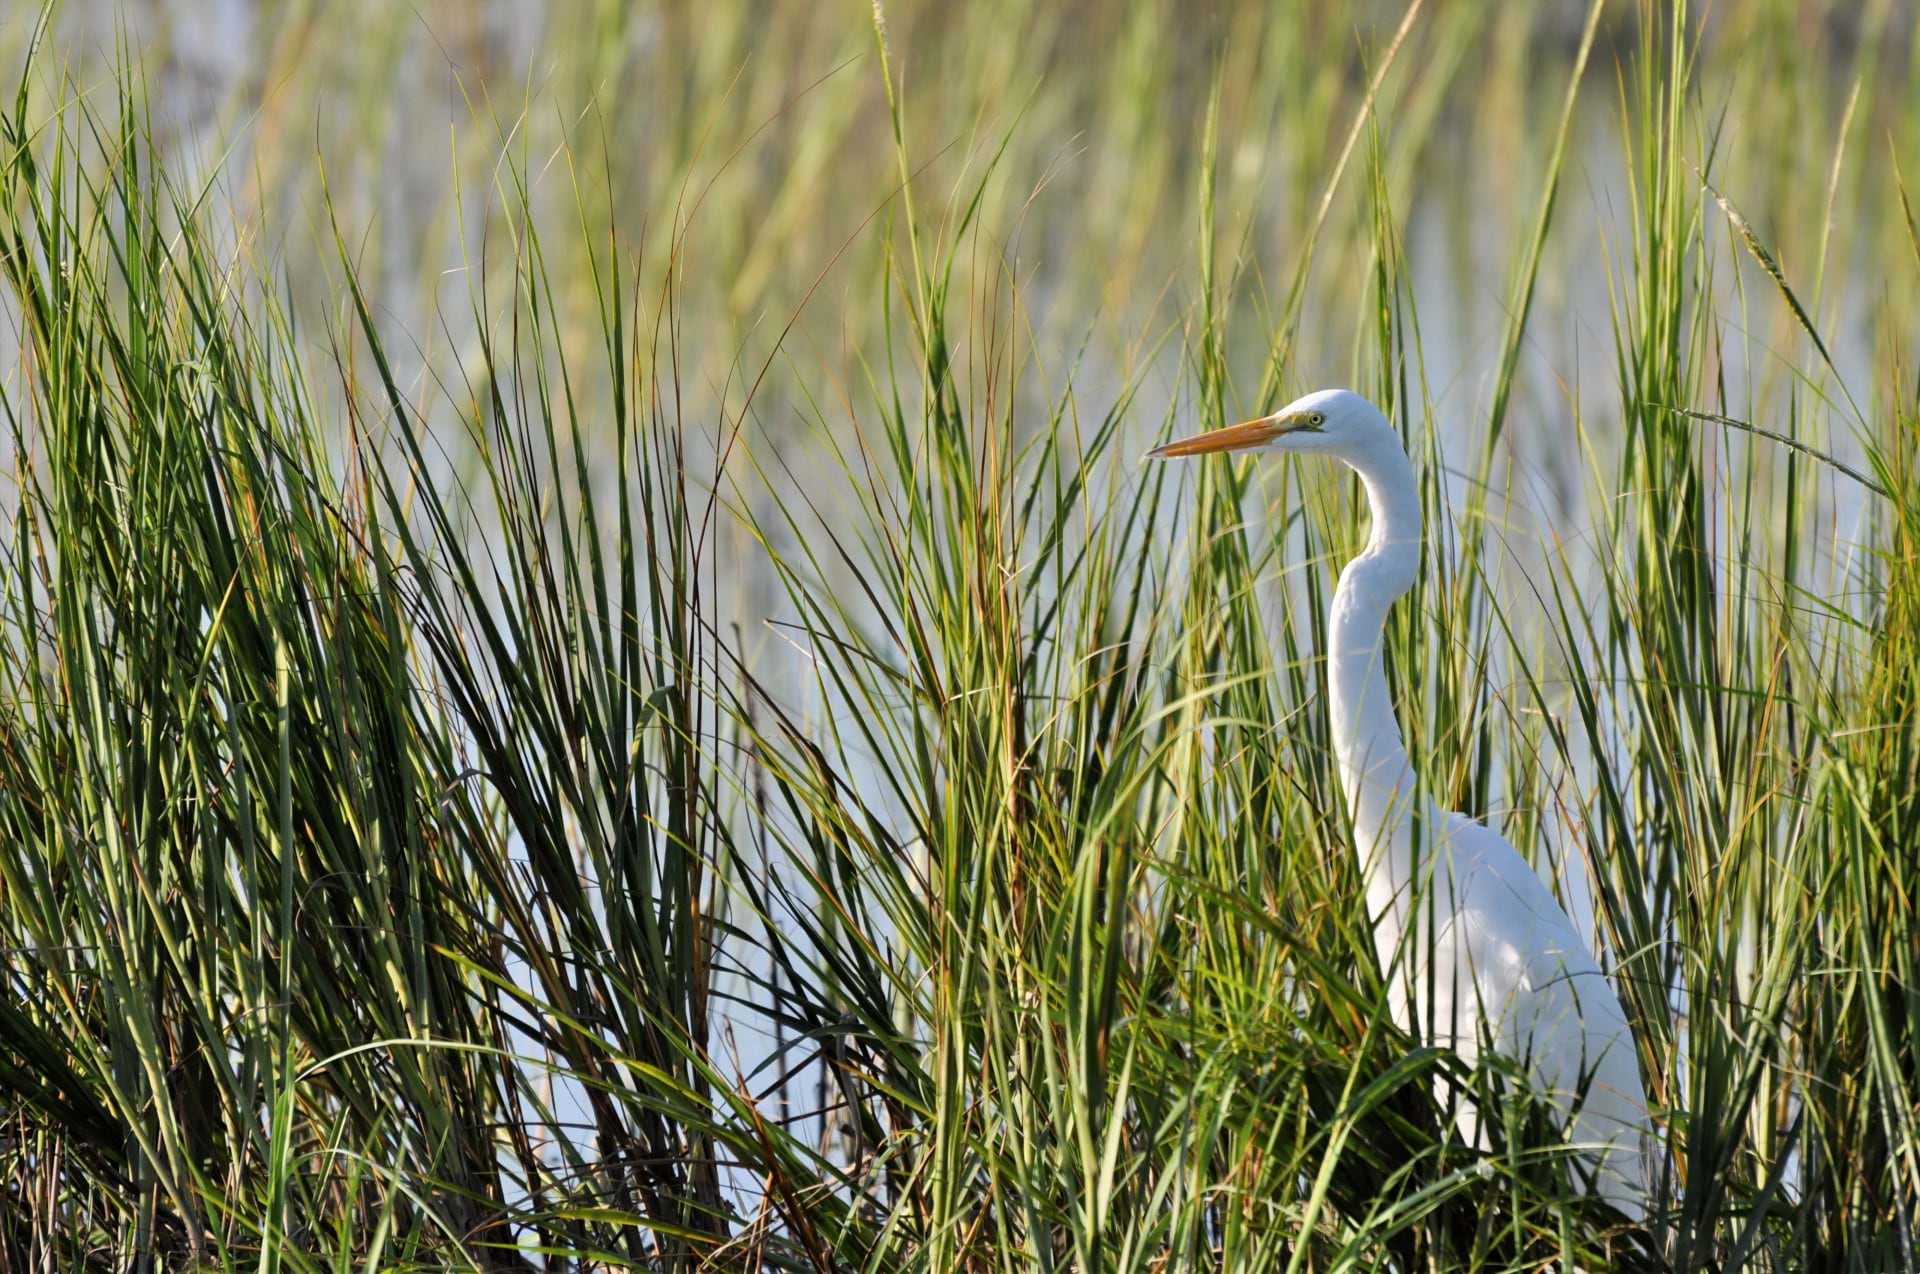
Wetlands provide important habitat for a wide variety of fish and wildlife. Protecting and maintaining wetlands helps these species thrive.
GIS plays a key role in identifying and mapping wetlands, in implementing regulatory and permitting processes, and monitoring the status and trends in the distribution, type, and health of wetlands.
The U.S. Fish and Wildlife Service produces an authoritative dataset, the National Wetlands Inventory, that maps the wetlands of the United States. To make your work easier, we have published a feature layer built from this dataset and made it available in ArcGIS Living Atlas. We also produce an imagery layer based on these data for analysis-heavy projects or where the map will be viewed at smaller scales.
The new USA Wetlands feature layer provides a comprehensive view of over 35 million wetlands across the United States. Zoom in and click the map to see a rich pop-up that describes each wetland.
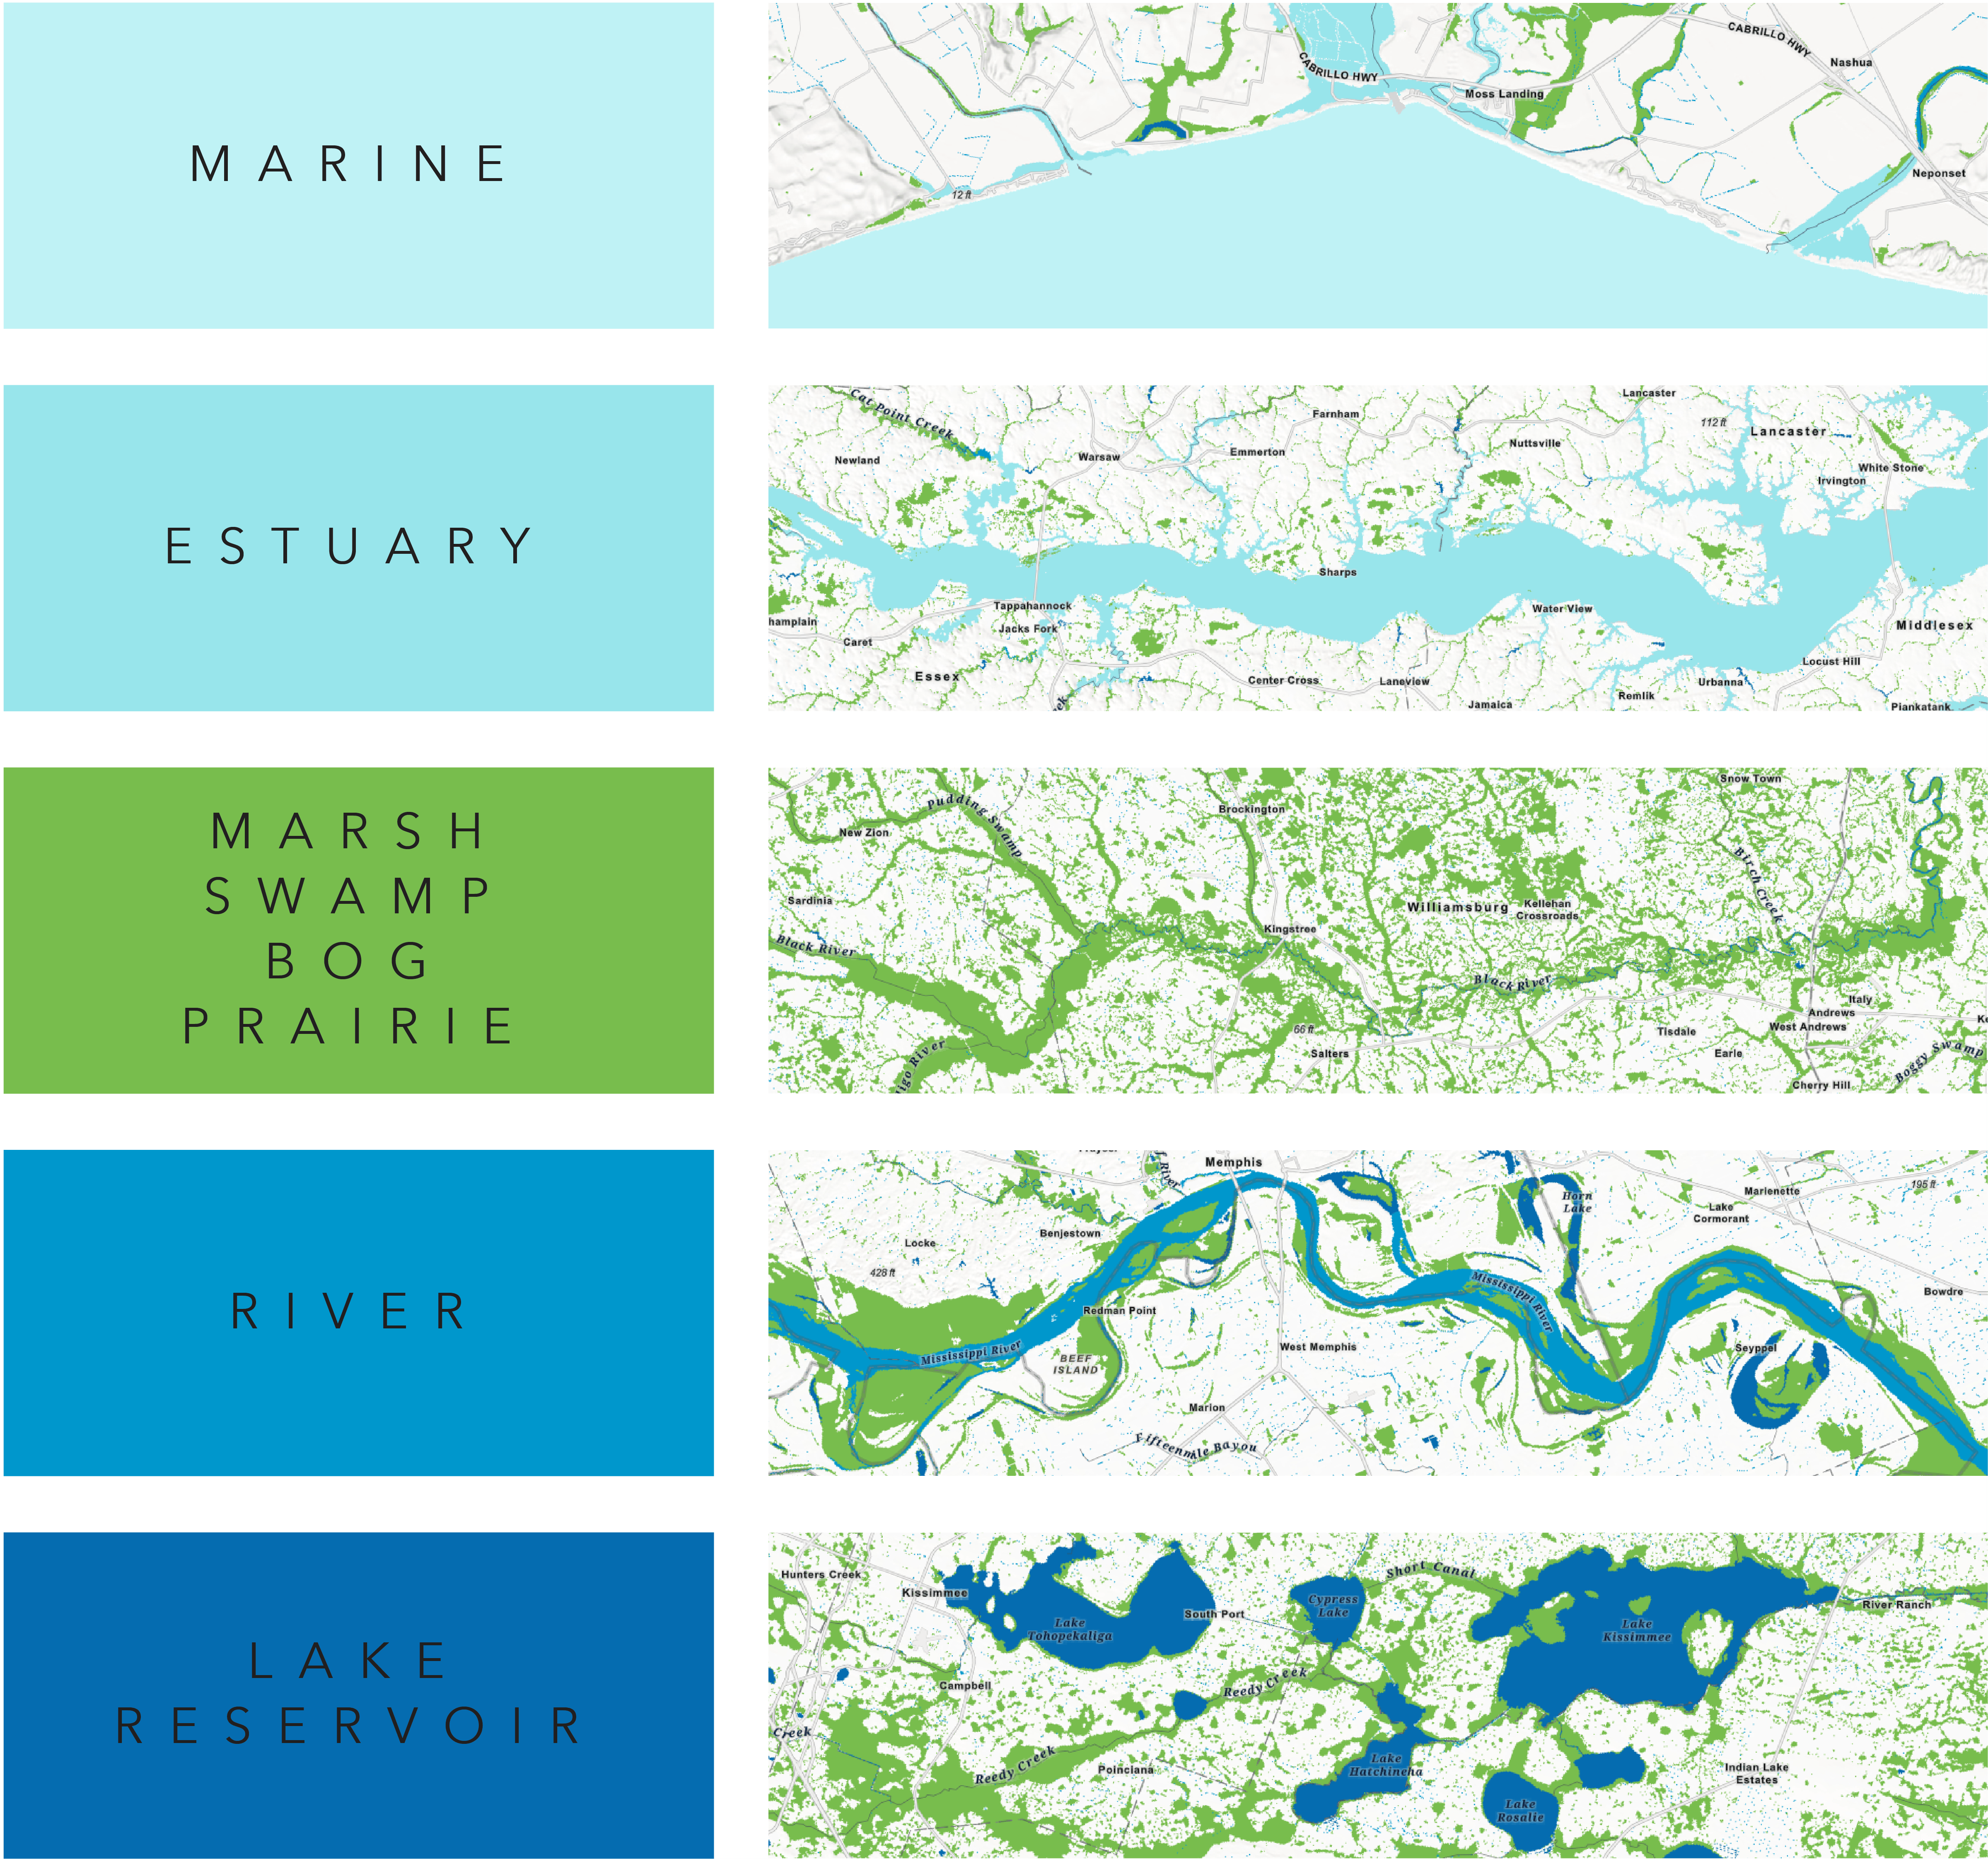
New Symbology
For this release we updated our symbology with vibrant new colors. The new symbology creates a visual hierarchy with a sequential multi-hued palette that’s designed to give the most emphasis to the land based features. Marine and Estuary along the coasts were styled as supporting light blue colors that meet a bright green Wetlands category that pops out and commands your attention. Next in line, completing the cycle from land to sea, are saturated darker blue hues for rivers and lakes.
Rich Attributes
The National Wetlands Inventory comes with a rich collection of attributes that allow you to query and filter the layer. We have extended these attributes with a related table that contains formatted text strings used to power a pop-up. Take some time to explore the attribute table to see what is available.
To learn more about how wetlands are classified, see the document Classification of Wetlands and Deepwater Habitats of the United States and the US Fish and Wildlife Service’s Wetland Data webpage.
ArcGIS Living Atlas Layers Work Together
Combining Living Atlas layers is a quick and easy way to build understanding of the world around us. In this example, we combined the wetlands layer with a county layer from Living Atlas and used it to extract the wetlands from the coastal counties of South Carolina.
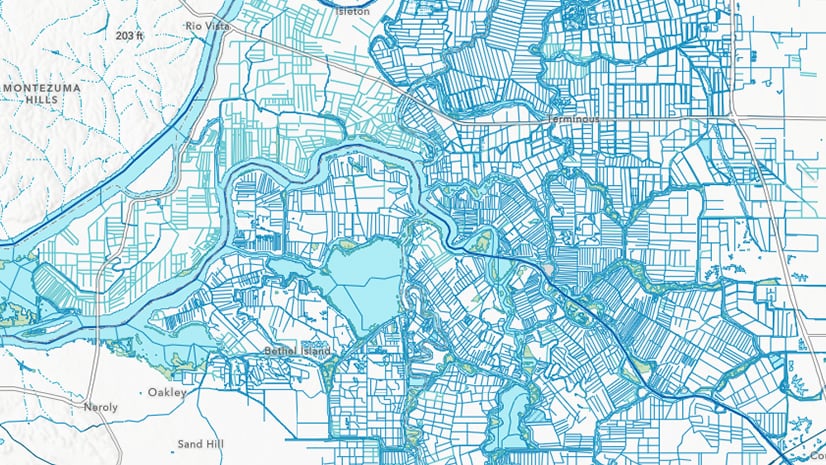
Because loss of fresh water wetlands is a major concern in areas threatened by sea level rise, we overlayed the wetlands with a sea level rise layer from Living Atlas and created this map that gives the viewer a sense of the extent of wetlands at risk. This is a great example of how you can create new and interesting maps in just minutes with Living Atlas.
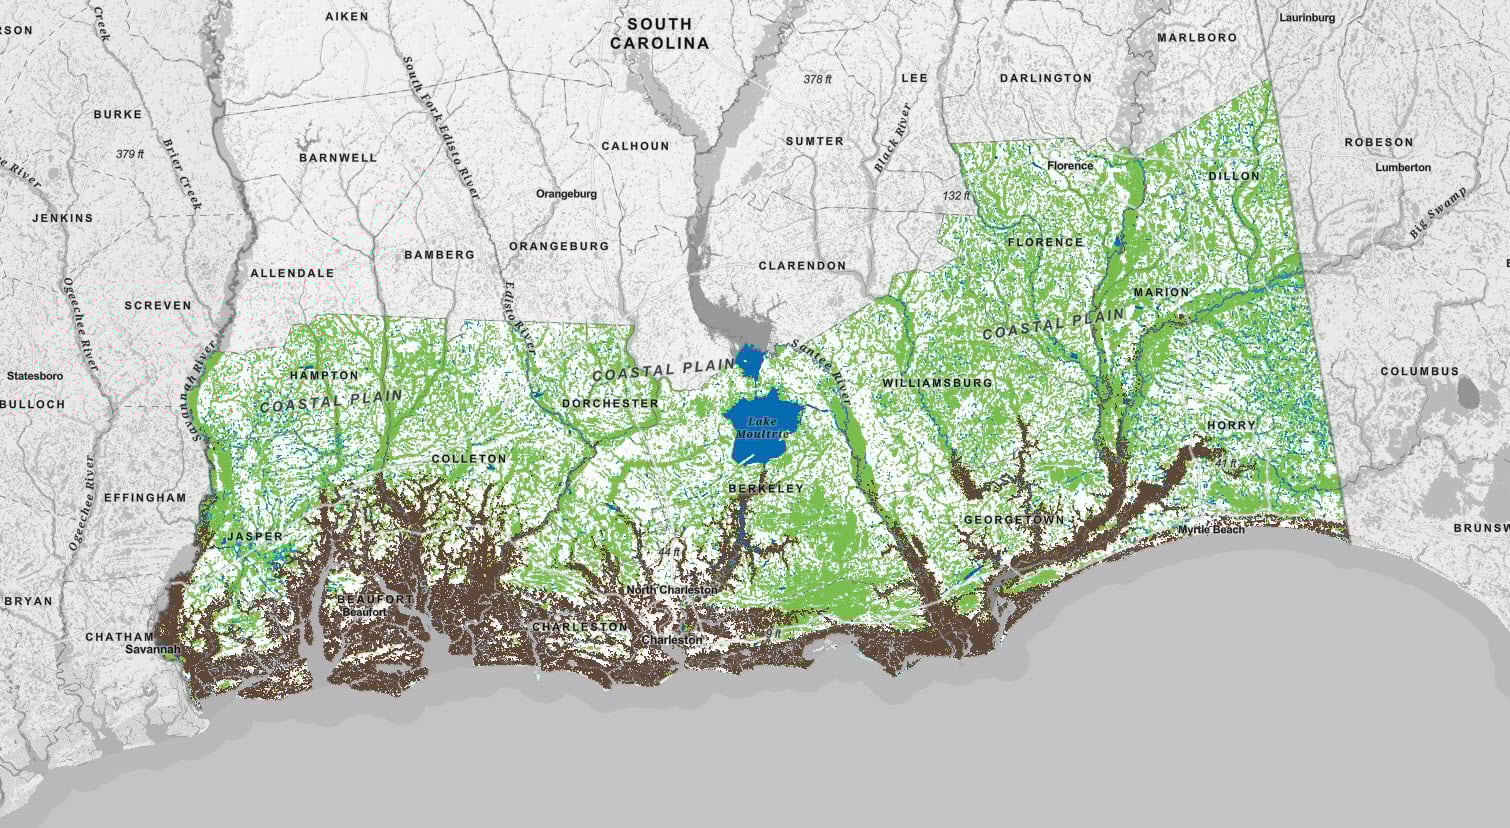
Wetlands potentially threatened by sea level rise in coastal South Carolina are shown in brown on this map. Wetlands in green and blue are outside of the areas considered threatened by the 2090 Sea Level Risk Projection map.
Use Living Atlas Layers to Create Apps
ArcGIS Instant Apps provide a variety of easy-to-use applications. Just add a webmap and configure. In this example, we selected wetlands of South Carolina using the counties layer and published a new hosted layer. We created a second new layer selecting only wetlands that are protected (Gap Status 1 and 2) in the USA Protected Areas layer from Living Atlas. We used the Media App to create the swipe effect.
Swipe the map to compare all wetlands in South Carolina with wetlands in protected areas. Protected Areas Database of the United States is published by the USGS and available in ArcGIS Living Atlas.
Analysis Made Easy
With Living Atlas, we can ask fundamental questions about our world. For example, many conservation advocates have suggested a plan of protecting 30% of our lands and waters by 2030. These efforts have gained prominence with the President’s 2021 Executive order and subsequent America the Beautiful Report. We can do a simple analysis looking at the proportion of wetlands currently protected and summarize by county to see how close South Carolina is to meeting this 30 by 30 goal for wetlands at the county scale.
In South Carolina, only three counties, Richland, Georgetown, and Charleston, have more than 30% of their wetlands protected. You could use our analysis results to help identify other wetlands in the state ripe for protection in order to meet the 30% goal.
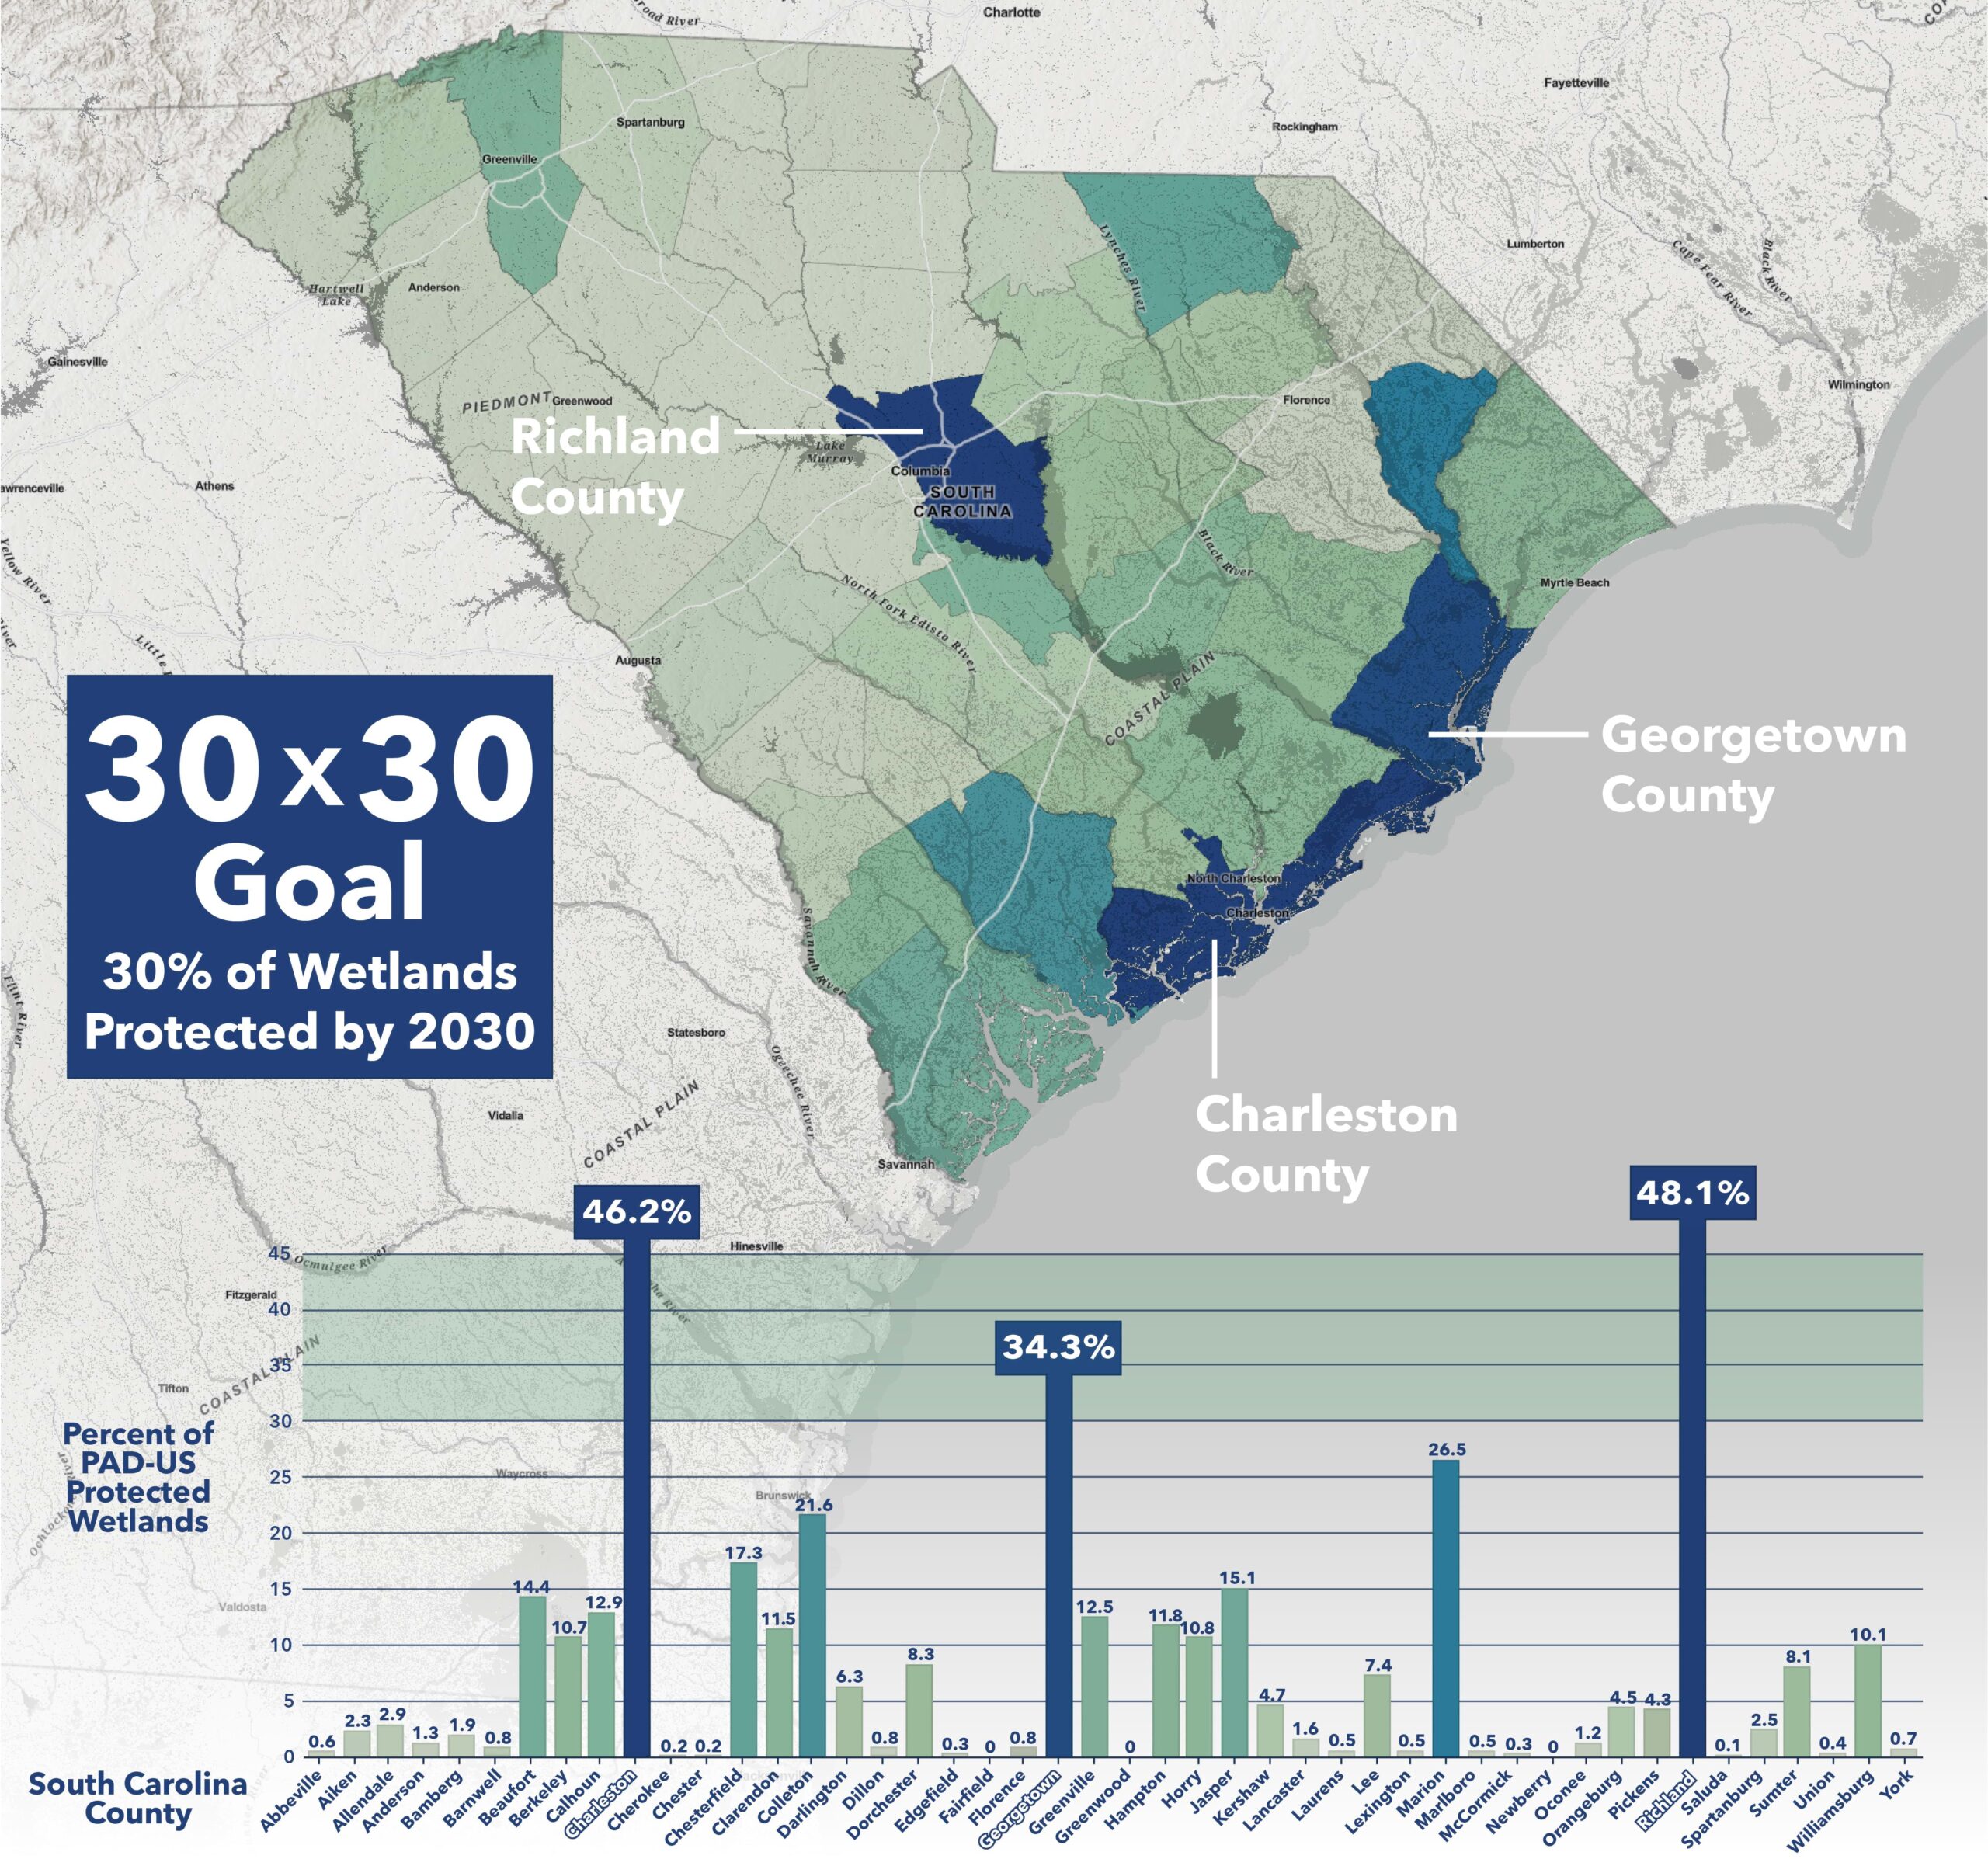
ArcGIS Living Atlas enables you to combine layers and create new information, reveal patterns, and gain understanding. We created this simple analysis summarizing the proportion of wetlands in each county of South Carolina that are in protected areas.
We hope you find our wetlands feature layer useful and encourage you to take the time to explore ArcGIS Living Atlas and discover the many useful layers that you can mix and match to create your own maps, apps, and analyses. Every layer used in this blog came from Living Atlas. Everything we needed was there and read to use. Incorporating Living Atlas into your work will go a long way to making your job easier.


Great insights!