ArcGIS Online lets you understand the world around you by using interactive maps to connect people, locations, and data. You get smart, data-driven styles and intuitive analysis tools that deliver location intelligence. ArcGIS Online gives you the ability to make maps and apps to share your insights with your organization or the world. You can use it as a complete, cloud-based solution or to extend and complement the capabilities of ArcGIS Pro and ArcGIS Enterprise.
Don’t have an ArcGIS account? See Create an ArcGIS Account.
The June 2023 update includes new functionality in Map Viewer, such as additional analysis tools and raster functions, plus other enhancements and new capabilities throughout the ArcGIS Online website. Highlights are provided below.
ArcGIS Online is updated three to four times each year. See the ArcGIS blogs to learn more about previous updates to ArcGIS Online and new functionality and enhancements you may have overlooked.
For more information and additional details about this release, see the What’s new help topic or view all posts related to this release.
Don’t have time to read the blog article? View the video below instead.

Quick links
Use the links below to jump to sections of interest.
- Map Viewer
- Analysis in Map Viewer
- Scene Viewer
- ArcGIS Instant Apps
- ArcGIS Dashboards
- ArcGIS Experience Builder
- Data management
- Data Pipelines (Beta)
- Accounts and administration

Map Viewer
Using Map Viewer, you can author, explore, edit, and share web maps. Administrators and members are encouraged to configure Map Viewer as their primary map viewer to take advantage of new capabilities and enhancements that are delivered with each update.
Here’s an overview of new features and enhancements to Map Viewer delivered in this update.
Edit related records
You can now add related records when configuring forms for attribute editing in Map Viewer. Related tables are displayed in the form (outlined in the green box shown below) and can be opened for editing, displaying the configured fields from the related table(s).
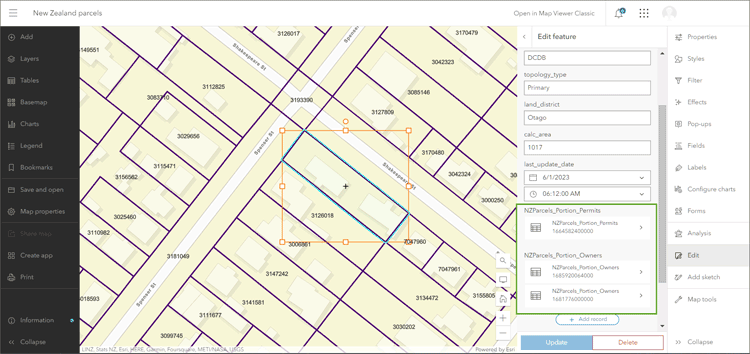
Using the form, attribute values for the related records can be updated and added as needed during feature editing.
For more information, see:
Improved add layer experience
From the Layers pane in Map Viewer, you can add layers from your content, favorites, groups, organization, ArcGIS Living Atlas, and anywhere else in the ArcGIS Online ecosystem. An improved browsing experience in Map Viewer offers more context and information about layers, basemaps, and other content, making it easier to learn more and make decisions about what you want add.
Click the item card to view the item overview, description, details, and layers. Click a layer to view its fields, expand a field to view its details and summary.
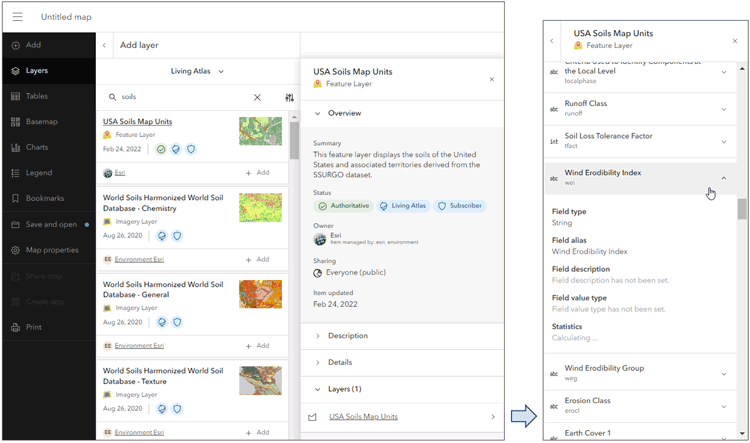
For more information, see Add layers to maps.
This new implementation is also available from other pages, such as item Search and Gallery, delivering a unified browse and search experience across ArcGIS Online.
Enhanced pop-ups
Layer pop-ups are an important part of crafting the complete map information experience. Pop-ups can transform an otherwise dull list of attributes into a far more meaningful display of intuitive and engaging information for your audience.
With this update, design enhancements have been made to the pop-up for an even better user experience. These include a redesigned feature pagination and menu button, an improved media pagination experience, and enhanced color ramps with matching tooltips for charts, along with improved chart interaction.
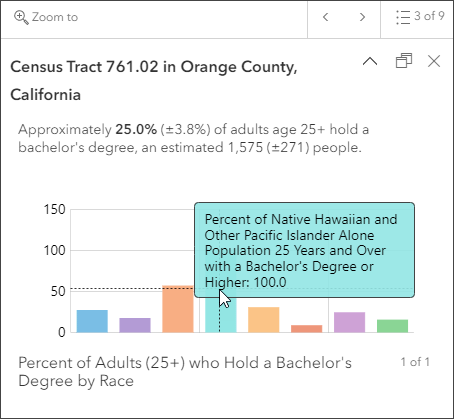
These improvements are transparent to the map author and are automatically applied, they do not require any modification to existing maps or layers to leverage. For more information, see A fresh look for pop-ups.
Add focus to group layers
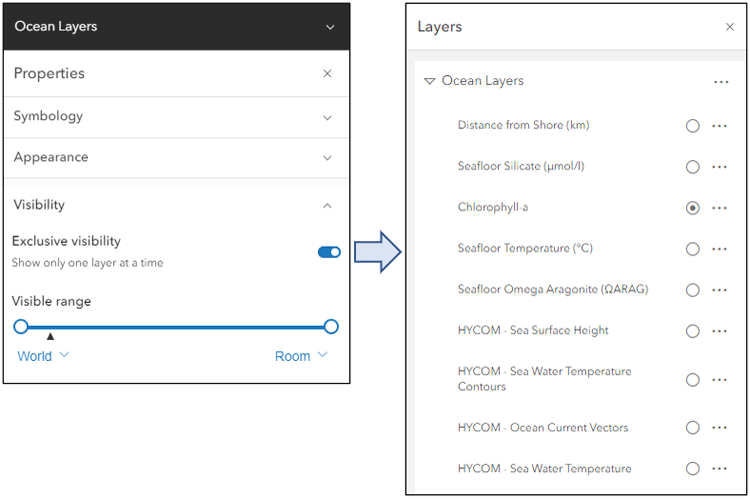
When working with group layers on a map, you can now display only one specific layer without having to hide each of the other layers. Exclusive visibility can be set in the Visibility section of the Properties pane for the group layer. In this mode, only the active layer you choose will be visible, so you can view individual layers while others remain hidden.
This is particularly useful when a group layer contains a large number of layers. For more information, see Create and manage group layers.
SVG symbol support
In addition to .gif, .jpg, and .png files, you can now upload Scalable Vector Graphics (.svg) images to use as symbols when styling your layer or creating a sketch in Map Viewer. SVG is a web-friendly format that stores images as vectors instead of pixels, so images can be scaled up or down as needed without blurriness or loss of resolution
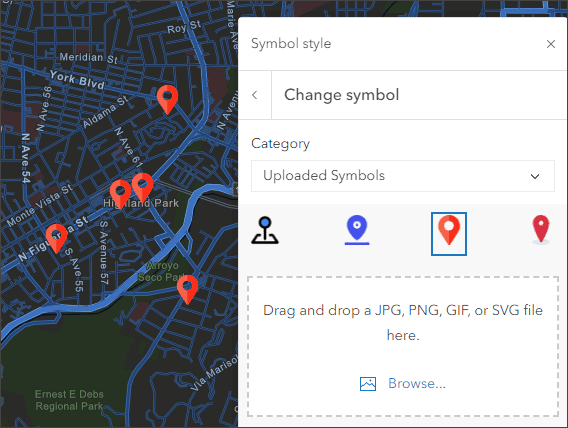
All uploaded symbols are retained for reuse in other layers or sketch layers until your browser cache is cleared.
ArcGIS Arcade expression editor
ArcGIS Arcade is an expression language that is supported across ArcGIS. It can be used to perform calculations, manipulate text, and evaluate logical statements. Arcade exists within a profile, or context, that defines the parameters that are available to the script as global inputs and the output expected from the script.
A new color palette is introduced in the editor, uniquely highlighting keywords, identifiers, constants, functions, numbers, strings, and comments. The colors maintain a contrast ratio of 4.5:1 meeting WCAG 2.0 contrast requirements.
Multidimensional sliders
Multidimensional imagery layers can contain many slices of data, that you may want to investigate, highlight, or explore both independently and relative to one another. Configuring multidimensional settings allows you to visualize a particular slice within a multidimensional imagery layer and specify which slices are displayed in the map. The slice is defined by the variable and dimensions specified in the multidimensional settings.
For an imagery layer with dimensions other than time, you can use the dimension slider to animate multidimensional imagery layers in Map Viewer. The dimension slider also allows you to manually select the desired time slice.
Common dimensions include elevation, depth, and pressure. For example, the HYCOM – Sea Water Temperature imagery layer from ArcGIS Living Atlas (shown below) displays temperature at multiple depths, in addition to multiple times.
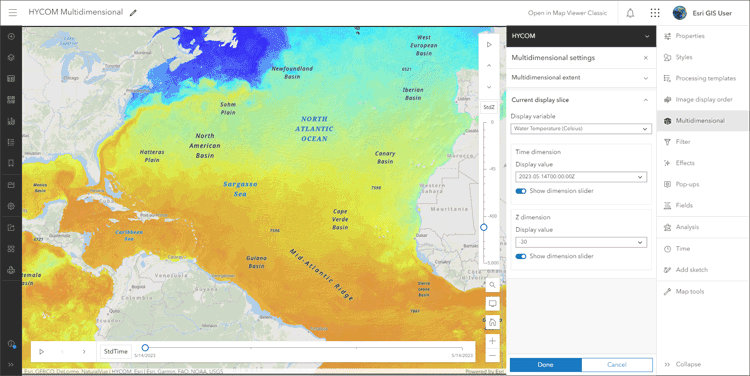
Use the Show dimensions slider toggle to turn them off or on. For more information, see Configure time and dimension animation and Configure multidimensional settings.
Other updates and improvements
When styling your layer using Types (Unique Symbols), you can now merge, move, and apply a color ramp to multiple style categories at the same time.
When creating a scatter plot chart in Map Viewer, you can now display it as a bubble plot with proportionally sized points. For more information, see Scatter plot.
Map Viewer now supports adding and configuring streaming feature layers, including ArcGIS Velocity feeds and GeoEvent Server layers. These can be styled and visualized like any other feature layer.

Analysis in Map Viewer
Map Viewer’s analysis tools allow you to quantify patterns and understand relationships in your data. Feature analysis tools are available to all members with appropriate privileges. Access to raster analysis tools requires appropriate privileges, plus an ArcGIS Image for ArcGIS Online license. For more information, see Licensing requirements for spatial analysis.
Most of the feature and raster analysis tools you’ve been using in Map Viewer Classic, plus new ones, are now available in Map Viewer with an enhanced experience and new capabilities.
Use analysis tools
Click Analysis from the Settings (light) toolbar to show the analysis pane where you can browse all tools or view previous analysis history. Analysis history shows which tools have been run, their results, the parameters used, and any errors or warnings. Tools are organized by function and can be searched by name or keyword. Hover over a tool to get more information.
When you save your map, the analysis tool history is saved along with it, allowing others to view job details and reopen the tool parameters when you share the map. This provides a way for others to use the analysis that you have done and modify and extend it for their own uses.
General analysis enhancements
You can now browse for layers directly from any analysis tool, rather than selecting only from layers that have already been added to the map. Click Browse layers in the tool inputs to search for layers to use for analysis that are not currently in the map.

When browsing, you can choose to add the layer to your map, or use it for the analysis only. The analysis results will be added as a new layer in your map.
You can add features to a map by creating a sketch layer, which is saved with the map. Analysis tools now support using sketch layers as inputs.
Environment settings for analysis can now be set for the map, rather than only for individual analysis tools. If desired, individual tool settings can override overall map environment settings.
New and updated feature analysis tools
Feature analysis is performed on vector data sources; coordinate-based data representing geographic features using points, lines, and polygons.
- Extract Data creates a .zip file, .csv, or .kml file of data within a specified extent. These can be used in ArcGIS Pro, Microsoft Excel, and other products. The Extract Data tool creates an item in your content containing the data from the layers, download the data from the item.
- Find Similar Locations evaluates the similarity between candidate locations and a reference location based on a set of criteria, then ranks the candidate locations from most to least similar.
- Find by Attributes and Location creates a new layer of the features or parts of features that meet specified spatial or attribute criteria, creating a hosted feature layer as the output.
- Merge Layers copies features from two layers of the same feature type (points, lines, or areas) into a new layer.
- Choose Best Facilities finds the set of facilities that will best serve demand from surrounding areas, producing a hosted feature layer as the output.
- Summarize Center and Dispersion finds the central feature, central tendency, and standard deviational ellipse of a set of features, producing a hosted feature layer as the output.
- Generate Tessellations now supports H3 binning.
New raster analysis tools
With this update, there are four new tools that expand the capabilities of Map Viewer for hydrological analysis.
- Fill removes small imperfections in elevation data by filling sinks or removing peaks, producing a hosted imagery layer as the output.
- Flow Accumulation generates a raster of how water accumulates into each cell, producing a hosted imagery layer as the output.
- Flow Direction determines flow direction from each cell to its downslope neighbor or neighbors using any of the D8, Multiple Flow Direction (MFD), or D-Infinity (DINF) methods. The output is a hosted imagery layer.
- Flow Distance calculates the horizontal or vertical downslope distance from each cell to the stream into which they flow. The output is a hosted imagery layer.
Raster functions
Raster functions are now available in Map Viewer, providing additional analysis and visualization options. Raster function templates are combinations of raster functions that are used to create a specific visualization or analysis that can be repeated and shared.
You can use any of the available functions directly, or build custom raster function templates from the content page. Use the Raster Function Editor, which can be opened directly from the item page of the raster function template, to combine raster functions to create the desired visualization or analysis.
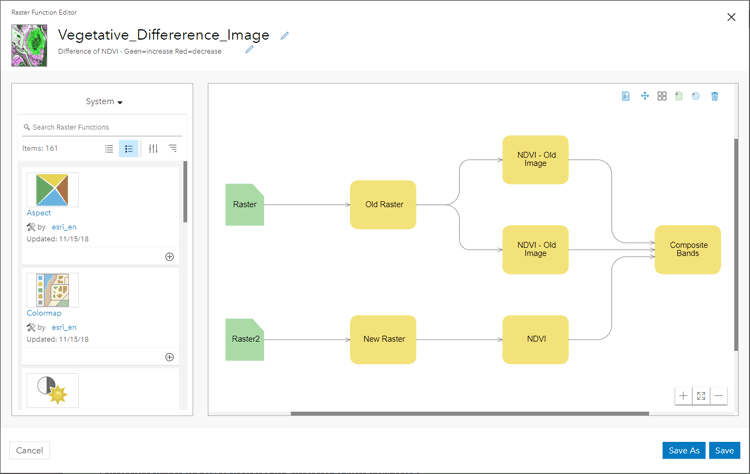
Raster processing templates for tiled imagery layers (Beta)
Processing templates have been available to add to dynamic imagery layers before, with this update you can now apply the processing templates to tiled imagery layers. This is a beta feature for tiled imagery layers that currently supports a selection of raster functions, but more will be included in subsequent releases. For more information, see Use a processing template.
For more information, see:
- What’s new in Map Viewer analysis (June 2023)
- What’s new in ArcGIS Image for ArcGIS Online (June 2023)
- Perform analysis (Help)

Scene Viewer
Use Scene Viewer in ArcGIS Online for creating, viewing, and exploring 3D scenes. With this update, Scene Viewer has been enhanced with new capabilities and features, including the following:
Enhanced visuals
Scene Viewer now allows you to see high-quality visuals such as water reflections, better shading, and sharper labels automatically on all devices and in all ArcGIS web apps.
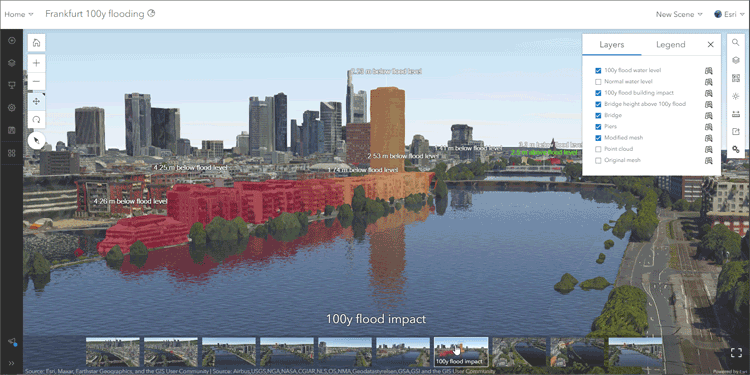
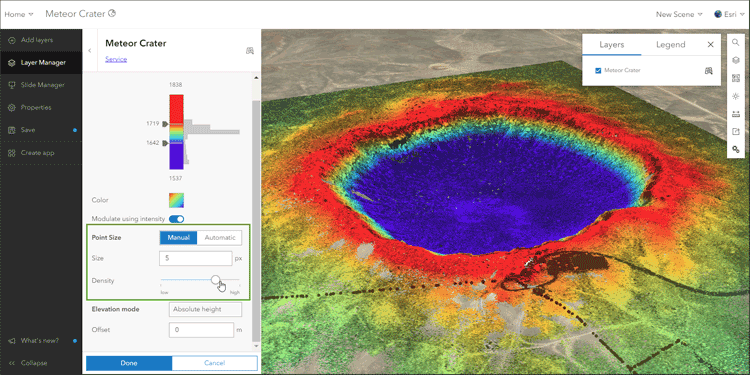
Point cloud density slider
You can now fine-tune the point density for your point cloud layer in Scene Viewer using the point cloud density slider. On the Designer toolbar, open Layer Manager to adjust the point cloud layer style. In the style options you can set the point size to Manual, then adjust the size and density of the points.
New 3D basemap (Beta)
A new Topographic 3D basemap with worldwide coverage, containing buildings, trees, places, and billboarded labels, is available in the Scene Viewer basemap gallery. These features are published from the OpenStreetMap (OSM) Daylight Distribution, and are updated regularly.
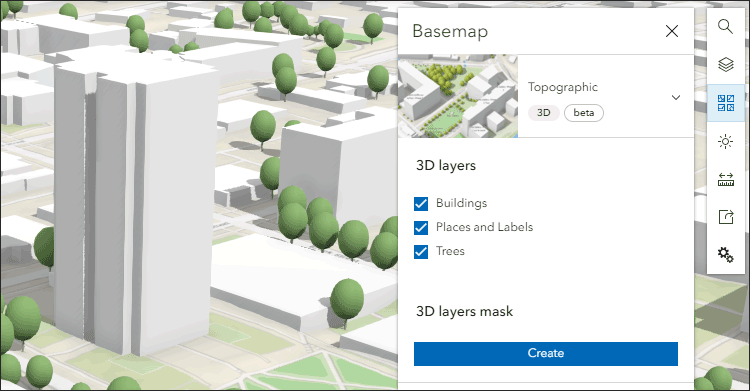
You can create a 3D layers mask to mask out areas where you want to display your own 3D data, using the new 3D basemap to add context to your own 3D visualizations.
Other Scene Viewer enhancements
- Bring 3D models into the web and persist them across ArcGIS. Six different file types are supported.
- Pop-ups are now supported in 360 VR Experiences exported from Scene Viewer.
For more information, see What’s new in Scene Viewer.

ArcGIS Instant Apps
ArcGIS Instant Apps is the next generation of focused web mapping applications, featuring a streamlined experience that lets you build apps quickly and easily using express or full setup modes. All Instant Apps templates can found on the searchable Instant Apps home page.
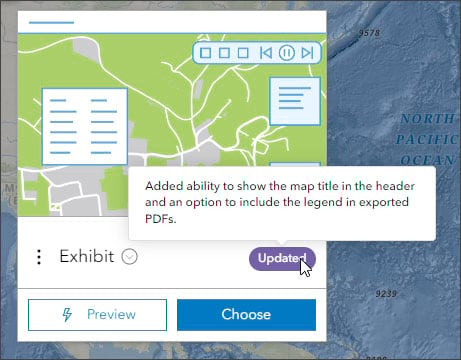
ArcGIS Instant Apps templates includes several new and updated apps. Hover over the badges in the app cards to learn more about new, updated, or beta apps.
Public Notification
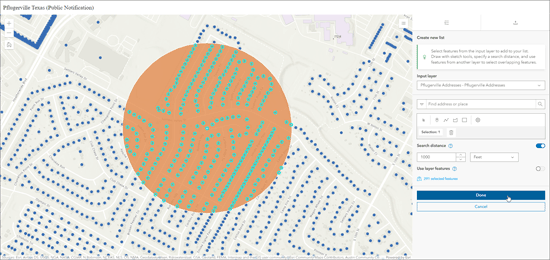
Public Notification is now out of beta and in general availability. Public Notification enables users to find and select features that can be exported to CSV or PDF file. Features can be selected by searching a location, drawing an area of interest, or using existing features. A buffer can be applied to expand the search area.
All attributes are included in the exported CSV file. For the PDF export, the pop-up configuration determines the information that is included. The information in the pop-up can be configured using any pop-up element, and can include Arcade expressions. The pop-up can be crafted to support printing mailing labels or other information reports.
Insets
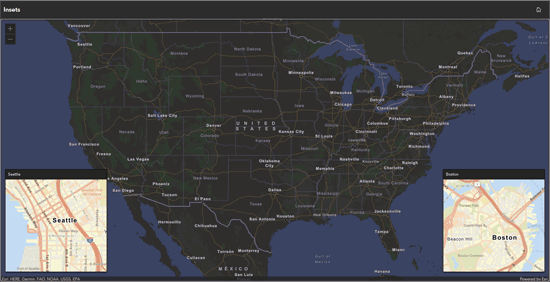
Insets enables you to display noncontiguous geographic locations within a single app layout. You can choose from a list of predefined geographic layouts or customize the inset locations using bookmarks from the map or interactively placing custom insets. Additionally, you can apply theming and position the insets in the layout.
With this update, Insets includes more predefined layouts, the ability to control layer visibility, an option to include a scalebar, and responsive inset sizing.
Exhibit
Exhibit allows app authors to tell a linear, interactive story with a single map. App viewers can move through slides defined by the app author to gain new information about the map and its data. Toggle layer visibility and change the basemap per slide to present information in different ways. Apply filters to your layers and take advantage of sketch layer capabilities available in Map Viewer to highlight different elements of your data.
Exhibit has been improved with the ability to show the map title in the header and an option to include the legend in exported PDFs.
Atlas (Beta)
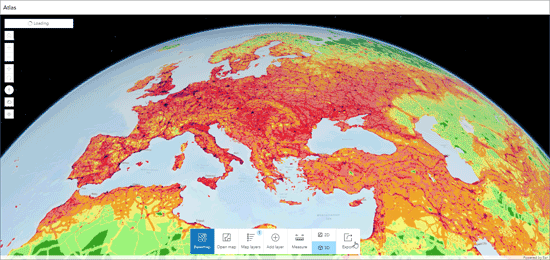
Atlas has evolved since it’s initial beta introduction with the February 2023 update. Atlas is a group-based Instant App that organizations can use to highlight a collection of curated maps and layers based on a point of interest, a geographic location, a theme, or a specific event.
Users can easily discover and explore the content, as well as share the maps they create. Some useful built-in tools to help users explore the map include searching locations, switching between 2D and 3D, measuring distance and area, and drawing on the map using sketch tools.
Atlas is an effective app that enables non-GIS users to make their own maps and explore your organization’s content.
Observer (Beta)
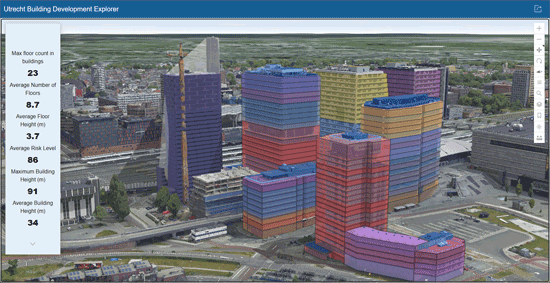
Observer is a new Instant App, introduced in beta, that is designed to provide users with the ability to explore the scene and learn more about the data. You can configure a scoreboard that will return statistics about features in the current visible extent. The template can also be configured with an optional basemap gallery and daylight tool.
Other enhancements
ArcGIS Instant Apps has added general accessibility improvements. You can now add a text-based description of your map to support screen readers, and have the option to enable a set of keyboard shortcuts in most app templates.
For more information, see What’s new in Instant Apps.

ArcGIS Dashboards
ArcGIS Dashboards enables users to convey information by presenting location-based analytics using intuitive and interactive data visualizations. Dashboards are used to help make decisions, visualize trends, monitor status in real time, and inform their communities. With this update, ArcGIS Dashboards includes several new capabilities and enhancements.
Mobile dashboard views
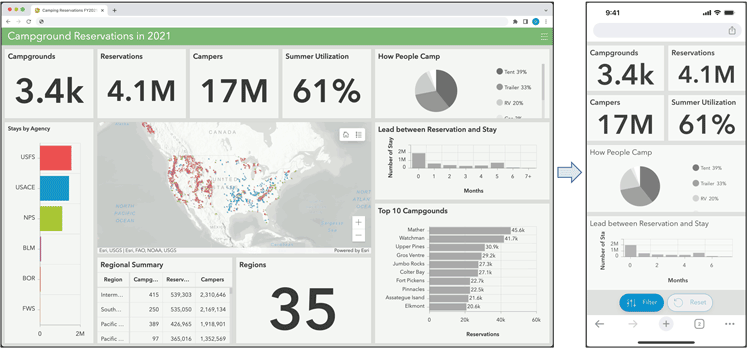
You can now configure a single dashboard to have two views in ArcGIS Dashboards. Each view is optimized for viewing on either desktop or mobile devices. The mobile view can include the same elements as your desktop view, or new elements with different configurations, providing fine-tuning capabilities for the target device or user.
Accessibility
Dashboard accessibility has been improved, including better and more consistent keyboard navigation, focus management, and improvements to screen reader support. Keyboard tab stops are now available for each panel, element, and tab for quick navigation. Dashboard elements now have accessible naming based on ARIA specifications.
Other improvements include the following:
- Find my location and Compass options have been added for the map element.
- Clicking features on the map now automatically initiates layer actions when configured.
- Dashboard users are no longer required to sign in to download source data from an element.
For more information, see:
- What’s new in ArcGIS Dashboards
- Discover what’s new in ArcGIS Dashboards (June 2023)
- Getting started with ArcGIS Dashboards mobile view

ArcGIS Experience Builder
Use ArcGIS Experience Builder to build modern mapcentric or non-mapcentric web apps and webpages without writing code. Start building from scratch, or choose from an extensive library of templates that you can customize. You can add functionality to any template with widgets you can drag, drop, and configure. You can also add custom widgets, themes, and actions with low-code development to further extend your web app.
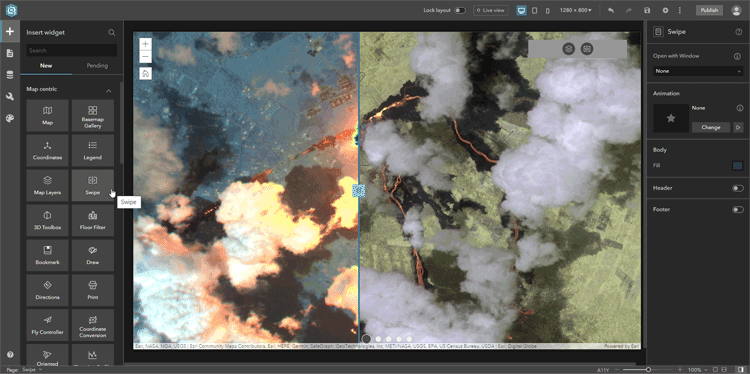
ArcGIS Experience Builder includes new features and capabilities, described below.
Templates
For this update, several new templates have been added:
- When adding windows, a new Blank window template is available. See Add windows for more information.
- Multiverse is designed for working with multiple data sources. Its Add data widget simplifies the process of importing data from multiple sources, and let’s users compare and analyze them through maps and tables.
- Frame features a framed design for keeping content organized and easy to navigate.
- Elevate is a multipage template. Its simple design and easy-to-navigate structure make it ideal for storytelling experiences.
Widgets
Three new widgets are available in ArcGIS Experience Builder:
- The Basemap Gallery widget allows you to choose which basemaps users can switch between in your app.
- The Swipe widget (used in the experience shown at the top of this section) allows you to compare different layers by moving or “swiping” a divider across the map.
- The Near Me (beta) widget finds and summarizes data about features within a certain distance of a defined location.
Many other widgets have been enhanced and improved. For a complete list and more details, see What’s new in Experience Builder.

Data management
Enhanced update data workflow
The workflow to append data to or update data in a hosted feature layer, or overwrite the contents of a hosted feature layer, has been updated and expanded into a more intuitive display of options. Separate workflows have been combined into a single workflow that you access from the Overview tab of the layer’s item page by clicking Update Data.
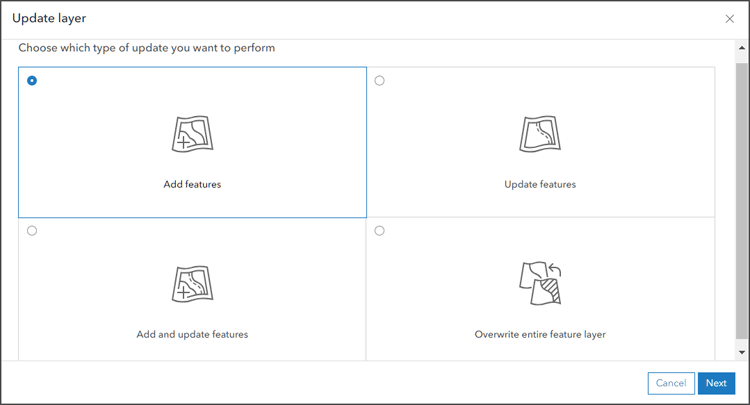
The option to append data is now referred to as adding features. Additional options for adding new data are also introduced, including specifying the time zone of source data being added and whether you want to update attributes only, or geometries and attributes.
Joined hosted feature layer views
A joined hosted feature layer view allows you to combine data from two different sublayers in a hosted feature or table layer based on a relationship between nonspatial attributes in each layer. You can join a layer to a layer, a layer to a table, or a table to a table.
Joined views are useful when you want to combine data from two layers and you need the data to dynamically update along with the source layers.
For more information, see Create a joined hosted feature layer view.

Data Pipelines (Beta)
Data Pipelines is a new capability that enables users to connect to, prepare, and integrate their data in ArcGIS Online. You can bring in disparate vector or tabular data and process it using a suite of data preparation tools to convert it to a useful format. Data Pipelines is available to Creator and GIS Professional user types.
A single data pipeline represents a series of external data source connections and processors to prepare and integrate datasets into native ArcGIS layers. Users connect to data from common sources and formats, preview and apply data manipulations, then can save the data in ArcGIS Online for mapping, operations support, or analysis. Data Pipelines can be saved and shared within the organization and run again later.
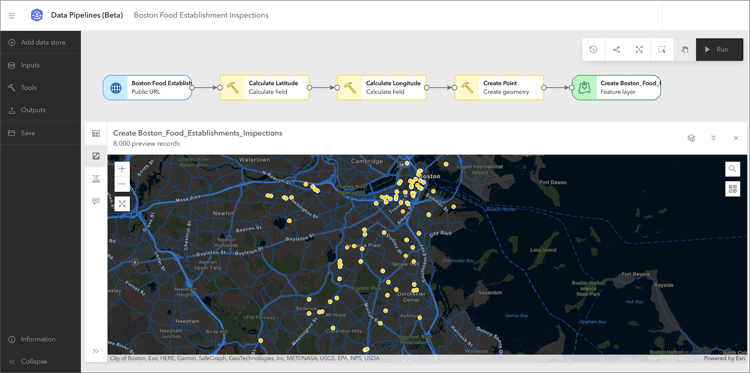
Supported data sources include:
- Cloud stores and warehouses (AWS S3, Microsoft Azure Blob, Snowflake, Google BigQuery)
- Public URL sources
- Files hosted in ArcGIS Online
- Existing feature layers
Supported processing includes:
- Add or update field names or types
- Filter by attribute expressions
- Selected a subset of fields to extract targeted information
- Combine datasets using join or merge
- Calculate fields using Arcade functions
Data Pipelines can be opened from the app launcher. Follow a tutorial to learn how to create your first data pipeline. For more information, see:

Accounts and administration
Improved Feature Data Store information
By default, an ArcGIS Online subscription includes a Standard Feature Data Store, a Premium Feature Data Store is optionally available. You can see your organization’s Feature Data Store level on the Overview tab of the organization page. You can find additional details about your organization, including feature data storage information, by clicking Feature Data Store.
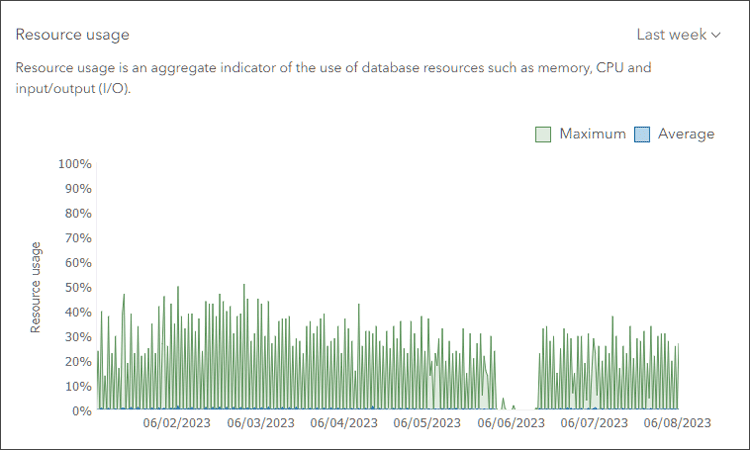
A feature data storage chart is now available for organizations with Standard Feature Data Store, helping administrators get insight on their feature data store key health indicators. Details include the amount of data storage remaining, plus a chart showing the maximum and average resource usage percentages over a specified time period.
Understanding these usage patterns can help organization make informed decisions about their data storage needs. For more information, see What is ArcGIS Feature Data Store.
Account security improvements
Account security via multi-factor authentication has been improved. Organization members can now sign in to their ArcGIS accounts using security keys and recovery codes when multifactor authentication is enabled. With security keys, such as USB, Bluetooth, or Near Field Communication (NFC) devices—as well as device-integrated platform authentication that uses biometric data—members can complete second-step verification more securely and conveniently when signing in.
Recovery codes are one-time use codes that provide second-step verification when members lose physical access to their authenticator apps, such as their phones, while traveling.
Streamlined member removal
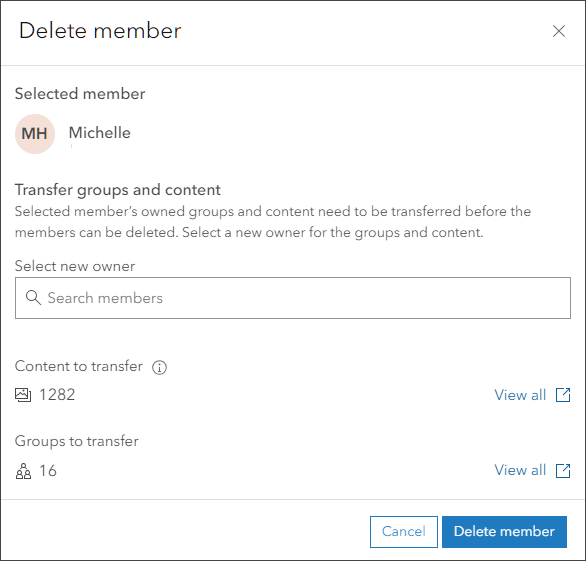
A new time-saving experience for deleting organization members allows administrators complete the process in a streamlined manner. A series of dialogs prompts and guides administrators through the necessary steps, including removing them from groups, unassigning licenses, and transferring existing content to another member.
Group membership management
Additional member information and filters are now available for managing group membership in your organization. Group owners and administrators can turn on additional filters such as member categories, login type, and last login, when performing tasks such as removing organization members from groups or changing group roles. You can also select all members in the list at once when removing members from a group, making it more efficient to manage groups with a large number of members.
For more information, see Use member categories to manage group membership.
Curated Home page gallery
Organizations can now show curated featured content on the Gallery page. The gallery displays the selected group’s featured items in the same order they appear on the Overview tab of the group page.
Metadata
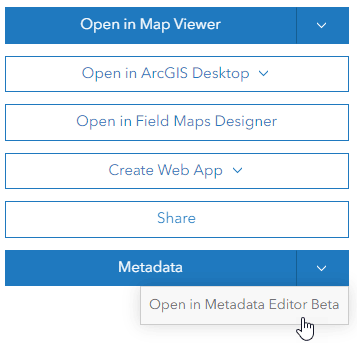
A new metadata style—ISO 19115-3 XML Schema Implementation—is available to configure for your organization to use. A new Metadata Editor Beta is also introduced, and can be opened from the Metadata drop-down in the item Overview.

More information
For more information and additional details about this release, see the What’s new help topic or view all posts related to this release. You can also watch an introductory video to see the new capabilities in action.


Commenting is not enabled for this article.