ArcGIS Online is a complete, cloud-based mapping and analysis platform. You can make and share beautiful maps, explore data, perform analysis, and do everything in between. You can add your own maps and layers, and use them in a variety of configurable apps and story maps, no programming required.
You can use ArcGIS Online as a standalone solution for your mapping and analytic needs, or because it’s is an integral part of the ArcGIS system, you can use it to extend the capabilities of ArcGIS Desktop, ArcGIS Enterprise, or use it to build custom apps using ArcGIS Web APIs and SDKs. ArcGIS Online also provides access to the ArcGIS Living Atlas of the World, a vast collection of curated, authoritative, ready-to-use content from Esri and the global GIS user community.
September 2018 release
ArcGIS Online is updated regularly, and this latest release adds useful new features and enhancements. You’ll get new spatial analytics capabilities, new configurable apps, and lots more, outlined below. For additional details see the What’s new help topic or view all posts related to this release.
Spatial analytics
Spatial analysis tools allow you to quantify patterns and relationships in your data and display the results as maps, tables, and charts. Spatial analysis tools are available directly in Map Viewer, and empower you to answer questions and make important decisions using more than visual analysis.
New tools for this release
Summarize Center and Dispersion measures the distribution of a set of point features to calculate the central feature, mean center, median center, or ellipse (distribution).
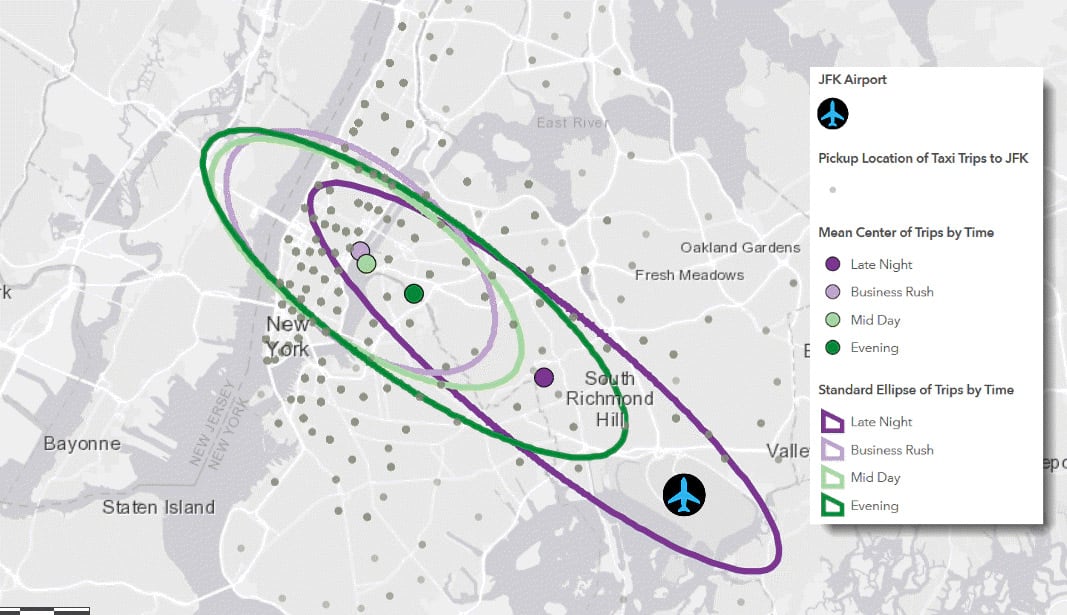
This tool can be used to track changes over time or compare distributions of different features. For example:
- Given a layer of block group centroids, the central feature weighted by population could be used to identify which part of town is the most accessible for a performing arts center.
- Given a layer of elk observations within a park over several years, mean center can be used to see where the elk congregate in summer and winter.
- Given a layer of fire incidents, the median center can be used to measure the central tendency of the fires without being affected by peripheral outliers.
- Given a layer of groundwater well samples, an ellipse can be used to determine how a contaminant is spreading.
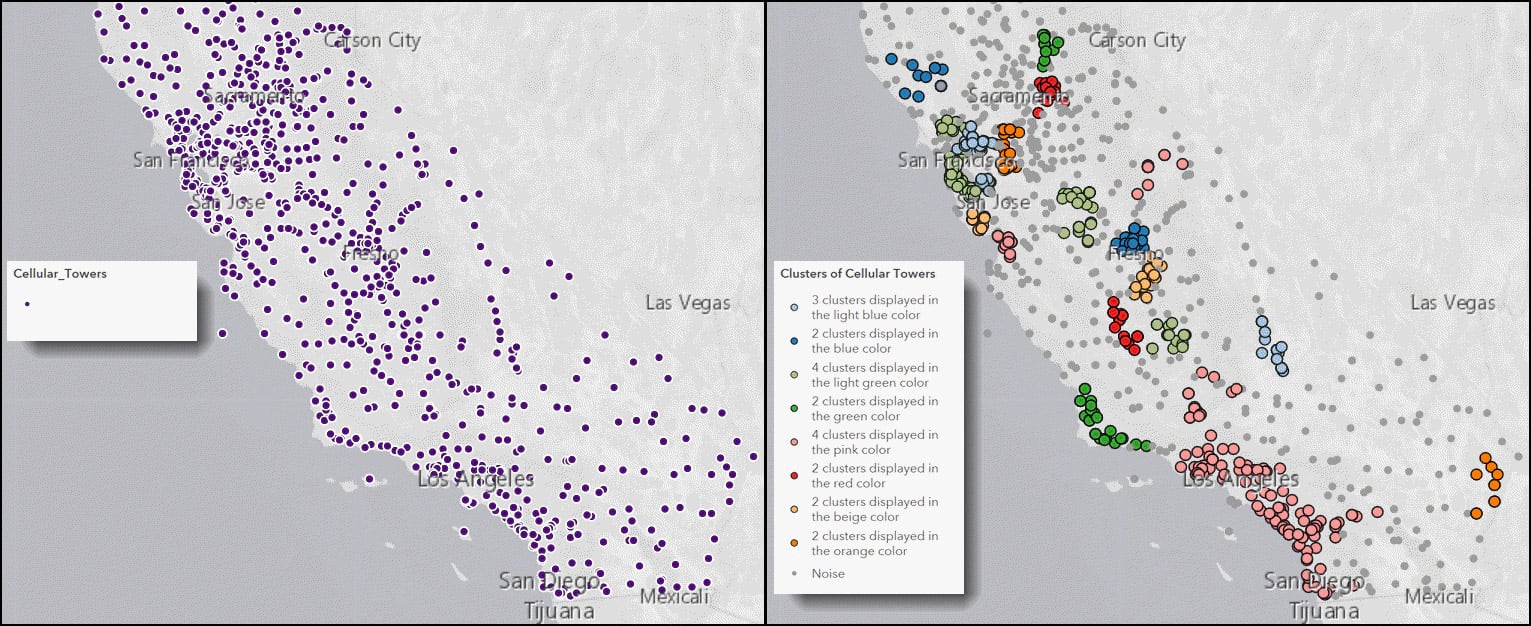
Find Point Clusters locates clusters of point features in surrounding noise based on their spatial distribution. This tool detects areas where points or events are concentrated and where they are separated by areas that are empty or sparse. Points that are not part of a cluster are labeled as noise.
Other enhancements
Find Existing Locations and Derive New Locations can now use the spatial relationship nearest to when locating the features that are closest to features in another layer.
Results from Join Features can now be created as a hosted feature layer view for all attribute joins, including one to many relationships. There are also new choices to define matching records in one to one relationships using an expression on a numeric field or a date field.
3D scenes
Scene Viewer lets you author, view, and share 3D scenes. With this release, Scene Viewer includes the following enhancements and new capabilities.
You can now navigate scenes with gamepad and 3D mouse devices. Use these tools to intuitively view and explore features, such as buildings and 3D models, underground assets, or interior rooms and corridors.
Improved search enables you to find features in scenes by searching for layer attributes. You can configure feature search so that viewers can find and zoom to specific features in a layer. For example, you can provide the name of a hotel conference room, and use search to navigates to the room, highlights it, and displays a pop-up about the space.
Learning and teaching
Whether you’re just getting started, trying to pick up new skills, looking for new ways to solve problems, or seeking help in bringing mapping and analysis into your classroom, Esri offers a wealth of self-paced tutorials, learning pathways, and curriculum builders to suit every need and skill level. Recent additions include the following resources.
Learn ArcGIS
Learn ArcGIS is a website containing timely and engaging guided lessons that are based on real-world problems, covering the entire ArcGIS platform. Most lessons require membership in an ArcGIS organization. But if you don’t have ArcGIS yet, you can try it for 60 days, join our ArcGIS Learn organization, or sign up for a free ArcGIS trial to create your own organization.
Users will find a new gallery experience, including curated how-to blogs, videos, and Story Maps. There are new hands-on, real-world scenarios available, including:
- Construct Realistic Buildings with Multipatch Editing: Create detailed 3D building models with real-world image textures.
- Explore Future Climate Projections: Answer questions about the earth’s climate and map future climate models.
- Redraw Political Boundaries with Public Participation: Draw congressional districts for the next election.
Learn Paths
Learn Paths are collections of our best hands-on content for building a strong foundation of knowledge of the platform and its capabilities. New paths include:
- Try Survey123: After understanding the differences between Esri’s field data collection tools, learn to create a survey either on the web or on the desktop and how to use the data collected in different apps.
- Take Your Surveys Further: You’ve now created a few surveys and want to share them and their results, with others. You might also like to integrate your surveys with other existing data in your enterprise.
- Explore XLSForms for Survey123: Survey123 uses the XLSForm standard for its form design. Learning about XLSForms will enable you to build increasingly complex surveys.
Teach with GIS
Teach with GIS is a new resource that provides implementation guides and a curriculum builder for discovering engaging K-12 resources for a GIS-enabled classroom. New additions include:
- Implementation Guide for the Classroom: A teachers guide for integrating mapping and location analytics in any classroom.
- Explore Hurricanes in 3D: Explore the relationship between wind speed and air pressure of a hurricane by viewing the variables in a Scene.
- Thailand’s Rescue Cave Miracle: Make a map of the international rescue effort.
Configurable apps
Configurable apps are templates that you can configure easily, without any coding. They help you publish apps quickly for a variety of users and workflows. Configurable apps are the fastest and easiest way to go from a map to a shareable app. You’ll be a hero in minutes! There are lots of configurable apps to choose from depending on the needs of you and your audience, what you need the app to do, and how you need it to look. New for this release:
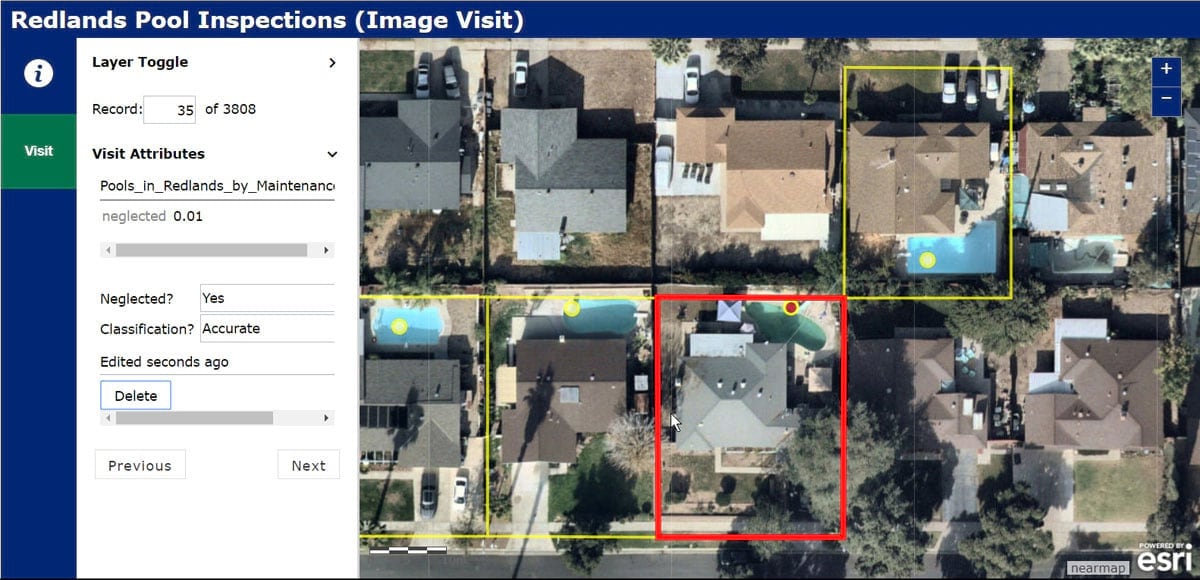
Image Visit
With Image Visit users are driven to a predetermined sequence of locations in imagery to review attributes and add or edit features. The app minimizes the time it takes for imagery to load, streamlining workflows for insurance inspections, control point verification, or checking AI classification results.
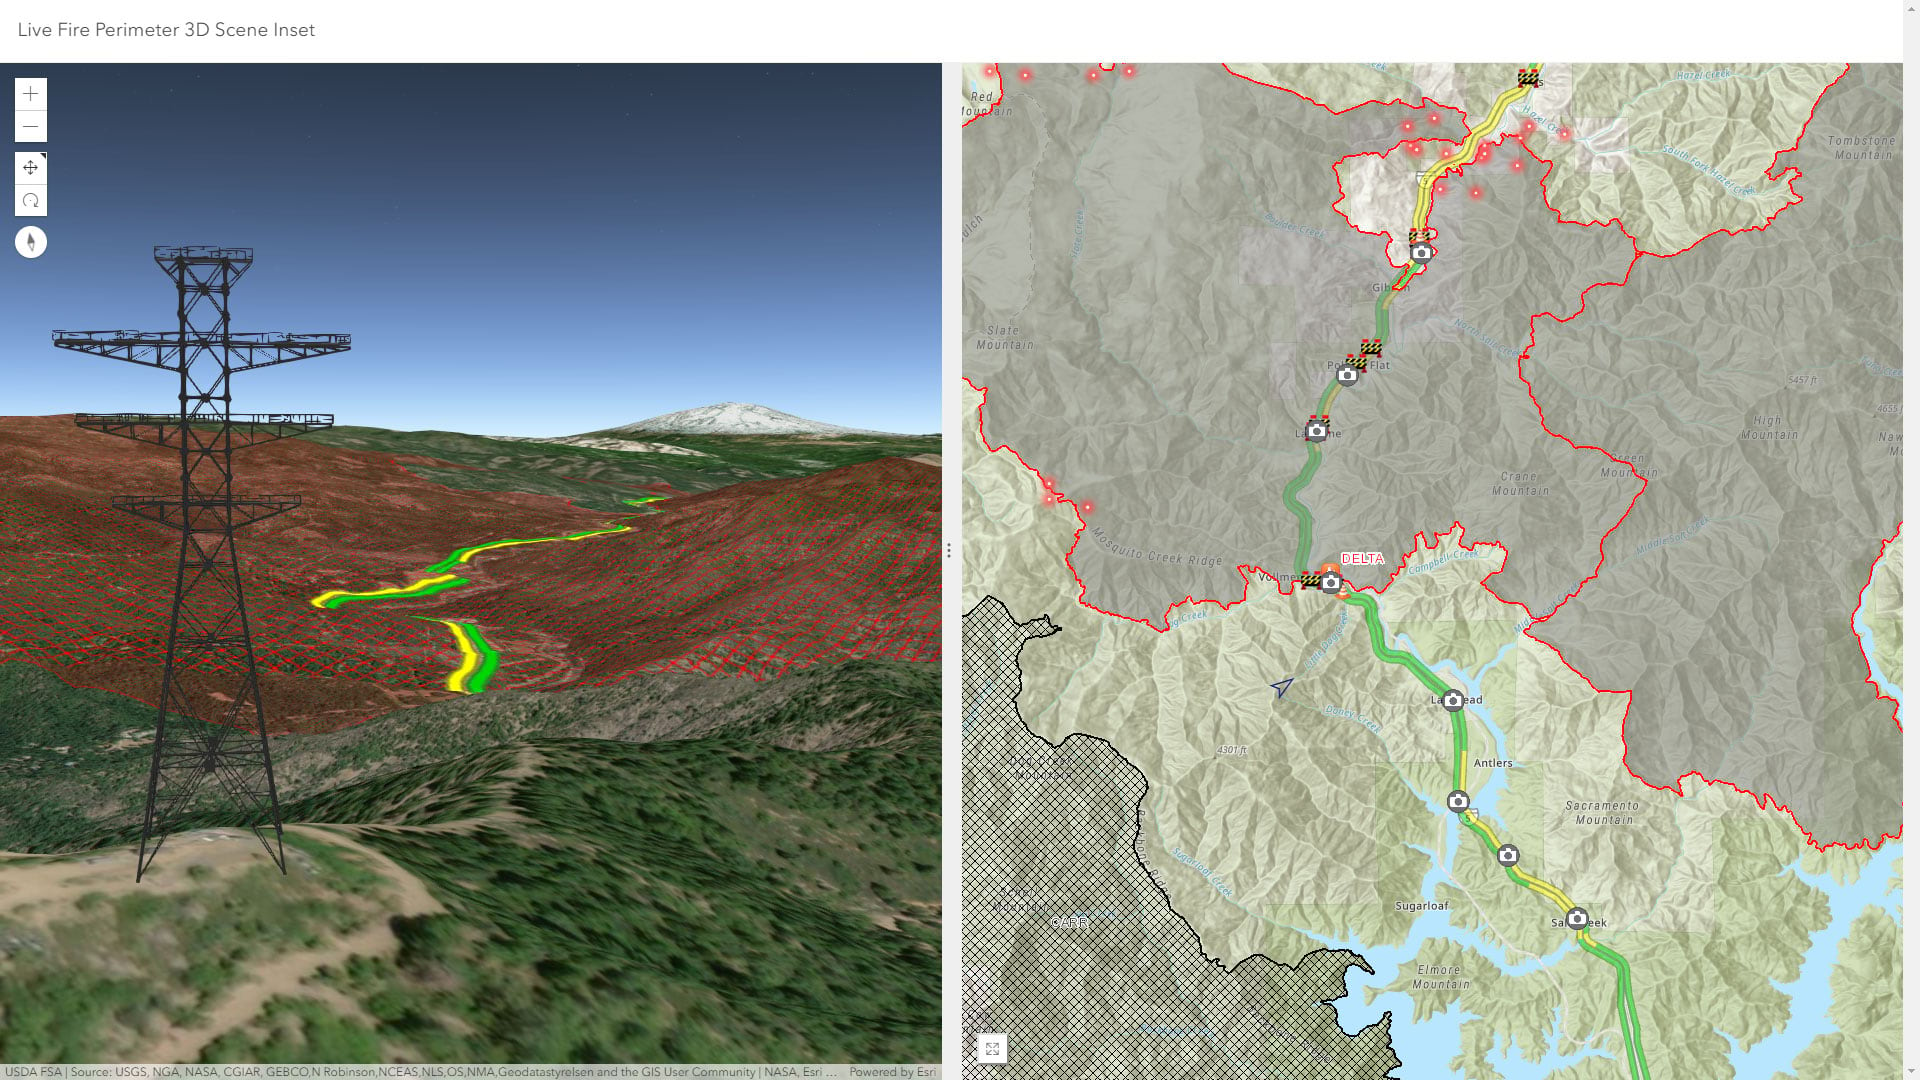
Scene with Inset Map
Scene with Inset Map provides a bridge between 2D and 3D apps by embedding a 2D map into a scene to help orient users. You can also present 2D and 3D views side-by-side (as shown below) or stacked. For more information see the Scene with Inset Map blog post.
Layer Showcase
Display a collection of layers with the new Layer Showcase (beta) app. Users can explore layer-based content from a group, view layers in a map or scene, and create a map or scene based on the layers in the app.

An early version of Layer Showcase was shown at the 2018 Esri User Conference, and was used to create the Earth Systems Monitor. View video.
App builders
App builders let you easily create custom apps, no coding required. App builders have been updated with the following enhancements:
AppStudio for ArcGIS
AppStudio for ArcGIS lets you transform your maps into mobile apps ready for Android, iOS, Windows, Mac OS X, and Linux, and enables you to publish them using your own brand to all popular app stores – no developer skills required. With AppStudio for ArcGIS, organizations on the ArcGIS platform now have the ability to build cross-platform native apps in a snap.
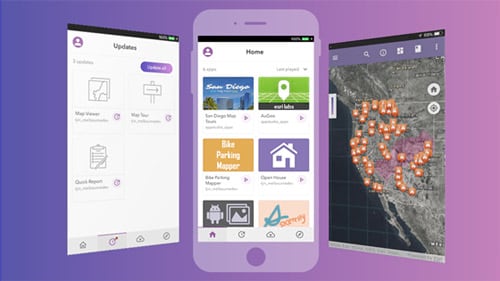
The AppStudio 3.1 release includes a variety of enhancements and productivity tools for creating native apps for smartphones, tablets, and desktops. The AppStudio Player app (shown above) has been completely re-designed from the ground up with a crisp new UI, access to more app information, and overall performance improvements. Also, AppStudio Player now includes a Samples page where users can download and explore 60+ live sample apps directly mobile device or desktop.
The Map Viewer template has a new measure tool and includes a screenshot tool to create, save, and send screenshots of the current map. Under the hood of AppStudio 3.1 is support for Qt framework 5.1, ArcGIS Runtime 100.3 and variety of new plugins for the AppStudio Framework.
For more information, see What’s New in AppStudio 3.1 (September, 2018) blog or the Whats new in AppStudio help topic.
Operations Dashboard for ArcGIS
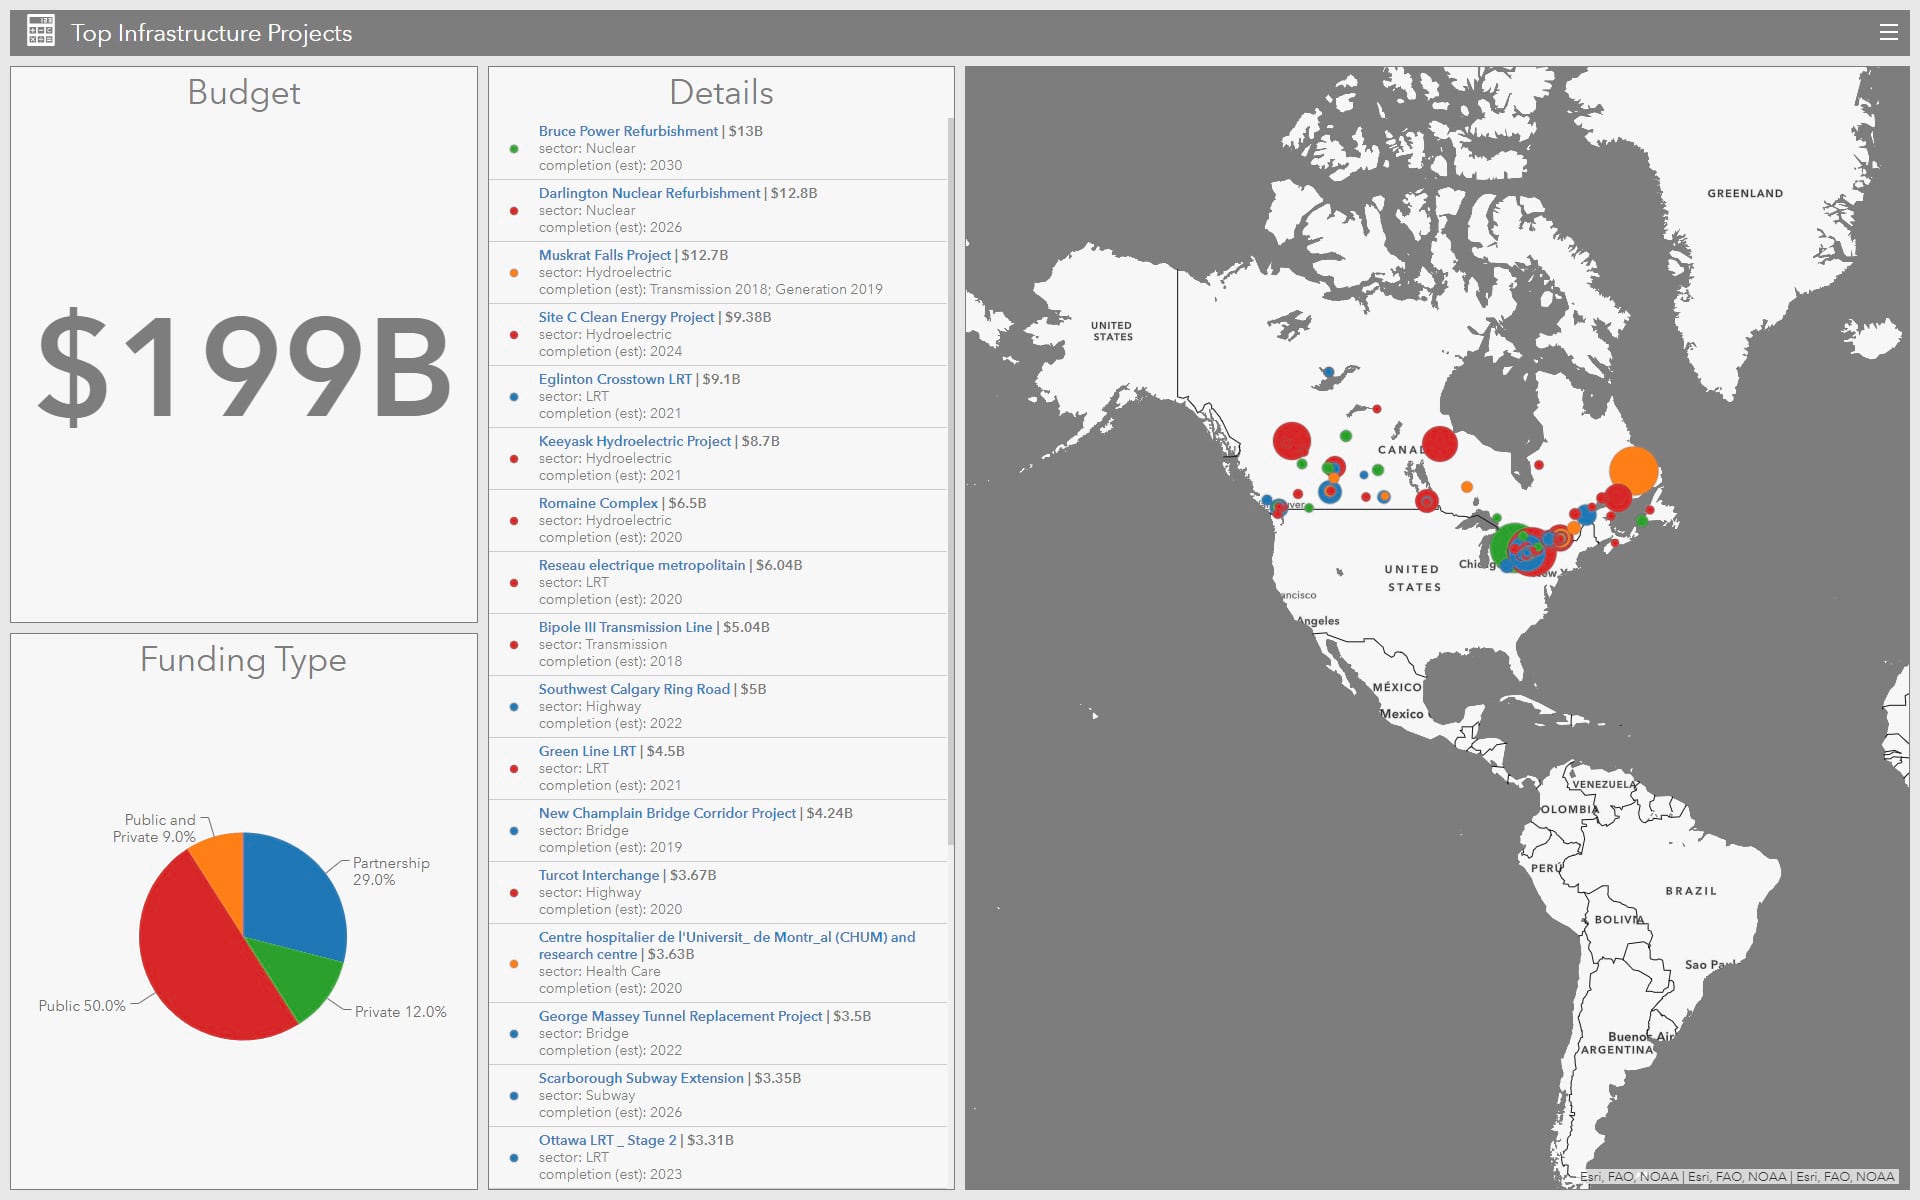
Operations Dashboard enables you to use maps alongside charts, gauges, and other visual elements to reflect the status and performance of people, services, assets, and events in real time. This update includes several enhancements to the configuration of serial charts, control over the scale used when zooming to point features, support for local time zones when filtering dates, control over the list selection color, and an improved authoring experience for category selectors. For more information, see What’s new in Operations Dashboard for ArcGIS.
Web AppBuilder for ArcGIS
Web AppBuilder for ArcGIS offers a way for you to easily create HTML/JavaScript apps that run on any device, using a gallery of ready-to-use-widgets. You can customize the look of your apps with configurable themes, and can host your apps online or on your own server.
Web AppBuilder introduces a new Pocket theme designed for apps embedded in websites, story maps, or other locations with surrounding context, where only one widget is supported in a panel positioned on the left or the right.
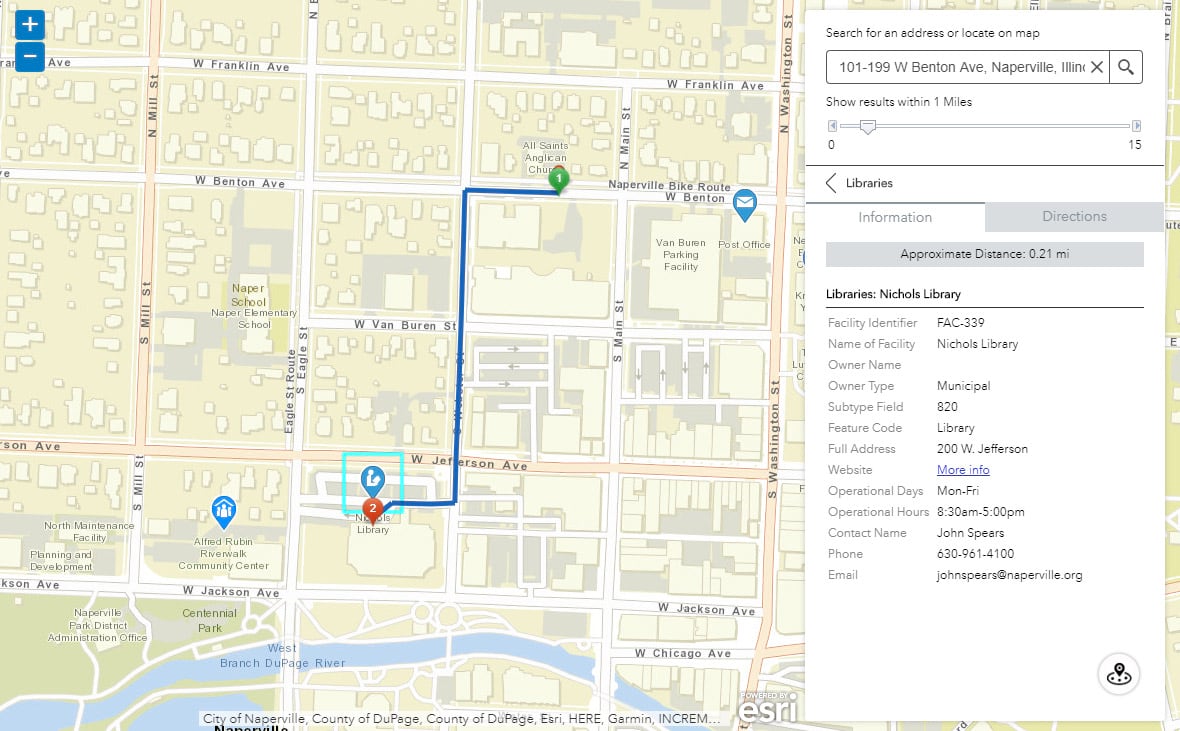
In addition, multiple widgets have been improved. You can now find layers by typing a keyword in Layer List, use Search to support typing coordinates in the search box to locate a place on the map, set dynamic maximum and minimum values dependent on data configured in Extra Data source for the gauge in Infographic, and hide or customize filter labels in Query. With 3D Daylight, you can now choose a date to reflect the sun’s position at different times. For more information, see What’s new in Web AppBuilder for ArcGIS.
Apps for the field
ArcGIS Apps for the Field help you use the power of location to improve coordination and achieve operational efficiencies in field workforce activities. Apps for the field have made numerous enhancements since the previous ArcGIS Online update including the following:
Survey123 for ArcGIS
Survey123 for ArcGIS is a simple and intuitive form-centric data gathering solution that makes creating, sharing, and analyzing surveys possible in just three easy steps. New since the previous ArcGIS Online update:
The website and field app now support Webhooks, enabling workflow automation and application integration. Nested repeats are now supported in the field app, as well as geosearch and geocoding on geopoint questions. New group and file upload question types have been added to the web designer and the web app. Additionally, a new filtering option has been added to the website on the Data tab, and enhancements have been made to feature reports and conditional template syntax when printing Survey123 reports.
Along with these major features, many other minor fixes and improvements have been made to both the field app and web app. For more information, see What’s new in Survey123 for ArcGIS.
Apps for the office
ArcGIS Apps for the office enable operations managers and analysts to visualize data in a geographic context to gain location-based insights and make decisions that save money and time. Some apps for the office have been updated. Here are a few highlights: Some apps for the office have been updated, the following are highlights:
ArcGIS Business Analyst Web
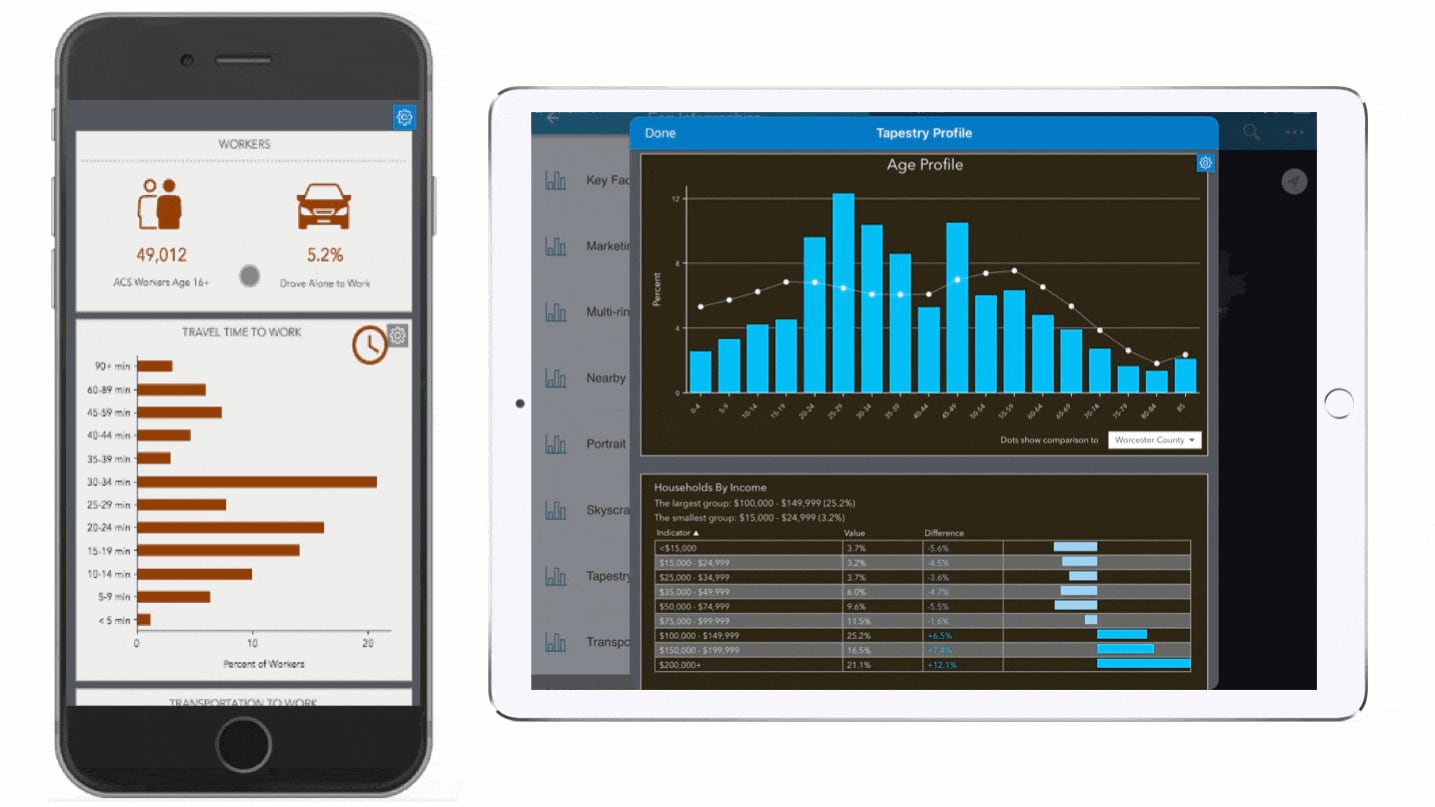
ArcGIS Business Analyst Web App is a web-based solution that applies GIS technology to extensive demographic, consumer spending, and business data to deliver on-demand analysis, presentation-ready reports and maps. Select from a wide variety of existing reports, or create custom reports to meet your business needs.
The latest update of ArcGIS Business Analyst allows you to:
- Summarize information for multiple study areas in a single table using infographics.
- Share comparison report templates with other users in your organization and use comparison reports that other users have shared with you.
- Use improved layer styling and ability to reorder layers on the map.
- Access 2018 Canada data update from Environics Analytics and the Michael-Bauer Research data update to the 2018 vintage for China, India, Malaysia, Indonesia, Philippines, and more.
- Run infographics on the go using the ArcGIS Business Analyst Mobile App
For more information, see What’s new in ArcGIS Business Analyst.
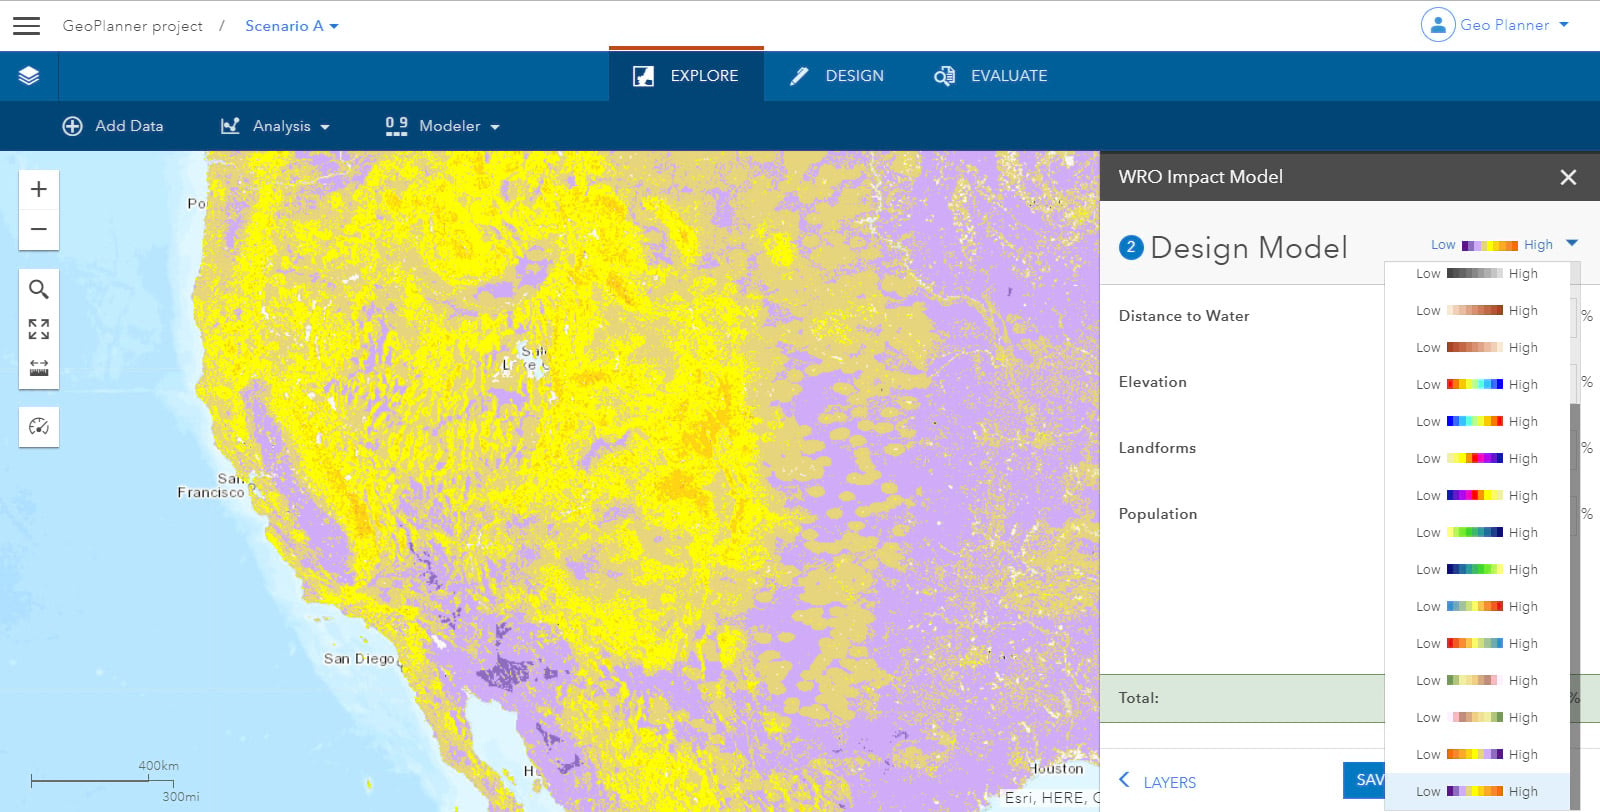
GeoPlanner for ArcGIS
GeoPlanner for ArcGIS enables you to design, test, and collaborate over planning scenarios in 2D and 3D. This release introduces new color ramps in Modeler. You can now use Impact – Negative to Positive and Impact – Positive to Negative ramps to better visualize impact across systems. The Classify tool now allows you to set different color ramps to customize your analyses and improve visual impact. For more information, see What’s new in GeoPlanner.
ArcGIS Hub
ArcGIS Hub is a community engagement platform that supports organizations in collaborating with their communities to achieve specific goals. Using initiatives, teams define goals and build customizable websites to narrate their data. To make it simple to inform the community of relevant updates and ways to get involved, ArcGIS Hub also supports organizations in connecting with the community through events and messaging.
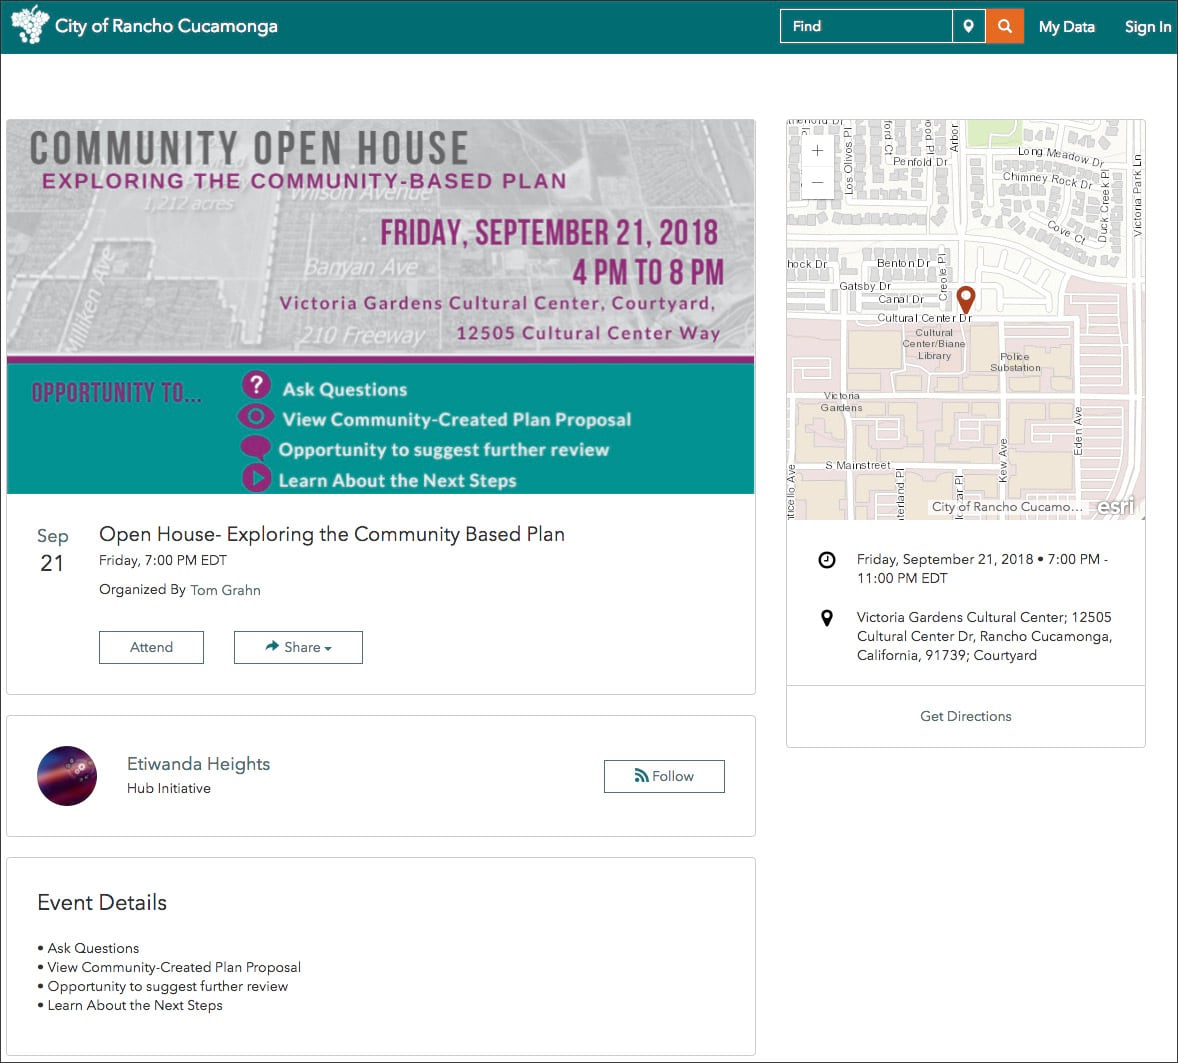
Recent ArcGIS Hub updates include the ability to chart private data on public sites, making it easier to share internal information with relevant teams all in one place. Also, a mobile-first redesign of the events management system allows initiative teams to quickly create and share information related to upcoming opportunities for involvement. To learn more about these feature enhancements and others, read our September update.
Insights for ArcGIS
Insights for ArcGIS is a web-based, data analytics workbench where you can explore spatial and nonspatial data, answer questions you didn’t know to ask, and quickly deliver powerful results.
Insights for ArcGIS 3.0 includes updates that allow your interactive presentations to include more context and branding. You can now use your organization’s colors, logos, and options for communicating your narrative with shared analysis results. Also, Insights now supports public sharing of pages, new link analysis capabilities, a predefined filter widget, KPI card, and more. For more information, see What’s new in Insights.
ArcGIS Companion
ArcGIS Companion makes it easy to access your organization from your mobile device. In addition to the mobile browser option (just use your URL), you can now access your organization using this companion mobile app for iOS and Android. Access your organization anytime, anywhere, to explore content, view groups, edit your profile, and more.
ArcGIS Companion has added more features and enhancements since the previous update. You can browse content by folder and tags; and edit item details including tags, delete protection, and authoritative and deprecated status. You can filter and sort member search results in the organization or groups; and manage group membership requests. Administrators can now use Companion to add and invite new members, and view credit usage in the organization over the previous 30 days and 24 hours. For more information, see What’s new in ArcGIS Companion.
Data management
If you published a scene layer from a hosted feature layer, you can now rebuild the scene layer cache to incorporate changes made to the hosted feature layer.
ArcGIS Online uses globally distributed caches to improve performance of publicly shared hosted feature layers. You can now control how often ArcGIS Online refreshes the cache for each public hosted feature layer.
Write Arcade expressions to calculate values in fields in your hosted feature layers.
You can rename the layers in your hosted feature layers and hosted feature layer views. If you publish a hosted tile layer from a hosted feature layer, you can also rename the layers in the hosted tile layer.
ArcGIS Living Atlas of the World
ArcGIS Living Atlas of the World is the foremost collection of geographic information from around the globe. It includes curated maps, apps, and data layers from Esri and the global GIS user community that support your work. Check out the ArcGIS Living Atlas of the World website, where you can browse content, view the blog, and learn how you can contribute. Here’s what’s new for and around this release.
The World Imagery basemap has been updated with the latest DigitalGlobe Basemap +Vivid imagery for several countries and the latest DigitalGlobe Basemap +Metro imagery for many cities around the world.
The Wayback imagery archive (beta) has been expanded since the June 2018 update with additional releases of World Imagery layers. See Using World Imagery Wayback.
Demographic maps for Canada have been updated with data from Environics. Several countries now use the latest Michael Bauer Research (MBR) demographic data. For more information, see What’s new in Esri Demographics.
To stay up to date with the latest, see the Living Atlas blog articles.
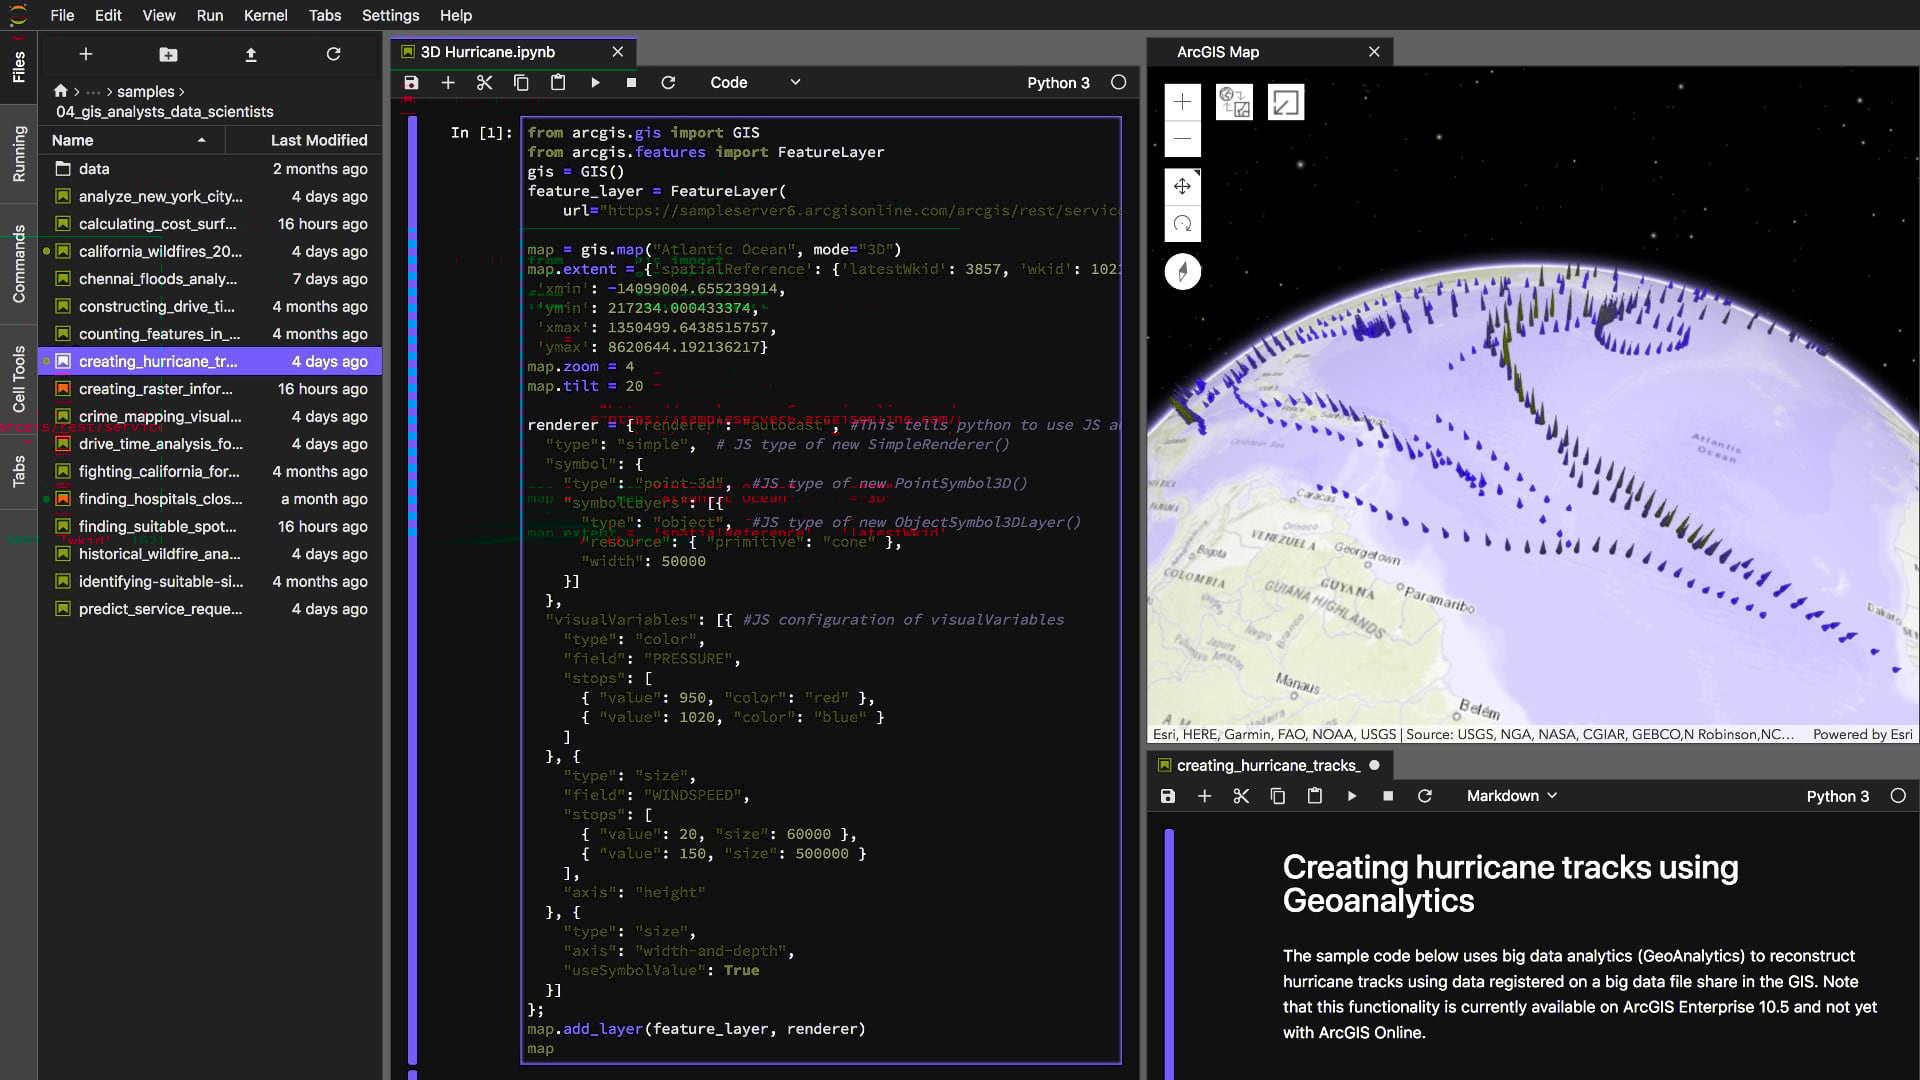
Python workflows
The ArcGIS API for Python provides simple and efficient tools for automating tasks in your ArcGIS organization, as well as performing GIS analysis and visualizing your spatial data. ArcGIS API for Python integrates smoothly with the open-source Python ecosystem, including the popular Jupyter Notebooks.
ArcGIS API for Python v1.5.0 now supports the JupyterLab framework, JupyterLab interacts with the same Jupyter Notebook format, but offers a robust file explorer, a more intuitive user interface, support for interacting with other file types, etc. This makes JupyterLab more of an IDE when compared to the Classic Notebook server.
Miscellaneous
Mapping and visualization
Over 90 National Park Service symbols have been updated (Courtesy of: Jake Coolidge/NPS) in the National Park Service Map Viewer symbol set.
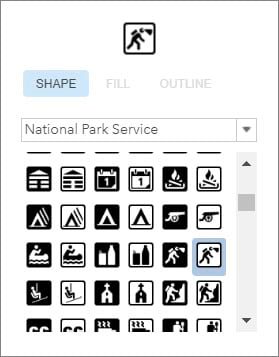
The Local Government and State Government symbols have also been updated.
Administration
Administrators can download an audit log of activity with information about changes to the organization and its members, groups, and content.
For more information
For more information and additional details see the What’s new help topic or view all posts related to this release.

Commenting is not enabled for this article.