The frequency and severity of wildfires around the world are rising, making the tracking and assessment of wildfire damage a critical issue. However, monitoring these wildfires is made intuitive and seamless with ArcGIS Image for ArcGIS Online.
In Part 4 of this blog series, we explored how you can create a hosted, tiled imagery layer with Landsat imagery. Now, in Part 5, we will examine how to identify the burned areas within the study area with raster analysis tools.
This blog is Part 5 of 5 – collectively, this series will analyze one specific wildfire incident and will cover the following topics:
- Create multidimensional imagery
- Host multidimensional imagery layer
- Review wildfire in time series
- Host Landsat imagery layers
- Assess damage
Let’s get started!
Location
For this study, I chose one of the areas identified as a wildfire hot zone. After some research, the location is around Lac La Valliere near Mistissini, Quebec. In the area southwest of the lake, there is a wildfire that started around June 3, 2023.

Software
Internet browser with access to www.arcgis.com
Data
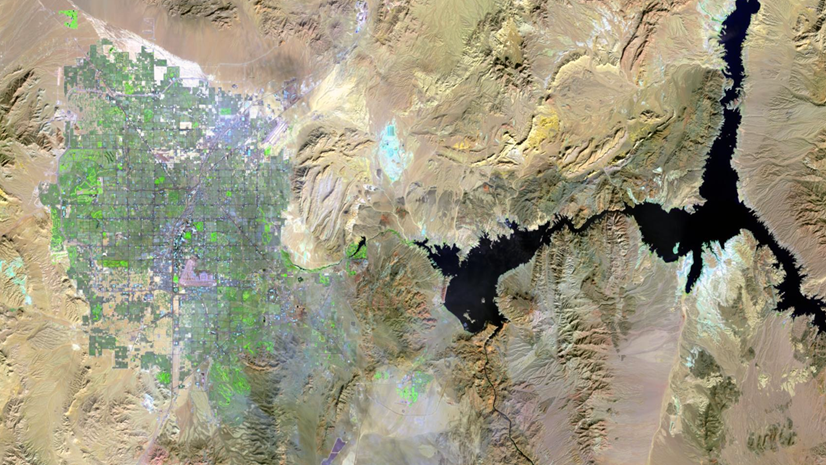
There are going to be three primary imagery layers that will be the focus of the web map, but we won’t simply host them and then present them. With imagery layers from ArcGIS Image, imagery layers aren’t just context or background, they are story elements. However, before we get to that, let’s view the three input imagery layers. All three of the imagery layers are Landsat images, one is collected with the Landsat 9 sensor and the other two with Landsat 8. All of the hosted imagery layers have 8 bands to use to use for visualizations and analysis. (There are 11 raster bands in all the input Landsat images, but for this analysis the multispectral processing template was chosen so only 8 will be visible in this version of the imagery layers.)
All three of these imagery layers are tiled imagery layers hosted in ArcGIS Image for ArcGIS Online.
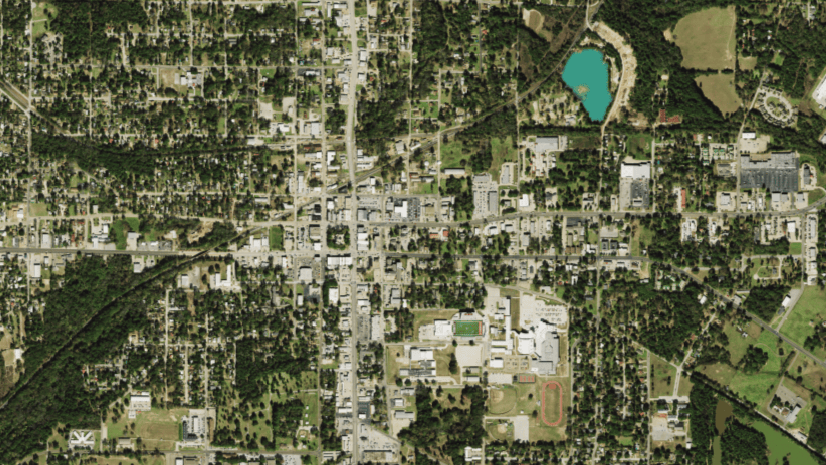
Lac La Valliere Wildfire – Pre-fire
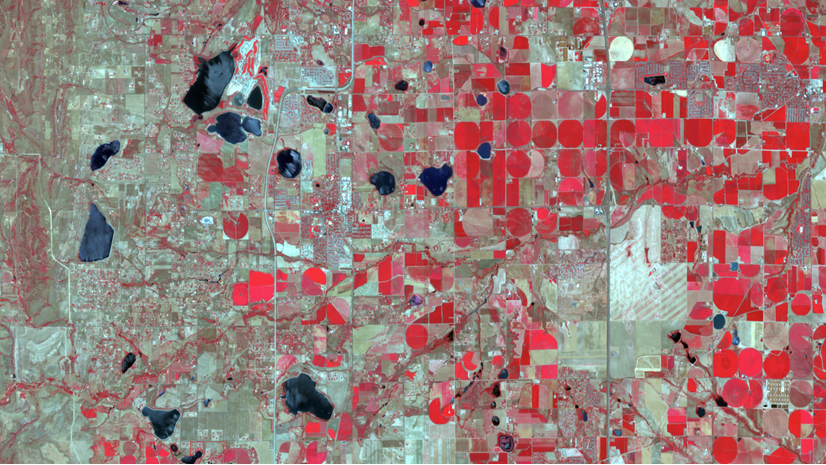
Lac La Valliere Wildfire – Active burn
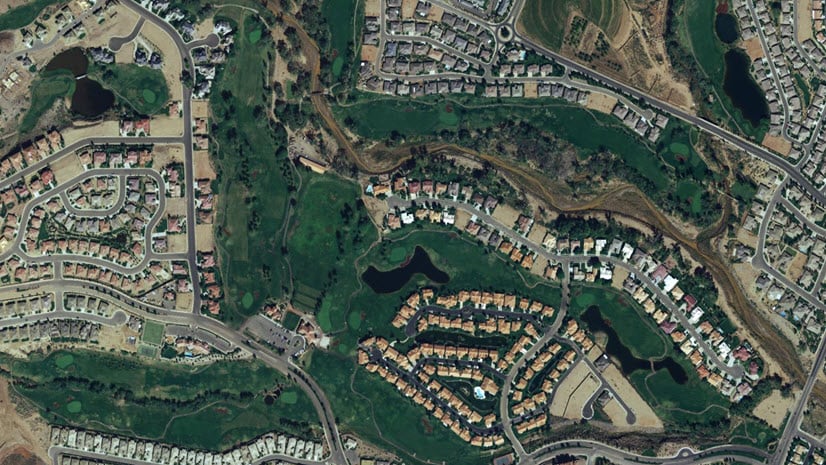
Lac La Valliere Wildfire – Damaged
These images show before, during, and after the wildfire strikes the location and can start to tell the story of the damage done to that particular area and begin the process of recovery. Now that you have reviewed the input imagery, you will begin visualizing wildfire damage. Satellite data like this provides a record of what is happening on the ground and is a great choice to visualize wildfires in ArcGIS Online.
Map
A webmap has been created with the above layers and an additional imagery layer that combines all three of the imagery layers into a multidimensional tiled imagery layer. This multidimensional imagery layer will allow us to animate the study area and see the damage as it happens.
1. Sign into ArcGIS Online and then open this web map.
Once the webmap opens, take a look at the layers that have been added to the map. There should be the following layers:
- Active Wildfires in Canada
- Landsat Layers group layer
There are three imagery layers within that group layer that are showing the fire in different stages. The Lac La Valliere Wildfire – Damaged layer is visible showing the wildfire damage when you open the map.

This tiled imagery layer uses the same input Landsat image as the multidimensional imagery layer also included in the web map. In another blog, the multidimensional imagery layer could be visualized in different ways to see the damaged areas with different band combinations. For this blog, you will use raster analysis to identify the damaged areas and prepare to share that information to aid in the recovery.
2. Expand the Analysis pane by clicking the Analysis button and then expand the Raster Functions.
All of the available raster functions are listed here for use in your map, but in addition to these raster functions there are raster function templates that can also be used.
3. Click the Open Raster Function Template button to browse available raster function templates (RFTs).
You can select any raster function from your organization or that has been shared in ArcGIS Online, including the Living Atlas of the World.
4. In the Browse raster function templates dialogue, select ArcGIS Online as the area to search and in the search window type NBR.
5. Select Normalized Burn Ratio (NBR) Analytic to choose the RFT that will calculate the burn area according to a raster band calculation ((B5-B6)/(B5+B6))
The selected raster function template will open like other raster analysis tools for you to create a new imagery layer.
6. From the Input Raster drop-down, select Lac La Valliere – Damaged and type in a new name for the output layer (NBR_Damaged Your initials)
Normally a good habit is to consider the environment settings and estimated credits before running the raster function, but in this case I have already done so (estimate is 3.2 credits).
7. Click Run to create the new NBR_Damaged layer.
You can view the progress of the RFT by opening the History tab in the Analysis pane, the status of the tool will be updated as it processes. Once the process has finished, the new imagery layer reveals all of the burned areas as darker spots on the imagery layer. For this imagery layer, the values range from .937 to -1 with the values closer to 1 being darker.

8. In the Layers pane, select the NBR_Damaged layer and open the Style options.
9. Click Classify and click Style options to open review the default classification.
By default, there will be five classes that use the Natural breaks method to determine the values. According to the legend, the values between -.588 and -.111 are the values that cover the burned area in the imagery layer.

10. Click Done to close the Style options and close the Style pane.
11. Click the Analysis and open the Raster Functions pane again.
12. Type remap in the search window and click the Remap raster function.
13. In the Remap raster function, select the NBR_Damaged layer, type in for -.588 Minimum and -.111 for Maximum, Output to 1, and click the option to Change missing values to NoData.
14. For Output name, type BurnedArea_YourInitials and click Run to create the new imagery layer.
15. Turn off the visibility of the NBR_Damaged layer.
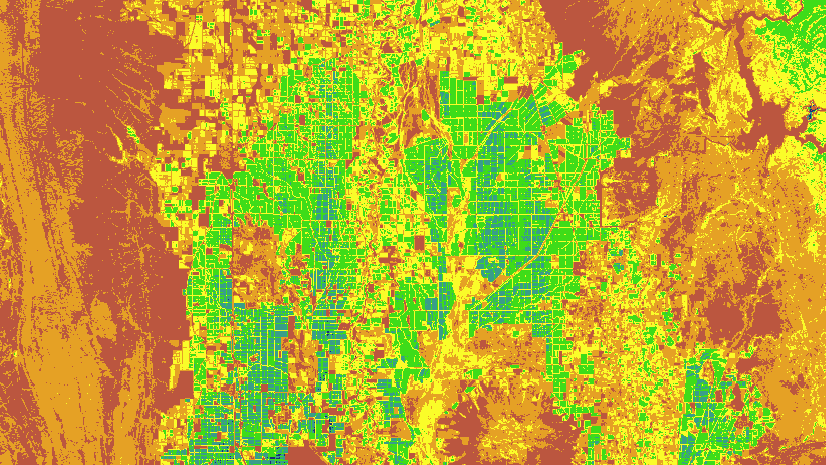
16. In the Layers pane, select BurnedArea layer and expand the Style pane on the right side of the map.
17. Select the Stretch Style options.
18. Click the Color scheme drop-down and select a new color ramp. I chose the Yellow to Red to change the style.

The layer is visible in the web map as a red area indicating the burned areas. In addition to the main fire, there are also other burned areas in the imagery layer visible now.

Now that you have the burned area identified, you are ready to share the information. All of the layers you created are ready to be added to a web map and shared or can be accessed in ArcGIS Pro for further analysis. While this workflow was completed in Map Viewer, you can also perform each of these steps with the same imagery layers in ArcGIS Pro.
Wildfires can be catastrophic events and it is important to consider the damage closely. Visualizing wildfire damage in ArcGIS Online can provide insights to the damage done to the local landscape. The location and severity of the wildfires can be seen through many lenses, but sometimes through imagery the impact of the event can be seen differently. As described earlier, imagery in ArcGIS Online can be much more than context for other stories. Through ArcGIS Image for ArcGIS Online, imagery can be visualized and analyzed in new ways to tell the story of what happened in a new way.
Ready to take the next step?
In Part 5, you were able to see a few of the new raster functions and raster tools available but there are many more to explore. Now that you know how they can be used, how will you use them? Is there a workflow that could be enhanced by taking a new look at it with imagery? I look forward to hearing about how you will use the raster functions and how your workflows will be enhanced.
Did you like this blog series? Is this your first blog in the series? Be sure to check out the other three. Come join the discussion in the Esri Community to provide your feedback and get all your questions answered.


Article Discussion: