There is an exciting and new 2020 European Space Agency layer in ArcGIS Living Atlas that classifies the earth into 10 land cover types at a scale of 10-meters. The resolution is incredible, and we’ve written this blog, if you are interested in finding out more. Today, I am writing about one of the 10 classes included in that layer: Mangrove Ecosystems.
By separating out mangroves into their own land use designation, you can find them easily and also see them in their entirety all over the earth.

Special Ecosystems
Mangrove ecosystems are unique. They are composed of salt tolerant trees and shrubs with complex root systems and are found in tropical and subtropical latitudes from 25° North to 25° South. Incredibly, each year mangroves and coastal wetlands sequester carbon at a rate ten times greater than older well established tropical forests. They also provide benefits like protecting water quality by filtering out pollutants before they reach seagrass habitats and coral reefs. They act as a natural buffer by stabilizing the coastline and prevent erosion during storm surges and heavy rains. Mangroves provide a safe nursery habitat for fish, shelter terrestrial wildlife species, and act as a secure nesting and seasonal migration habitat for coastal birds. They are especially important ecosystems on our planet.

Only 42% of mangrove habitats are found within designated protected areas and they are under threat. Human related activities such as farmland conversion, aquaculture, and urbanization have led to a 60% loss of habitat. The effects of climate change are further impacting them through storm surges, sea level rise, and erosion.
Having this 2020 global resource available at 10-meter resolution in the Living Atlas library allows anyone to take a closer look at these fragile and important ecosystems. You can add this layer directly into ArcGIS Pro and run zonal or summary statistics or leverage the many options available with geoenrichment to better understand the human related impacts and what is driving them.
Mangrove Mapping
Objective: Find out where mangroves are globally and highlight them. This kind of map should be minimal in its composition and the focus should be on mangrove ecosystems in the context of where land meets the sea. A dark basemap is perfect to focus our attention and all it took was a few clicks to blend Firefly and Human Geography Dark basemaps together, plus some of the awesome ArcGIS layer effects for this map to come together.
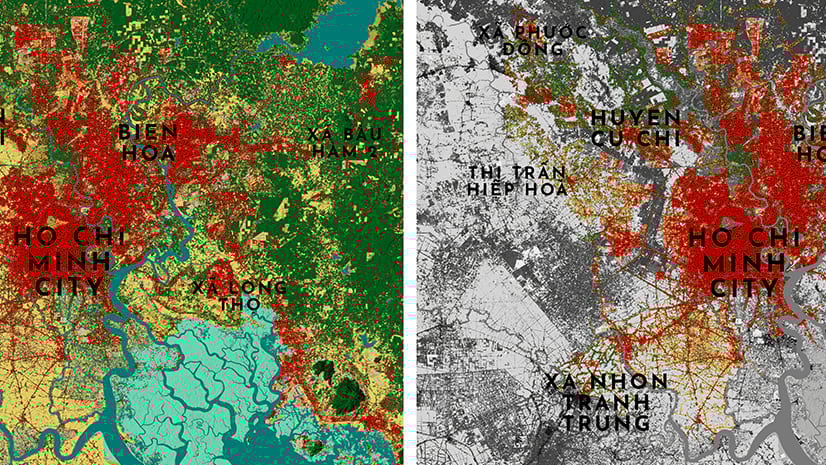
The basemap is broken into two parts. The ‘background’ basemap is Human Geography Dark Detail and Label and Firefly. Here is how they set up:

The second portion of the ‘basemap’ is within the actual map layers. World Countries was used so that the land is the darkest thing on the page and disappears. Then Human Geography Dark Base helps to mask out the ocean using the blend mode ‘Hard Light’, so its color is multiplied by the background’s color. Since they both are dark it creates these cool shadows.

Next add in the 2020 European Space Agency layer. To only show just the mangroves, since this is a tiled imagery service, you are unable to leverage a definition query. So, to isolate just the mangrove land cover class, turn off all the other land use classes one by one.

Just mangroves now.

Let’s pump up the color so it is a bit brighter like #00ffb7 which is just on the edge of green and blue. Like mangroves – green plants and blue water.

Now let us make them pop with Layer Effects. First zoom in.

I am going to apply Bloom first which gives it that beautiful glow like bioluminescence in the ocean by the moon at night.

Next, I’ll add a Drop Shadow and pick a color like #0ff5a8 which will compliment my other color and set the opacity to 60% so its super dreamy looking.

That’s it! Let us check out a couple of spots around the globe!
Southeast Asia contains nearly a third of the world’s mangroves. Indonesia alone houses 20% of the global total! Unfortunately, some of the largest mangrove habitat losses are found in East and North Kalimantan, Riau, and West Papua in Indonesia; the Mekong Delta in Vietnam; and the Irrawaddy Delta in Myanmar.

The Cross River Estuary in Nigeria is the biggest mangrove ecosystem in Africa. Local deforestation and encroachment from fishing communities has put significant pressure on these sensitive forests.

The mangroves found in the Persian Gulf and Strait of Hormuz provide clean air and recreation opportunities for dwellers of big cities like Abu Dhabi and Dubai. The mangroves in these areas are also highly adapted to extreme salinity and temperature variability.

There still is hope for mangrove protection and restoration. In 2021, Costa Rica announced that it was going to restore and protect 22,000 hectares of their remaining mangroves. Belize committed to protecting 6,000 hectares by 2025 and another 6,000 by 2030, doubling their current levels of protection. This year Cuba established a new 72,778 hectare marine protected area covering mangrove forests, seagrass beds and coral reefs.

The only thing better than exploring this incredible 10-meter layer in ArcGIS is seeing these mangroves up close and in person. There are so many mangrove spots to visit. Time to plan a trip!

Please find the web map that created these maps here.
For more information about Layer Effects and Blend Modes here are a few additional resources:
Map Viewer Effects: Drop Shadow and Population Footprint
Five Minutes with Layer Effects
One Minute Map Hack: Turn Any ArcGIS Online Map Into Firefly, With the Bloom Effect
Blend Modes for Thematic Maps
Blend Modes are here and they’re pretty awesome
How to Make Your ArcGIS Pro Map Awesome with One Blend Mode
Also be sure to check out the blogs listed below. Feel free to reach out to me with comments or questions. Thank you!

This map looks great with this valuable new dataset. In trying to replicate it, the first gif shows three distinct layers (Human Geography Dark Label, Human Geography Dark Detail, and World Imagery Firefly), but the second gif just shows a single base layer (Human Geography Dark Base). I understand there is some blending going on but could you describe the steps that you took to collapse the three layers (two reference, one base) into the single base layer that gets blended with the World Countries vector layer?
Hi Mike. The way this map is set up as follows:
Map – Table of Contents
Map – Basemap
Reference:
Base:
World Imagery (Firefly) with Layer Effects of Grayscale 100%
Take note of the Layer Effects, Blending, Transparency, and order of layers in the different sections (main map and basemap). You can find this map here for reference. Thank you so much and let me know if you have any other questions.