Featured trainingNew Course | Introduction to Indoor Mapping Using ArcGIS IndoorsLearn more about the course
October 25, 2023 | Multiple Authors | Mapping Group Layer Items: A new way to build and share content
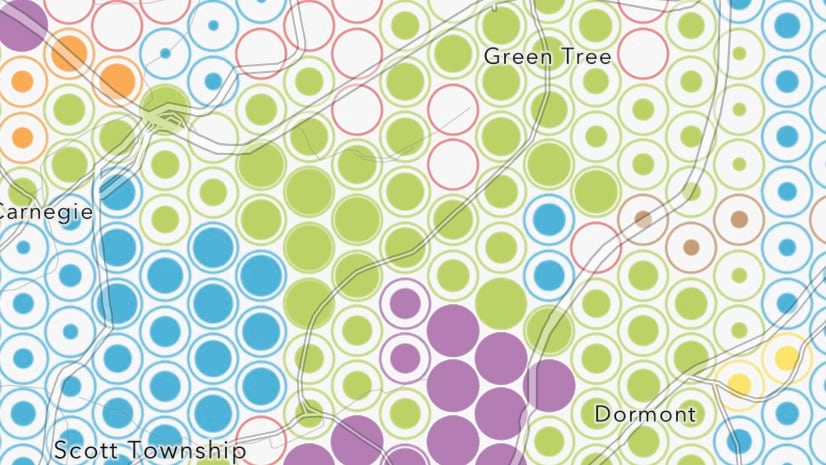
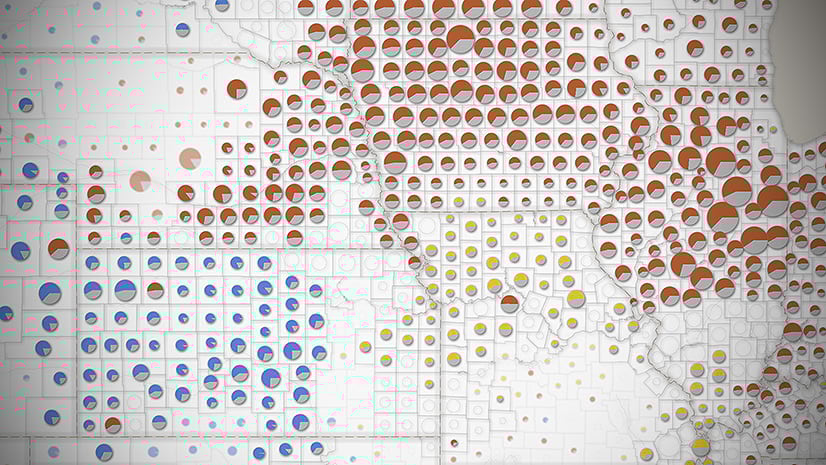
November 10, 2022 | Mark Harrower | Mapping Aggregation-o-rama! Binning, Clustering, and Clustered Pies now in Map Viewer
June 30, 2022 | Multiple Authors | Mapping Thematic Mapping 101: How to ask and answer questions in a map
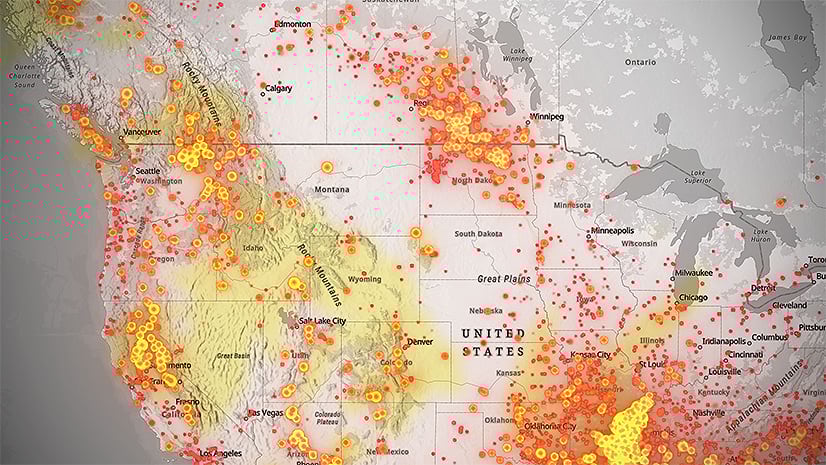
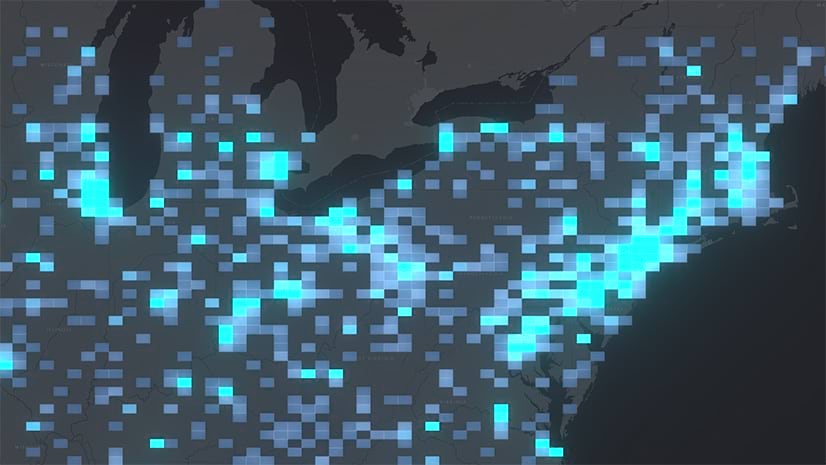
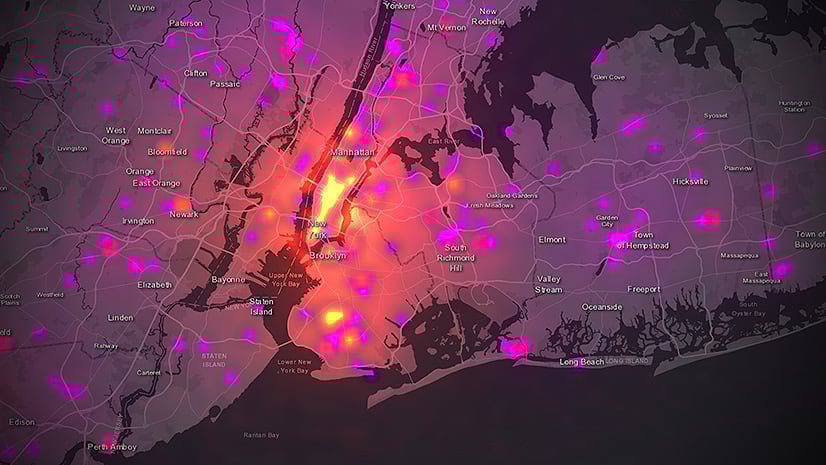
June 22, 2022 | Mark Harrower | Mapping Next-Generation Heat Maps in Map Viewer: Better, faster, smoother, stronger
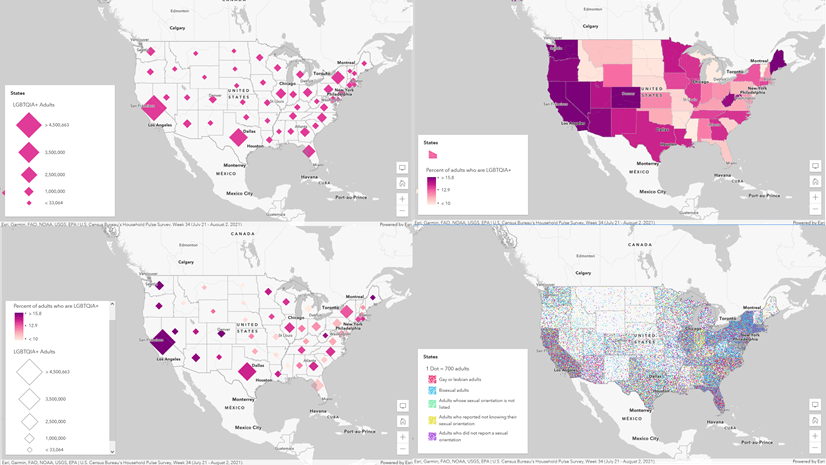
June 22, 2022 | Mark Harrower | Mapping New Charts and Charts & Size map styles help us make sense of all the numbers
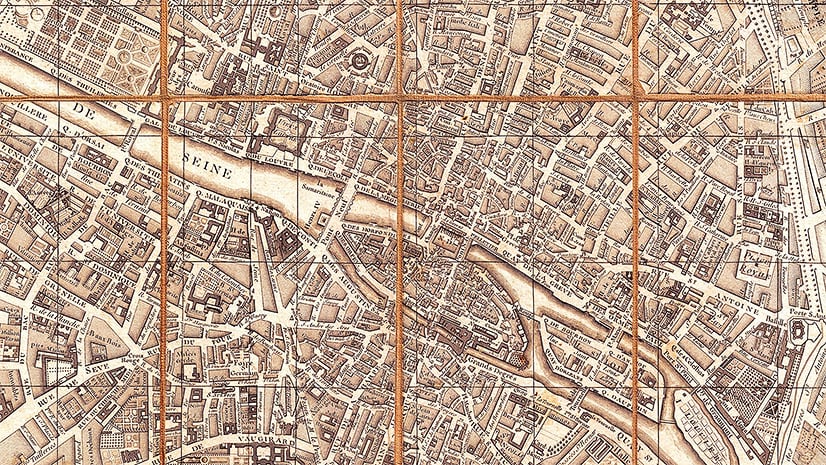
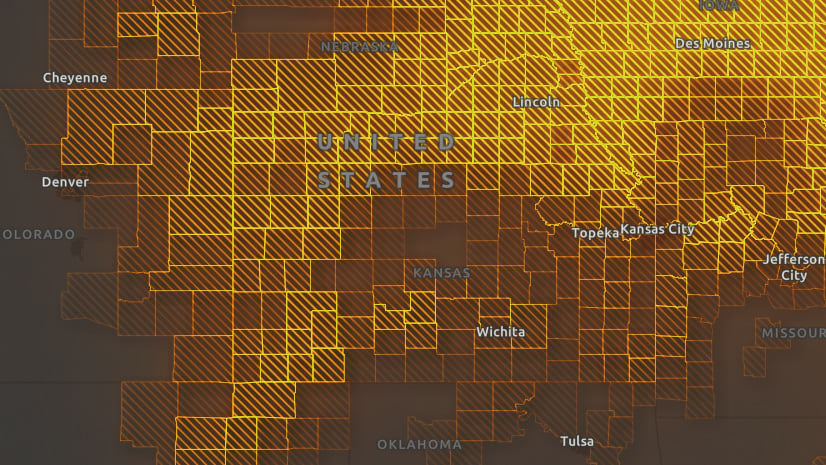
December 8, 2021 | Mark Harrower | Mapping Feature-Specific Effects: The next enhancement for Map Effects
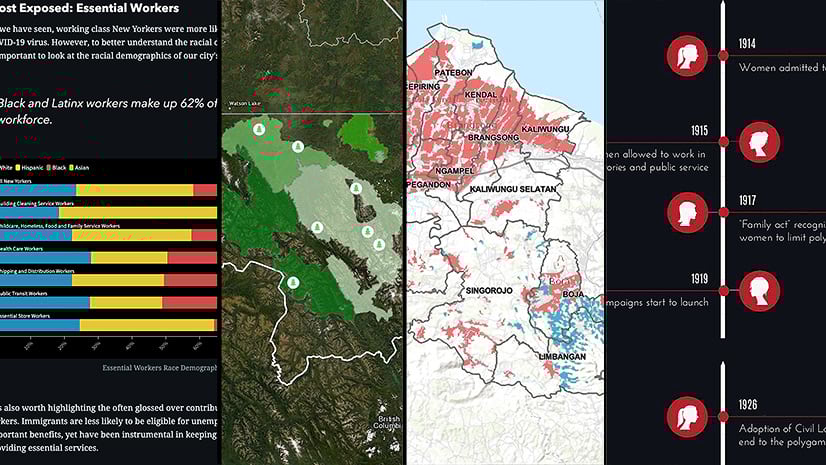
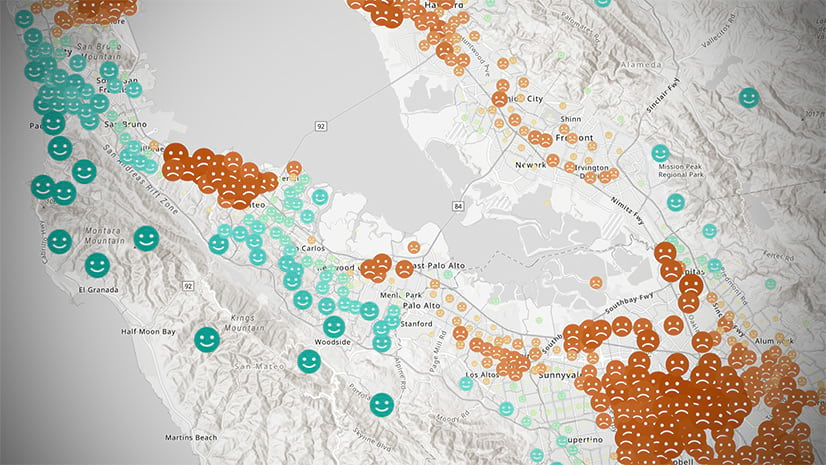
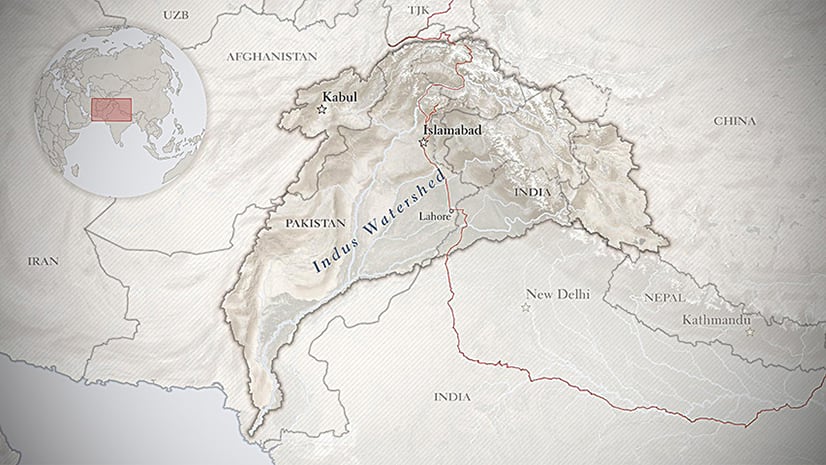
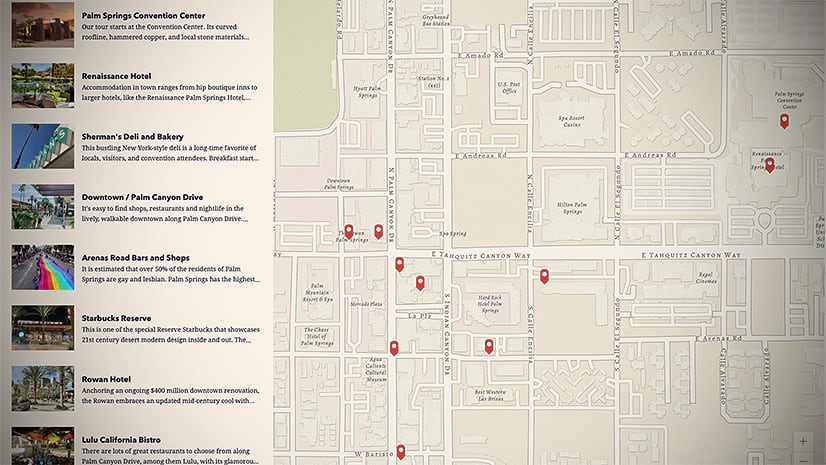
July 12, 2021 | Mark Harrower | Constituent Engagement Seven lessons from the 2020 ArcGIS StoryMaps competition winners
February 2, 2021 | Multiple Authors | Constituent Engagement A guide to working with images in ArcGIS StoryMaps