Joshua Tree National Park, located in southern California, has continued to grow in popularity as the rise in national parks enthusiasts has increased through the pandemic years. The park saw record high attendance, breaking the 3 million visitors mark for the first time in 2021 (see historical park visitor records here). It is stunning and unlike other national parks in that it not only preserves Joshua Trees, contains oases, houses cholla as well other cacti, but also is the location where two deserts, the Colorado Desert and the Mojave Desert, come together. Joshua Tree National Park has an excellent podcast “Where Two Deserts Meet” through which hosts Donovan Smith and Ian Chadwick interview guests and provide detailed information about the park and its resources. It is a great listen for anyone who wants to learn more about the park. Visitors love the park for endeavors such as hiking, rock climbing, and camping. The plant and animal diversity of the park is impressive as are the geologic formations found throughout. It is not difficult to see why people are drawn to and love visiting this area.
Land Management at our National Parks
At the 2023 Esri User Conference, we met with Park Ranger Anna Teagarden for Joshua Tree National Park. In our discussion, we learned all of the roles of park rangers, from public education, resource stewardship, environmental research and conservation; but of all those things, land management in the park was the first thing discussed. It was super interesting to better understand the challenges associated with providing utilities, roads, and infrastructure with a minimum impact to the sensitive landscapes and amazing experiences to be found in these parks.
When visiting facilities such as Joshua Tree National Park it’s easy to see how many of the roles of the park managers and rangers are used to support the various park services. From public speaking and teaching to conservation and facility management, there are a lot of challenging positions that need to be covered. One of the most significant aspects, not often seen, is the process of maintaining and tracking land rights both in the park and along adjacent properties. The process of legally establishing land access and agreements of use is referred to as easements, while incidents or assets that violate land access rights is known as encroachments. To easily visualize these elements, light and agile web maps offer a great deal of benefit for land management both in the parks and for other regional field crews supporting maintenance, research, or public safety.
Exploring an Easement and Right of Way Viewer
As one might imagine, in the park service, conservation of resources is a critical part of the management of the facility. This means that any solution provided would need to have a very intuitive user experience across a diverse range of users. One opportunity discussed had its roots in utility right-of-way management. Large electric and gas utilities have extensive land holdings to include purchased properties and easements for maintenance and support activities. Some of these legal documents can be almost a hundred years old and very challenging to understand without a graphic representation of the boundaries and descriptions. Supporting information such as parcel boundaries, terrain and topography, and cultural features are equally important for using such complex spatial information. In order to properly manage and track these documents, web mapping applications are frequently developed for this use by office engineers and field crews.
In order to build a tool that would meet Joshua Tree National Park’s needs, we started with a web map using Esri’s ArcGIS Web AppBuilder. Joshua Tree National Park has several important layers relating to the park boundaries, camping areas, trails, etc. published and readily available for access through ArcGIS Online. Other relevant data was included, such as sensitive flora and fauna (BLM Areas of Critical Concern), Critical Habitat Polygon Features (Esri _ US Federal Data/Living Atlas), and Vegetation – Joshua Tree National Park (Published by the National Park Service National Resource Stewardship and Science), all of which are also available in ArcGIS Online/ Living Atlas. From those layers, a web map showcasing the desired features was generated for evaluation. Because this map and other derivative products are designed to be utilized by park rangers or field researchers who might have limited experience with GIS solutions, user functionality (i.e., dropping stamps to represent work needed, sensitive areas, or other interactions) tools must be able to be used intuitively with minimal instruction needed. The skillsets to build various user interface capabilities have transitioned from hard coded development to more of a plug and play approach leveraging ArcGIS Web AppBuilder or ArcGIS Experience Builder. For more examples of quick and easy maps focused on user experiences, we recommend that you take a look at the “Map in a minute” Esri blog series by Bern Szukalski, which provides excellent instructions for walking through the steps to create dynamic and powerful web maps. One of these articles focusing on hurricane mapping provides a particularly easy to follow process and can be found here.
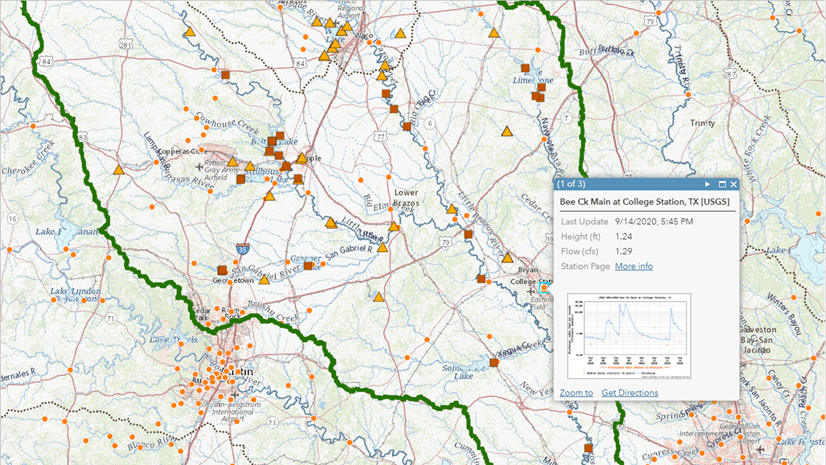
What’s exciting is the ability to use this land management viewer as a first step to a wide range of interesting solutions. For utilities, easement information is frequently shared with maintenance and vegetation crews to ensure landowner rights are not violated. Within the park organizations, this information is critical for rangers monitoring activities, maintenance and even co-utilization with private landowners. With a few changes, this web map can be used to track endangered species’ behavior and habitat, potential hazards such as flash floods, landslides or even trails under maintenance, and even be able to help scientist plan research activities across the park. That means that researchers have clear visualizations of property boundries, permissions, and even points of contact where land use is shared with private owners or other agencies. Because of common park infrastructure, prototypes and proofs of concepts for one park can easily be shared with others, increasing the return on investment and value of GIS capabilities.

The ability to generate spatial tools to visualize land, assets, and usage across agencies such as the National Park Service, forestry corporations, rail, pipe and electric utilities gives significant value toward ensuring property rights are respected and well maintained. Esri Solutions provides ROW and Easement Data Management Solutions with capabilities that deliver a common schema and methodology for ease of deployment and utilization. The ArcGIS Parcel Fabric delivers a more complete framework to manage land boundaries and rights at a higher level of detail. Regardless of size Esri provides the right level of solution to solve your data challenges.
Our National Park System is an absolute treasure worthy of exploration. Places such as Joshua Tree National Park are amazing to see but require a lot of resources to protect and provide access to the public. GIS can provide complex land information in a format that is both easy to use, but also helpful for rangers, scientists, and visitors alike. Next time you visit one of the many parks or other designated areas, think about how GIS can be applied to assist with maintaining, preserving, and enhancing the visitor experience of our national treasures.


Article Discussion: