In addition to being a cartographer, I’m also an artist. More specifically, a printmaker. Recently I made a woodcut print which is also a map. I used ArcGIS Pro to design and plan the project. Let me show you how to make some art with ArcGIS.

What is a woodcut print?
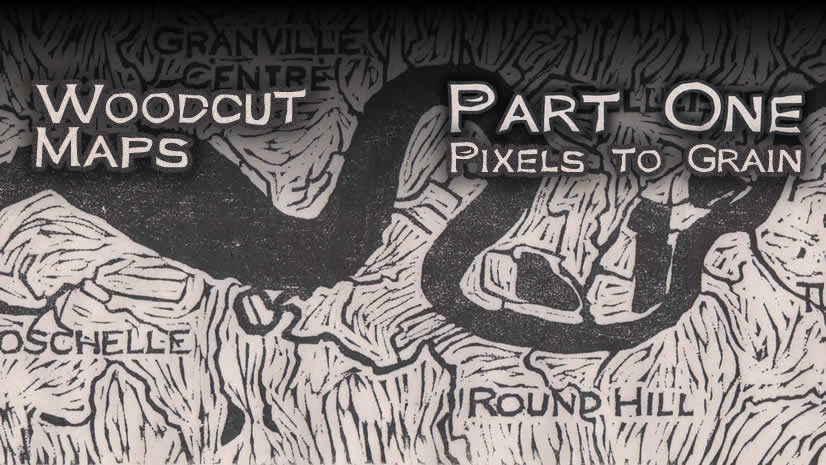
To make a woodcut print, you carve an image out of a flat piece of wood and print it. It’s basically a stamp. You may be more familiar with linocut prints. They’re the same thing, just carved on linoleum instead of wood.
Here’s one of the images I planned for this map. I created this image in ArcGIS Pro.

I transferred this image to a 4×6” block of cherry veneer plywood and carved it out. I carved away all the parts that I wanted to be white in the final print.

When I was done carving, I rolled ink on the block. It only sticks to the parts of the wood that I haven’t carved.

Then I laid some paper on top, applied pressure, and pulled away a print! I repeated this process until I had lots of prints. The point of printmaking, after all, is to create multiples.

It doesn’t look like much yet, I know. This print has three colors, and each color has to be carved and printed separately.
Printmaking and cartography
There are a lot of similarities between designing woodcut prints and designing maps. In both cases you have the real world – an infinitely complex, detailed, and nuanced thing—and you need to simplify it down to mere lines and shapes. Choosing which lines and shapes are the essence of an image or the map is the hard part. You can’t show every road in a country, so which few should you keep to best communicate the transportation network? Similarly, you can’t draw every branch on a tree, so which ones should you pick to best convey the general shape and feel of the tree?
To make a woodcut map, it’s important to understand your limitations – how thin of a line can you carve? How small of a letter? For this print, I chose a small size—only 4×6”—which meant that I had to be careful to keep the map simple and undetailed.
Plan color layers
Like GIS, printmaking works in layers. This is not a coincidence, since maps were previously created using various printmaking methods. However, layers work a little differently in these two worlds. In GIS, each layer holds a different kind of geographic information –lakes, rivers, roads, cities, etc. In printmaking, each layer holds a different color. The limitation is physical – each color must be carved and printed separately.
To plan for this, as I designed my map, I organized the layers into groups: one for each color.
The White layer represents the paper that will not be printed on. It contains roads and label boxes. (I planned to write the city labels by hand inside these boxes later.). The Green layer is the background color—the land. This is the layer I showed in the images above.

The Blue layer contains rivers and lakes. I planned to print it with a transparent blue ink on top of the green layer.

The Red layer contains the remaining cultural features and and is designed to be printed last, with a transparent red ink on top of the green and blue layers.

All combined, the print should look like this:

In this design process, layer order is very important, and requires some sideways thinking. For example, the Canada and USA labels are green, but they are stored in the Blue group layer because they are cut out of the blue lake shape, allowing the green to show through. The White group layer represents the background—the white of the paper—but is listed above the Blue and Green layers so I can see it.
I also created a layout for this map and added some layout elements, specifically a border, title, and scale bar.

Once my map design was complete, I changed the colors to black and exported three image files, representing the three blocks I needed to carve. Then I mirrored the images.

Mirroring is important because the print you pull from a block will always be its mirror image. For some images this doesn’t matter, but for anything with text, it’s important to carve that text backwards. For maps, forgetting to mirror the image would result in flipping east and west.
Carve and print
Once I had my mirrored images, I was ready to carve them into wood and print them onto paper.
You already saw me carve and print the green layer. For the blue layer, I used the reduction method. This means that after I made a sufficient number of green prints, I cleaned the ink off my block and continued carving. I carved away until only the areas necessary for the blue layer were left—I “reduced” the block to a smaller printing area.

Then I printed the reduced block with blue ink on top of the green prints.

I couldn’t use the reduction method for the red layer, because it needed to overlap green, blue, and white areas. Reduction in this case would only be possible if I could carve all of the red areas out of the existing blue areas. So I turned my block over and carved the red image onto the back.

I printed the red on top of the green and blue prints. To finish the map, I added the city labels by hand.

Tips
Do you want to make your own woodcut or linocut map? Here’s my advice:
1. Use ArcGIS Pro to experiment and plan before you touch the carving tools.
2. Don’t get too ambitious. My initial plan was to map all of the Great Lakes. The print was going to look like this:

But then I calmed down and realized I should try something smaller first.
3. Criss-crossing line features are easier to carve out than around. That’s why I chose to make the roads white in my map. If I made them red, for example, I’d have to carve out all of the areas in between the roads, making sure to leave lines of an even width.
4. Don’t use too many labels. I love labeling maps. But carving text into wood is difficult. In this map I made labels that I carved out (the title and country labels) and labels that I carved around (the state and province abbreviations). I’m sorry to report that they were equally difficult.
5. Consider carving out little boxes and writing the labels in by hand. This is the first time I’ve tried this technique, and it was a lot easier than trying to carve letters. I think it looks cute too! If you want to try it yourself, give your labels a white callout background. (I also recommend reducing its margins to 2pt.) Then make the font color white as well so the words disappear.

If you want to see more precisely how the layers are organized and symbolized in this map, you can download the project package. All of the data in this map is from Natural Earth, although some of it has been modified by myself.

Article Discussion: