Over the first half of the year, we’ve expanded analysis capabilities across ArcGIS in ways that continue to equip you with the most powerful methods as well as make it easier to apply, automate, and integrate analysis into enterprise workflows.
From AI tools that leverage embeddings, to predictive analysis workflow enhancements that help you assess results, to deeper integration with cloud platforms for scaled analytics – you’re enabled to generate insights in new ways, make decisions with greater confidence, and increasingly synthesize geospatial analysis with external cloud systems.
As we head into the 2026 Esri User Conference, check out some of the latest analysis enhancements, and find out where you can get more info throughout the event.
1. Predictive Analytics: Evaluate Variable Influence for Predictions
2. AI Tools and Models: Geospatial Embeddings
3. Raster Analytics: Hydrology Modeling Tools
4. Big Data Analytics: GeoEnrichment
5. Graph Analytics: File Knowledge Graphs
6. Real-Time Analytics: ArcGIS Velocity for ArcGIS Enterprise
7. WebGIS: 80/20 Analysis Tool in Map Viewer
8. Automation & Scripting: AI in ArcGIS API for Python
9. Cloud-Based Integrations: Spatially Optimized Parquet Support for Microsoft Fabric
10. Your Guide to Spatial Analytics at UC
1. Predictive Analytics: Evaluate Variable Influence for Predictions
Predictive models can help forecast outcomes, identify risk, and guide decisions, but understanding whether those results can be trusted is often just as important as generating the prediction itself. The new Evaluate Variable Influence for Predictions tool helps you understand which variables have the greatest influence on prediction results and how changes in those variables affect the outcome.
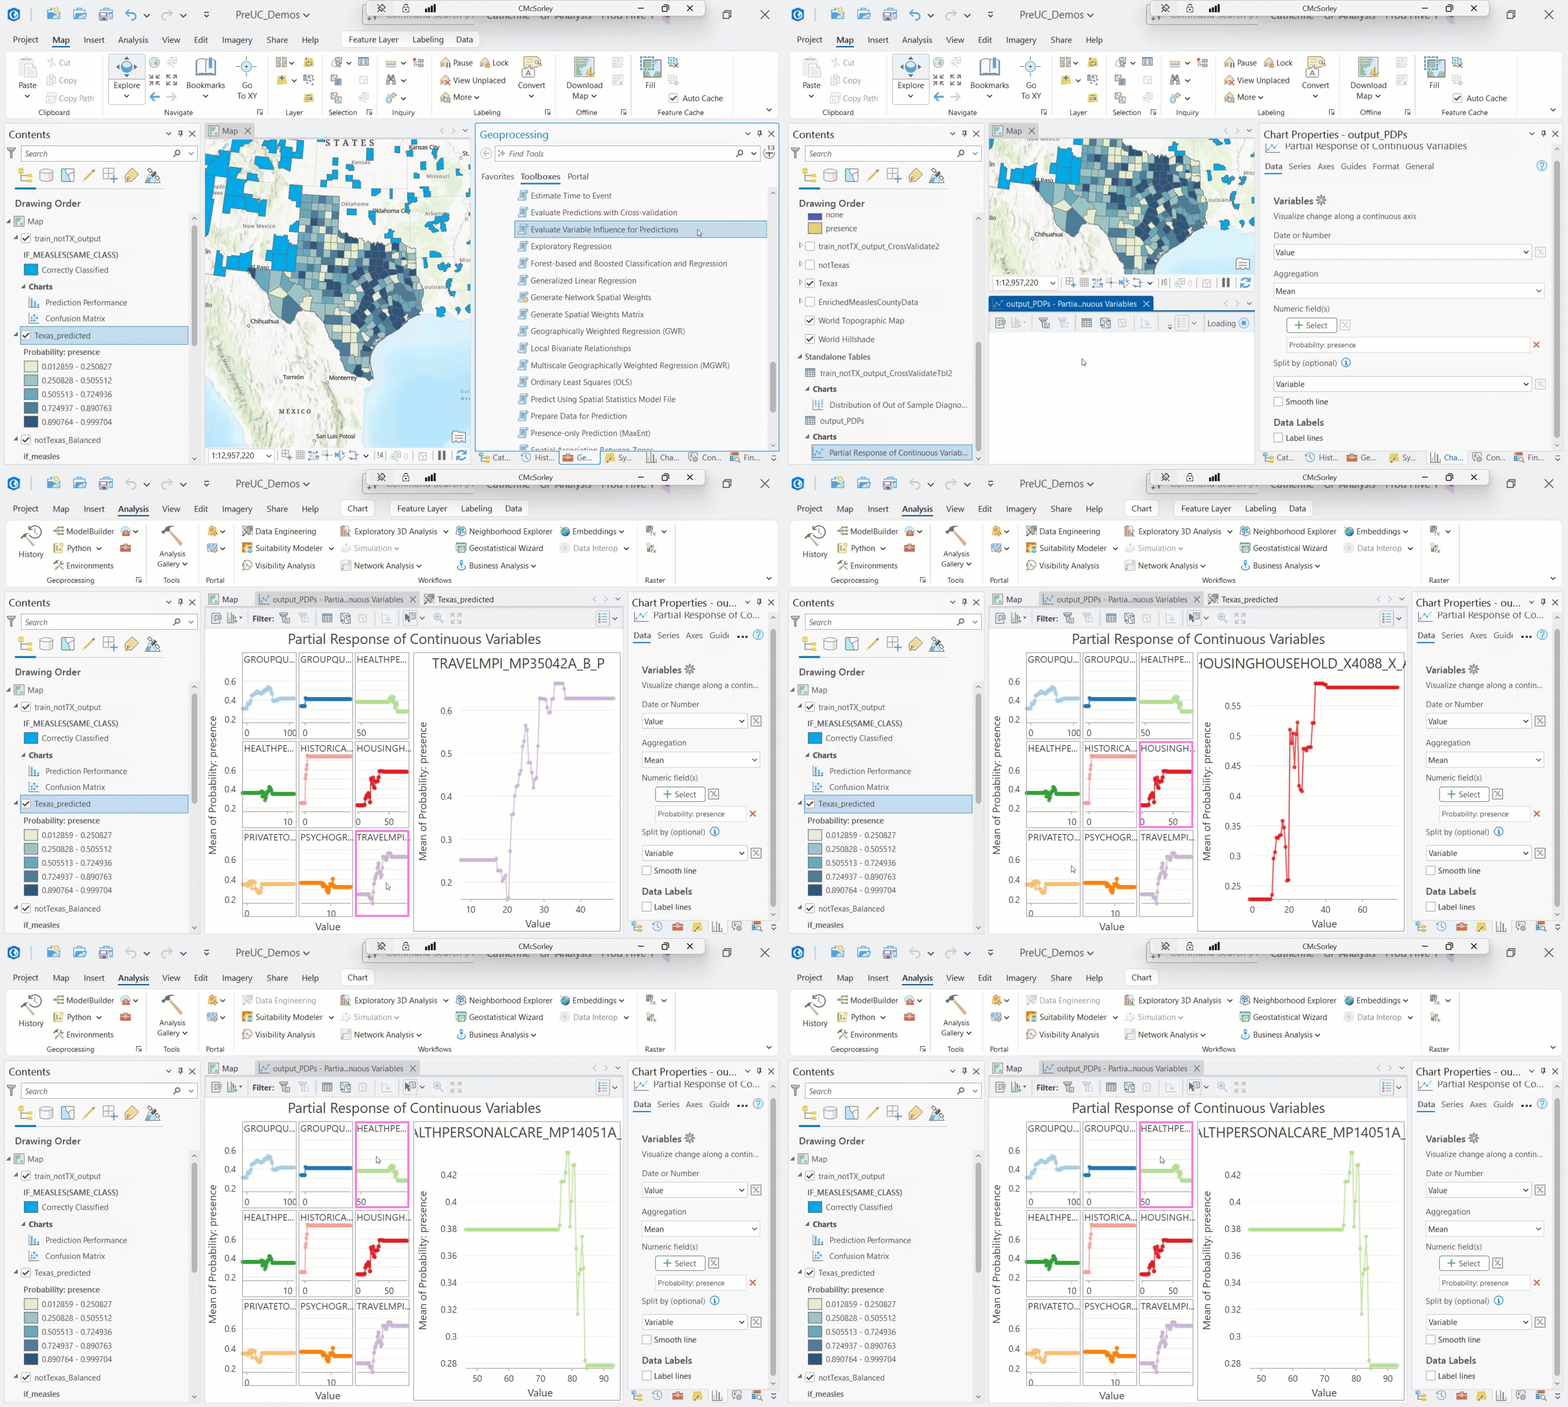
By making prediction models easier to interpret, you can validate your models, explain results to stakeholders, and build confidence in downstream decisions.
Read more in the ArcGIS Pro documentation. Attending UC? Discover sessions focused on the latest in Pattern & Predictive Analytics.
2. AI Tools and Models: Geospatial Embeddings
AI continues to create new opportunities for uncovering patterns in geographic data. With ArcGIS Pro 3.7, new Geospatial Embeddings tools help transform imagery and vector data into embeddings, which are compact numerical representations that capture the characteristics and context of a location. This allows you to identify similar locations, discover patterns that may be difficult to detect through traditional analysis methods, and to augment predictive workflows with additional data.
Learn more in the Embeddings blog. If you’re attending UC, visit us in the AI area and discover related sessions focused on AI Tools and Models.
3. Raster Analytics: Hydrology Modeling Tools
ArcGIS Spatial Analyst introduces several Hydrology Modeling tools that help simplify stream, flow, and watershed analysis while improving the accuracy of results. New tools such as Validate Flow Direction, Generate Breach Lines, Adjust Raster to Stream, and Geodesic Flow Direction help reduce preprocessing requirements and improve the quality of flow modeling outputs.
Whether you’re modeling watersheds, assessing flood risk, or analyzing drainage patterns, these tools help you move from elevation data to hydrologic insights with fewer manual steps.
Explore more in the Modeling What’s Hidden blog. Attending UC? Continue exploring Raster Analytics through these related sessions.
4. Big Data Analytics: GeoEnrichment
The new GeoEnrich tool in ArcGIS GeoAnalytics Engine 2.1 adds geographic context to your data so you can generate more accurate demographic and location-based insights, even when geographic boundaries are complex. Built to scale to billions of records, the tool works directly within existing GeoAnalytics Engine workflows, allowing you to enrich, model, and apply spatial context within your analytics pipelines without moving data outside governed environments.
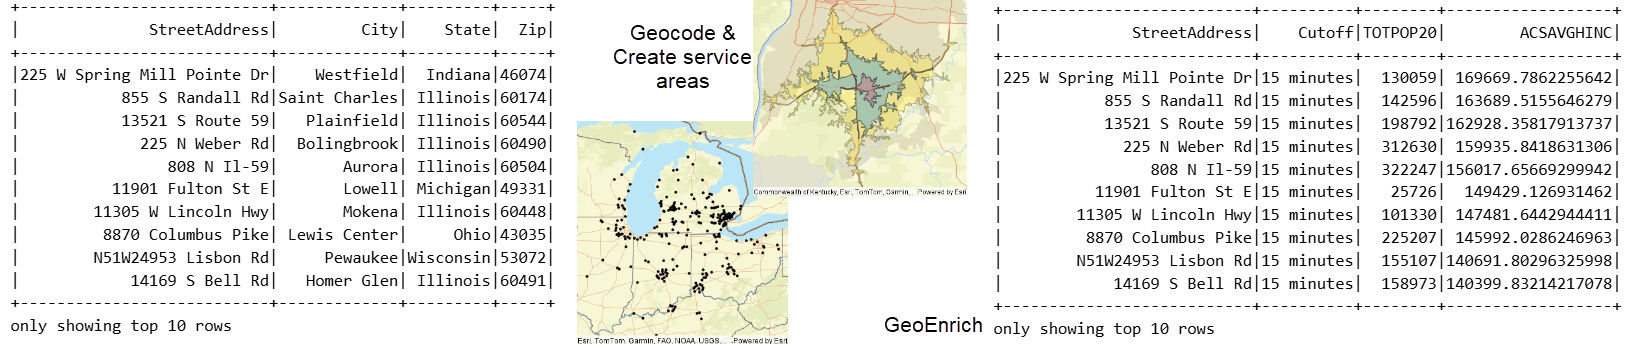
ArcGIS GeoAnalytics Engine 2.1 also includes a sample enrichment dataset with approximately 100 U.S.-based demographic attributes available under your existing license, making it easier to get started with geographic enrichment workflows.
Read more in the ArcGIS GeoAnalytics Engine 2.1 blog. If you’re attending UC, explore sessions focused on Big Data Analytics.
5. Graph Analytics: File Knowledge Graphs
Getting started with graph analytics in ArcGIS is now easier with a new file-based knowledge graph format in ArcGIS Pro 3.7 and ArcGIS AllSource 1.6. File Knowledge Graphs allow you to quickly create, explore, and analyze relationships between people, places, assets, and events, directly from your desktop.
Learn more in the ArcGIS Knowledge 12.1 blog. Heading to UC? Discover sessions focused on the latest in Graph Analytics.
6. Real-Time Analytics: ArcGIS Velocity for ArcGIS Enterprise
With the introduction of ArcGIS Velocity for ArcGIS Enterprise 12.1, real-time analysis for self-hosted environments gets even more powerful. Available for single-machine Windows and Linux deployments, ArcGIS Velocity brings modern feed ingestion and real-time analytics capabilities directly into ArcGIS Enterprise.
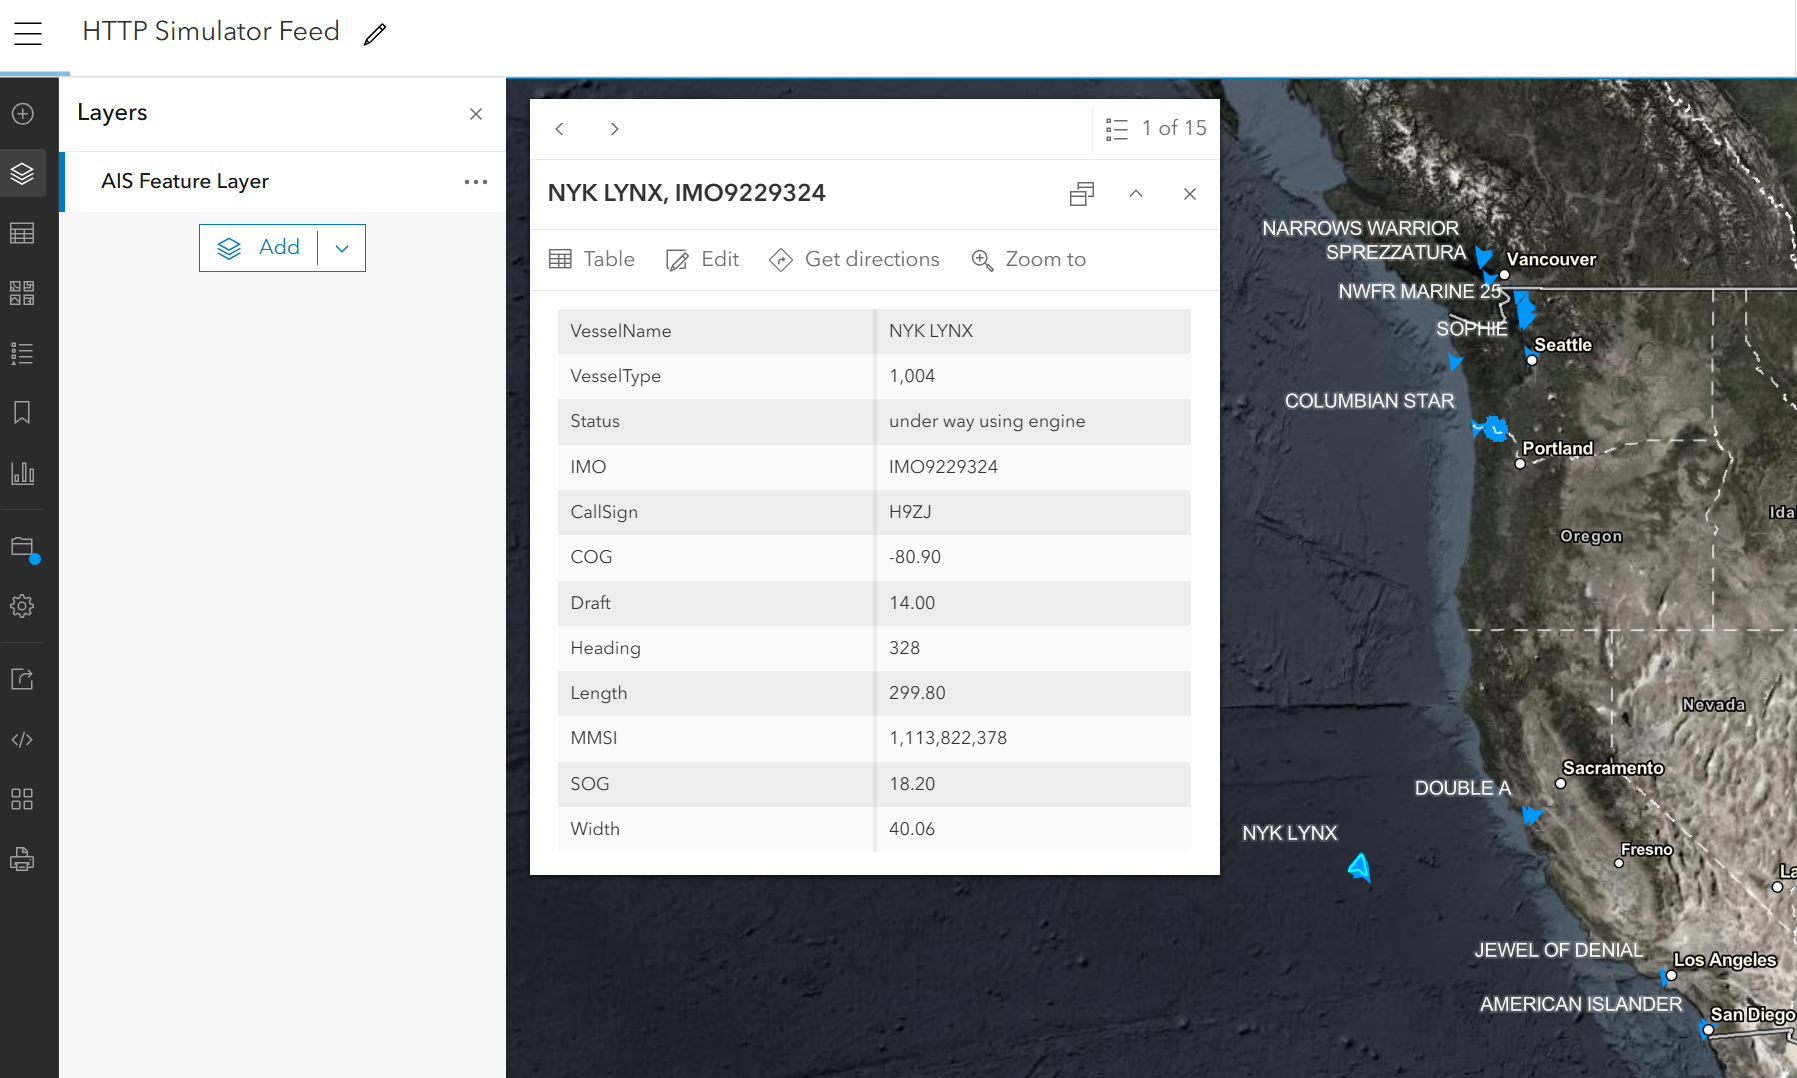
With functionality comparable to ArcGIS Velocity in ArcGIS Online and support for the same real-time workflows available in ArcGIS GeoEvent Server, you can monitor, process, and analyze streaming data while keeping operations within your own infrastructure.
Explore more in the ArcGIS Velocity for ArcGIS Enterprise blog. If you’re attending UC, don’t miss these relevant sessions on Real-Time Analytics.
7. WebGIS: 80/20 Analysis Tool in Map Viewer
Understanding where incidents are most concentrated is often the first step toward taking action. The new 80/20 Analysis tool in Map Viewer automatically identifies disproportionate concentrations within spatial data, such as when approximately 20 percent of locations, offenders, or victims account for 80 percent of total events. By applying the 80/20 principle to your analysis, you can pinpoint critical hotspots, optimize resource deployment, and design more targeted intervention strategies where they can have the greatest impact.
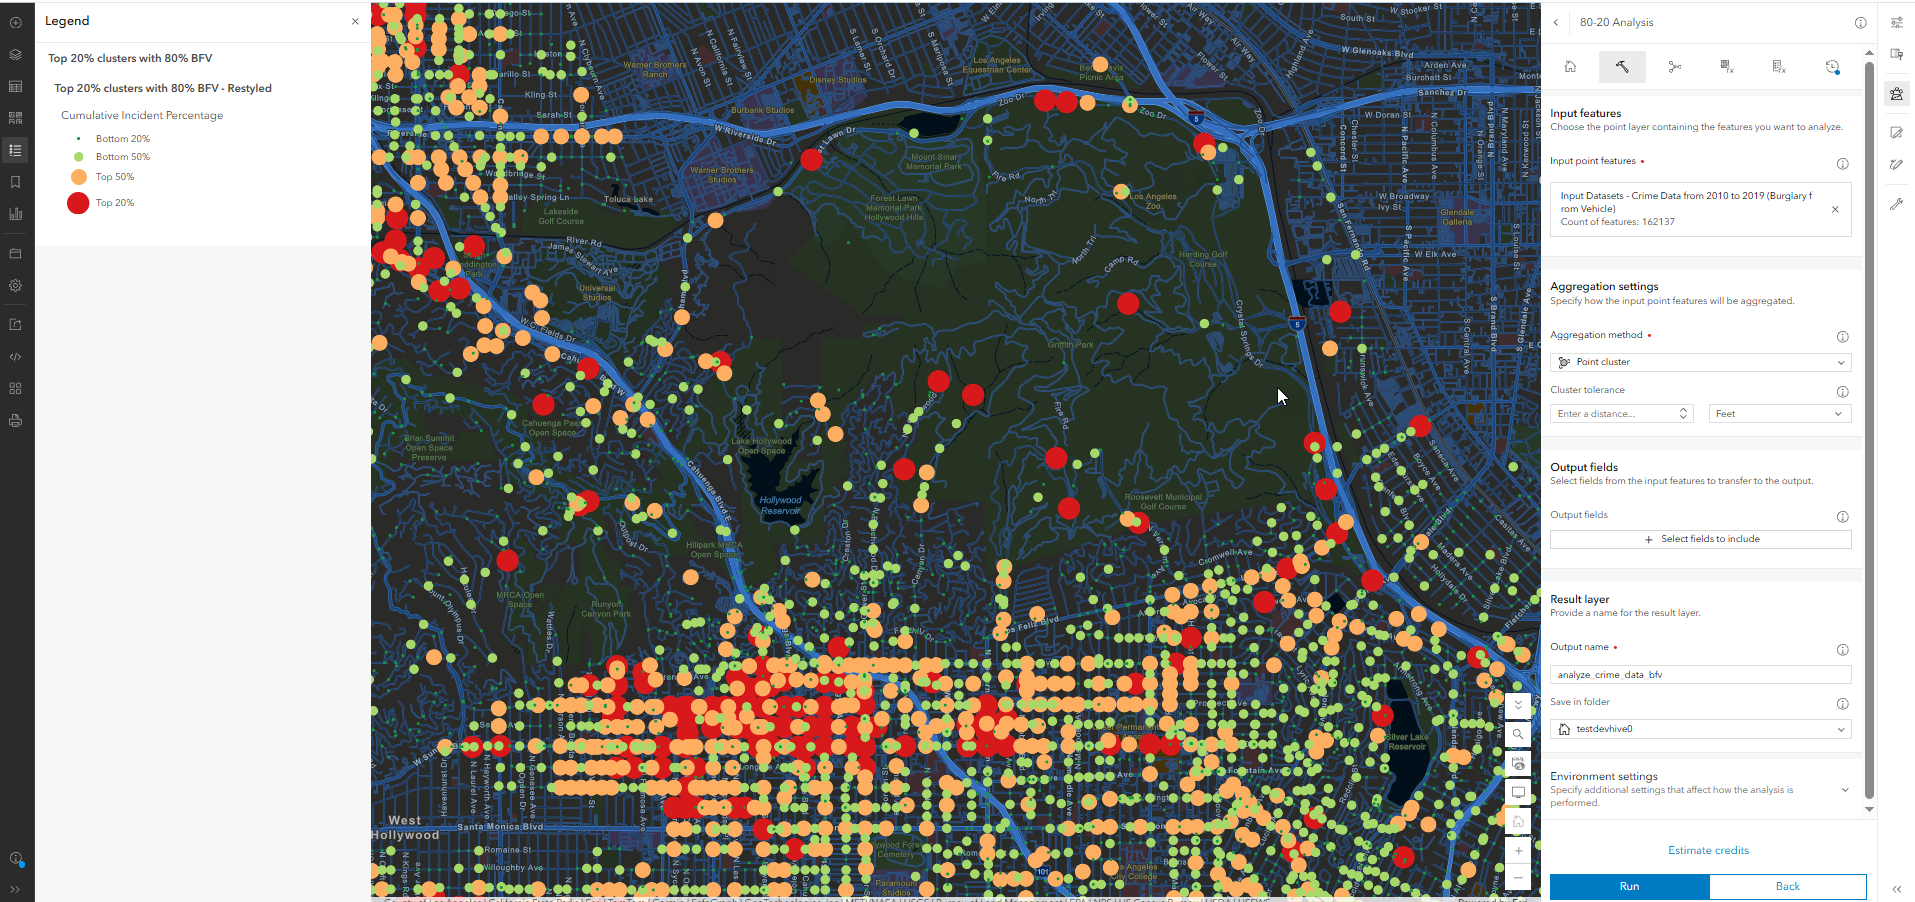
Read more in the 80-20 Analysis documentation. If you’re attending UC, explore the WebGIS Analysis related sessions to learn more.
8. Automation & Scripting: AI in ArcGIS API for Python
ArcGIS API for Python 2.4.3 introduces arcgis.ai, a new module that brings image and text analysis capabilities into a dedicated home within the API. Whether you’re experimenting with AI in notebooks or building repeatable workflows, arcgis.ai helps bridge the gap between exploration and production. The module expands the API’s built-in API capabilities with tools for image analysis, document summarization, text extraction, and translation, making it easier to automate workflows and incorporate AI into your GIS processes.
Learn more in the ArcGIS API for Python 2.4.3 blog. Stop by the Developer Technologies area and explore related Automation & Scripting content and sessions.
9. Cloud-Based Integrations: Spatially Optimized Parquet Support for Microsoft Fabric
As spatial datasets continue to grow in size, performance and interoperability become increasingly important. ArcGIS Maps for Microsoft Fabric now also supports parquet as a native data source, allowing you to visualize and analyze spatial data stored in OneLake without moving or duplicating it. Additionally, new support for creating spatially optimized parquet files in ArcGIS GeoAnalytics for Microsoft Fabric Runtime 2.0 helps you prepare these large datasets for use in ArcGIS Maps for Microsoft Fabric or ArcGIS Maps SDK applications.
Together, these enhancements make it easier to work with large-scale spatial data and bring faster, more scalable spatial analytics directly into Microsoft Fabric workflows.
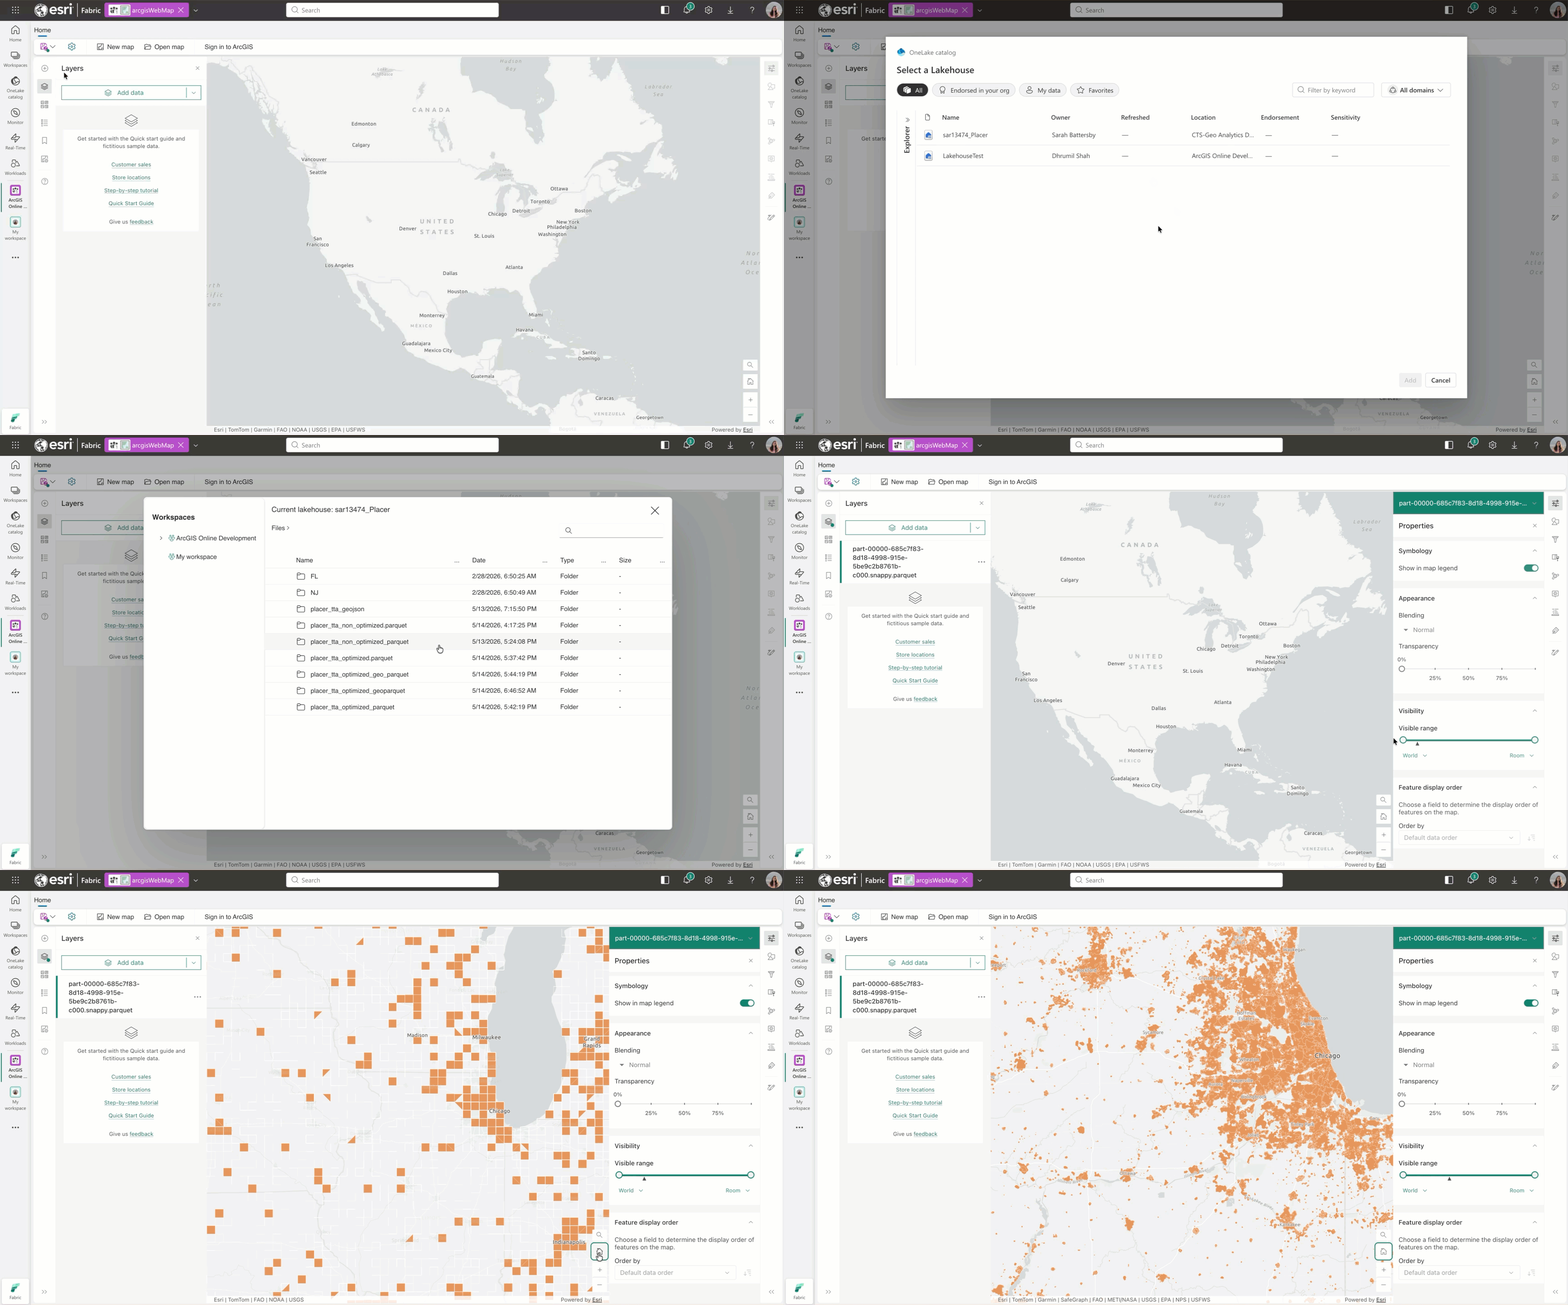
Going to UC? Visit us in the ArcGIS Apps area and attend Integrations with Microsoft related sessions for a deeper look.
Your Guide to Spatial Analytics at UC
Interested in learning more about these new capabilities? Visit the team in the Analytics showcase area at the 2026 Esri User Conference to connect with product experts, explore the latest innovations, and see how these workflows can support your organization.
Don’t miss the spatial analytics spotlight – Analytics and Data Science and ArcGIS, where we’ll highlight recent advancements across analytical methods and evolving the experiences and approaches for generating advanced analytical insight, as well as share powerful examples of applied analysis across the geospatial community.
Ready to take a deeper dive? Use the following custom agendas to find sessions on these topics and capabilities:




Article Discussion: