It’s almost the end of the year, and the ArcGIS Business Analyst team has been busy working on highly anticipated features for this December’s ArcGIS Business Analyst Web App 7.4 Release.
This release includes the following new features for ArcGIS Business Analyst Web App: Void Analysis, New File Format Types for Attachments, 360-degree and Panoramic Image Support in Image Viewer, Infographics Template Gallery, Custom Data File Import, and Data Updates.
Void Analysis
If you are a commercial real estate owner or a property manager, you probably have had vacancies you needed to fill. To ensure you are reaching out to the right tenant to fill your vacancy, you’ll want to analyze your site’s trade area for gaps in specific businesses against other similar areas. The Void Analysis tool analyzes hundreds of potential businesses against your trade area and returns businesses that are missing.
To run this tool, click the Maps menu, Run Analysis from the submenu bar, and click Void Analysis workflow from the dropdown menu. Add your trade area boundary and a reference area boundary to compare against. Then add business categories that you want to analyze. The results table shows the gaps or surplus of business categories. You can also dive deeper into a detailed list of businesses by expanding the table or export them to PDF or Excel files. You can also view a step-by-step tutorial video here.

Site Attachments – Attach New File Formats
One of ArcGIS Business Analyst Web App’s many benefits is its ability to help you keep and organize various types of information about sites on your map. Such information includes site attributes, notes, photos, and reports. With this release, you can now attach even more information such as floorplans, leasing information, financial documents and others. Supported file formats include PDF, DOCX, XLSX, PPTX, as well as URLs of videos and images.
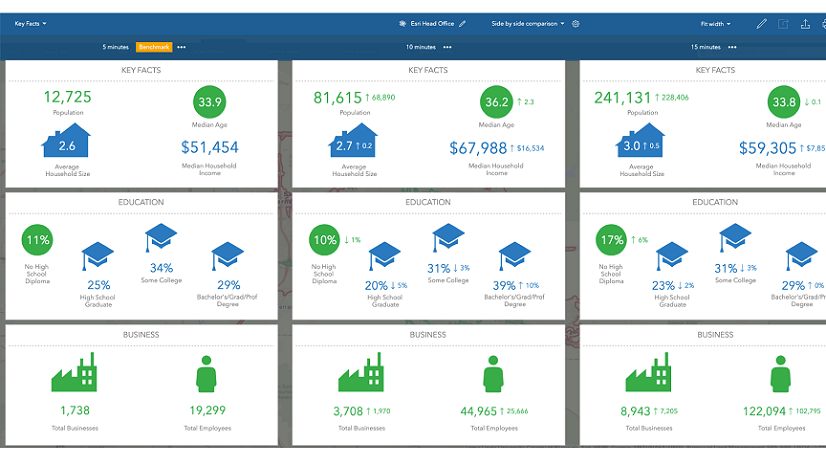
Infographic Template Gallery
The ease of creating Infographics in ArcGIS Business Analyst Web App allows you to present your analysis in a beautiful, informative, and ready-to-use infographics templates in a matter of seconds. With the latest release, you can access even larger number of infographic templates and add them to My Templates tab to run or customize to your need. In the Build Infographic page, you will now see an Add template link that allows you to launch a curated Infographic Template Gallery where you can search through visually compelling templates or filter them using tags by categories such as demographic, disaster, education, health, and more.

Image Viewer – View 360 Degree and Panoramic Images
ArcGIS Business Analyst Web App currently supports images for each location on your map. On-site images can help stakeholders visualize the spaces being considered for lease or purchase. To obtain a more immersive experience of the sites, the Image Viewer now supports 360 degree and panoramic images. You can upload a 360 degree or panoramic image as you would any other image type by clicking Add Photo in the Site Details panel. (To access Site Details panel, go to the Map View of Projects panel, click on the ellipse or three small dots next to the site layer in Point Locations layer, then click “Show Details” link). Once uploaded, you should see the 360 degree icon on the top left of the image. Click into the uploaded image and then click on the expand icon to launch a full-screen view. You will now be able to pan 360 degrees (or across for panoramic images).

Create Custom Data Using your Files
During your site analysis, you may come across more accurate or project-specific point data or boundaries that you want to upload and use in Color-Coded Mapping, Smart Map Search, or Suitability Analysis. In addition to creating custom data with existing web layers, the 7.4 release now allows you to Select a file to import in Custom Data Setup under Maps, Add Data section. Supported file types include Excel files and Shapefiles.

Once you have uploaded the file, you have the choice of selecting either geographic boundaries or point data. For geographic boundaries, select the geographic boundary level and the geography name or ID column from the file you are uploading. ArcGIS Business Analyst Web App will save the layer under your “Other Layers” in your project. You then have the option to “Add Layer to Map” or “Setup Custom Data”. You can drag and drop the appropriate variables to a category as you would for a web layer custom data setup. Boundary layers you upload will be available for Color-coded mapping, smart map search, suitability analysis, and reporting. Point data files will be set up in a similar manner and will be available for competitor or companion layer that you can add in site suitability analysis or for creating drive-time areas or other boundaries.
Data Updates
This release also includes data updates for the following:
- USA business locations and traffic points
- Spain (AIS)
- 23 MBR Countries
We hope you enjoy these new ArcGIS Business Analyst Web App 7.4 features. As always, we look forward to your feedback and comments.
If you have not tried ArcGIS Business Analyst Web App and want to test out its features, you can learn more here or download a trial version from here.
Resources
Below you can find some links for Business Analyst that you may find useful:
- Business Analyst product overview page
- Business Analyst resources page
- LinkedIn user group
- Business Analyst YouTube playlist
- GeoNet community
- Business Analyst Web App login page
- Business Analyst help and documentation pages
- Email the team: businessanalyst@esri.com
From our team to yours, happy holidays and happy mapping!


Commenting is not enabled for this article.