
Since the release of the ArcGIS Business Analyst extension for ArcGIS Pro, people have approached me at the Esri User Conference, at industry events, and even in the halls of Esri, to ask which tools and features are currently in Business Analyst for ArcGIS Pro and what resources are available. The purpose of this blog is to answer these questions directly in an easy-to-read manner that can be understood by both GIS professionals and business leaders alike.
As new tools, features, and resources become available for Business Analyst for ArcGIS Pro, we’ll release new blogs to reflect the updates.
A lot of ground is being covered in this blog, so we have added some anchor links for easy browsing.
- Jump to Mapping and Analysis Tools
- Jump to Reports and Infographics
- Jump to Suitability Analysis Tools
- Jump to Trade Areas Tools
- Jump to Territory Design
- Jump to Features
- Jump to the Resources
Investigate with Mapping and Analysis Tools
The Calculate Market Penetration tool helps to identify how much of a given area (market) has been captured based on the total number of customers in the area compared to a demographic variable that is chosen by the user.
Business example: Janice is an analyst at a shoe distribution company that operates in the Southern California region. Part of her role is to calculate total market share and other important statistics about her area of responsibility. Using the Calculate Market Penetration tool, Janice can measure how much of the shoe market her company has captured by comparing the company’s data to the total population of the area or even the total number of customers that have purchased shoes in the area within the last year.
You can read more about the Calculate Market Penetration tool here.

Color-Coded Layers provide authoritative maps to visualize any attribute in your data. By adding an ombré color effect (color from dark to light) to your areas of interest, you can explore patterns and reveal insight with demographic information, consumer spending patterns, and other market conditions. From areas the size of a state down to the block group level, you can quickly identify important patterns in the area you are investigating.
Business example: Bill works for a commercial real estate company and he’s just taken over as an account manager for a new area. Bill is interested in exploring the areas in his territory that have a high concentration of warehouses. He can create a Color-Coded Layer that will show him the areas with the highest concentration of businesses that fall under the NAICS code for warehousing.
You can read more about Color Coded Layers here.

After you’ve identified an area of interest, the Enrich Layer tool enhances your data by adding demographic or other information to your locations. This allows you to bolster your understanding about the people and places in or around your areas of interest.
Business example: Alice is the head of a marketing department at a large casino in Las Vegas, NV. Using her rewards program data, she has identified the top 25 zip codes that have yielded the most visitors to her location. Because she just secured a contract with a print marketing agency, she wants to place advertisements in the mailboxes of the residents within the best zip codes.
Using the Enrich Layer tool, Alice can visualize which zip codes would be best to advertise specific features her casino provides. For instance, she can identify which are best to target with information about shows and entertainment, which are better to highlight fine dining options, and which are best to share the casino’s nightlife activities like nightclubs and other attractions.
You can read more about the Enrich Layer tool here.

In the recent past, it was difficult to visualize spatial relationships between entities – customers and stores, students and schools, patients and their medical providers, etc. Users can now visualize these relationships and measure the distances between each pair using the Generate Desire Lines tool. Distances can even be calculated as straight-line or network-based – like drive times, drive distances, walk times, and more.
Business example: Frank is the owner of a chain of grocery stores and is planning to open his sixth location. Before he signs the final paperwork, he’s interested in identifying the relationship between his customers and the stores they visit. After using the Generate Desire Lines tool, Frank can see that the proposed location for his sixth store could take customers from an existing one, while not adding enough additional revenue to justify the expansion to that specific area. Seeing that there is too much overlap, he can do further research to find a new location for the sixth store, solving the overlap problem.
You can read more about the Generate Desire Lines tool here.

Create Reports and Infographics to Share Your Work
An Overview of the Reports Toolset
The Reports toolset in ArcGIS Pro is now available to all Pro users. These reports, taken directly from the ArcGIS Business Analyst Web App, allow you to take a data-driven approach to validate assumptions about location. In these reports, users can combine proprietary data on locations with data about prospective customers, clients, or patients using current-year data and five-year projections.
You can read more about the Reports toolset in ArcGIS Pro here.

The reports in ArcGIS Pro are taken directly from the ArcGIS Business Analyst Web App, giving desktop users access to six types of reports.
Business: Better understand the demographic makeup of the areas around your locations, identify new sites, discover where your competitors are, and so much more.
Consumer Spending: Explore customers’ purchasing habits to better understand their preferences. With Customer Spending data, you can identify the areas with the greatest potential customer reach.
Demographics: It’s important to understand how the population in an area of interest changes over time. Demographic reports help you use that data to improve your business forecasting and planning efforts.
Maps: Visualize your current and potential sites, consumer patterns, trends, concentrations of customers, and event traffic patterns around a specific location.
Market Potential: Understand customer and community preferences and reach the underserved. With Market Potential reports, you have access to more than 2,000 variables grouped into 35 categories like retail market potential, electronics and internet marketing potential, health and beauty market potential, and much more.
Tapestry Segmentation: Esri’s Tapestry Segmentation classifies areas into 67 unique segments based on demographics and socioeconomic characteristics to provide an accurate, detailed description of America’s neighborhoods. You can use this information to develop a deeper understanding of the people who make up the communities in and around your areas of interest.
Business example: Jennifer works in the economic development department for a city with a population of over 250,000. Every quarter, Jennifer has a standing meeting with her team to review the areas where the city can bring in new businesses or increase the quality of life for residents. In these meetings, she is expected to provide a report to the team that will help them determine the best types of businesses or attractions to bring to the city based on the community makeup.
Using reports in ArcGIS Business Analyst, Jennifer highlights the Tapestry Segmentation, demographic makeup, consumer spending, and market potential for the identified areas. After running the reports, she delivers a digital version via email to all invited meeting attendees and prints the reports for the executive leadership in the meeting. With access to these reports, the economic development department can make informed decisions around the steps they take to continue to grow their city.
You can read more about Summary Reports in ArcGIS Pro here.

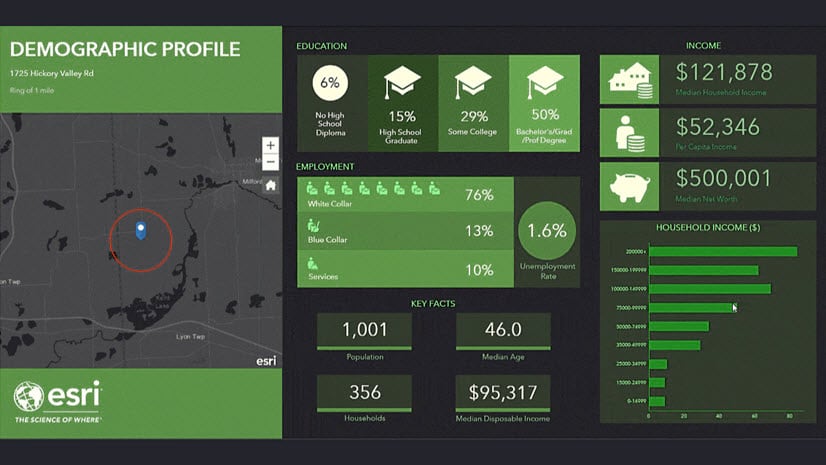
Beautiful, Interactive Infographics
Infographics in ArcGIS Pro present an array of information using small, dynamic charts and reports making it the perfect option to share your work and research using ArcGIS Business Analyst. Infographic templates are taken directly from the ArcGIS Business Analyst Web App, giving you the ability to fully customize your own infographic templates to share with your organization.
Business example: Alex is an analyst for a large commercial real estate company and works in their Manhattan office. As part of her role, she needs to conduct an in-depth analysis of the locations in the company portfolio, identifying which properties are best suited for their clients. Her current project involves a large customer that is planning on opening a new flagship location in the heart of Manhattan. This customer, a sports-fashion apparel company, needs a location that will justify the high price of New York City real estate.
After an in-depth analysis in ArcGIS Business Analyst, Alex needs a simple, creative way to share her findings. Using the Infographics tool, Alex can share her customized, branded, and stylized fact sheets with her sales department who can then immediately share it with the customer. With ArcGIS Pro and the customization options in the ArcGIS Business Analyst Web App, infographics can be as easy as using the included templates or a branded, customized, and corporate-approved template that can be reused for each new project.
You can read more about Infographics in ArcGIS Pro here or you can watch our YouTube video that outlines how to Use Interactive and Beautiful Infographics in ArcGIS Pro.

Suitability Analysis
An Overview of the Suitability Analysis Toolset
The Suitability Analysis toolset gives ArcGIS Business Analyst users the ability to interactively compare, score, and rank locations of interest based on multiple selection criteria. Simply select the criteria that you have identified as critical (such as existing competitors, distance, income, spending, and so much more) and then make adjustments to the weighting to watch the site scores and ranks update in real-time. These tools are fully integrated which means users can share their findings across the organization.
Business example: Tony is the regional business development manager at a specialty car rental company. Tony’s customers are dealer partners who need to be able to provide complimentary rentals to their customers while their cars are undergoing services and repairs. This partnership allows the dealer to provide a rental without the need of maintaining a rental car fleet of their own.
Tony wants to expand into the Chicago area and has already identified 16 potential new sites. Using the Site Suitability tools, he created a ten-minute drive time area around each of the sites to use for the analysis. Next, he added all of the potential customers, competitors, the total number of households, and the amount spent on auto service. Tony applied weights to the criteria he selected and was able to determine the best place to expand his growing business.
You can read more about the Suitability Analysis toolset here.

Trade Areas
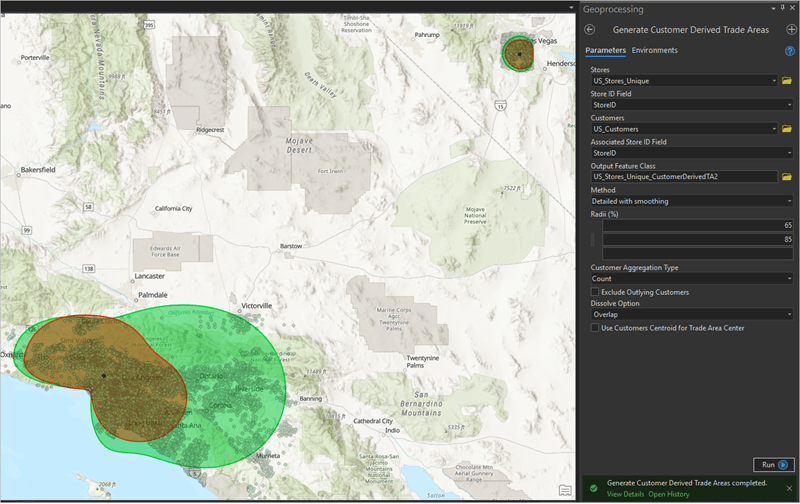
Generate Customer Derived Trade Areas
A customer derived trade area is a custom area that is created by identifying locations that meet specific criteria relative to your customer base. Users can create a customer derived trade area to represent the closest 30%, 50%, or 70% of customers by straight-line, drive-time, or walk-time distance alongside other criteria such as the amount customers spend in the store, household income, and frequency of visits. Additionally, the selected criteria can be combined and weighted to do the analysis with the greatest emphasis placed on the criteria that’s most important to the user.
Business example: Julio owns three skateboard shops in the San Diego, CA area and wants to understand where the greatest volume of his customers live. He needs to determine where the best areas are to place outdoor ads like billboards, point of sale displays, and bus stops (or even where to focus some guerilla advertising efforts). Using ArcGIS Business Analyst, Julio was able to find the best areas to advertise within a 15-minute drive-time of each of his stores based on the following criteria: amount spent by the customer each month, average disposable income by household, and the average number of residents in households ages 13-18.
You can read more about the Generate Derived Trade Areas tool in our documentation or in this blog written by Kyle Watson.
Generate Geographies from Overlay
The Generate Geographies from Overlay tool allows users to identify common administrative boundaries that fall within another boundary. Essentially, this tool calculates how much of one area intersects another.
Business example: Kyle owns a local newspaper in a small Michigan town and wants to identify all census tracts within a 30-minute drive time from his headquarters. These “sub-geographies” allow for him to conduct a granular level of demographic analysis specific to each census tract which will help him find new subscribers. However, Kyle also wants to locate and analyze the zip codes within his delivery zones to see how these overlap with the subscriber areas for a neighboring city’s newspaper.
You can read more about the Generate Geographies from Overlay tool here.

Generate Standard Geography Trade Areas
Standard geography trade areas are based on standardized administrative boundaries. For instance, in the United States, standard geographies are areas like states, counties, census tracts, zip codes, block groups and more. The Generate Standard Geography Trade Areas tool in Business Analyst for ArcGIS Pro allows users to create a trade area based on a standard geography. Individual trade areas can be created for each unique geography that is selected or you can create a single layer that has multiple trade areas like all of the counties in a given U.S. state.
Business example: Beatrice works for a marketing research firm and is interested in identifying purchasing patterns around the Nashville, Tennessee area. She already has zip code data, but needs research at a more detailed level. Using the Generate Standard Geography Trade Areas tool, Beatrice is able to select the individual census tracts in the greater Nashville area that she’s interested in conducting her research on. With the areas selected, she then uses a combination of her primary research data alongside data she was missing that is provided by ArcGIS Business Analyst to identify purchasing trends for those that live and work in the city.
You can read more about the Generate Standard Geography Trade Areas tool here.

Territory Design Toolbox
In the recent past, and even in some modern companies, the process of designing sales or account management territories is often done by a manager based on instinct, experience, and the loudest voices on the sales team. The Auto-Balanced Territories tool gives users the ability to create territories that automatically adjust based on identified criteria such as size, number of accounts, population, potential customers, and more.
Business example: Jeff is a regional sales manager for a material handling company and he wants to use data in order to create territories that are evenly distributed among his account managers. Currently, Jeff relies on his experience, sales by territory, and feedback he receives from the field. Jeff has six account managers for the greater Los Angeles area so creating balanced territories has always proven to be tough.
Using Auto-Balanced Territories in ArcGIS Business Analyst, Jeff specifies the area using zip codes for the six territories he wants to create. Next, he tells Business Analyst that he wants the areas grouped by attributes that matter to his business such as total sales opportunities in dollars by zip code for the last five years, counts of potential customers based on NAICS codes, and maximum drive times. Once Jeff updates the criteria, he’s able to weight each attribute by importance. Business Analyst then automatically creates six balanced territories based on the identified criteria.
You can read more about the Territory Design toolbox in our documentation or this blog written by Tony Howser.

Interactive Territory Creation and Management
After you’ve created a territory using Business Analyst for ArcGIS Pro, it’s easy to “fine-tune”, modify, and make updates. My colleague Tony Howser wrote a blog about territory design management in Business Analyst for ArcGIS Pro and I believe that it would be best to quote him directly. Here’s what he said:
“The individual areas forming your territories can be selected, moved, and removed using a number of options including simple panel, ribbon, and map-based tools; and attribute tables and charts associated with the alignment layer. And since the territory design and management tools work with standard map layers, you can use all of the capabilities of ArcGIS Pro, including advanced selection tools, to work with the individual area features that are the basis for your territories.
“After your territories have been created or updated, they can be shared with your organization as paper maps, PDFs, web maps, tables, and more.”
– Tony Howser, Esri
You can read more about the Territory Design toolbox in our documentation or this blog written by Tony Howser.

Features
Bring in and Use Your own Data Alongside Esri Demographics
Businesses now have access to more data than they have ever had before. In fact, according to the Pragmatic Institute, 90% of the world’s data was generated in just the last two years. But endless data is only valuable if you have an effective way to analyze or work with it in a way that aligns with your strategy. With Business Analyst for ArcGIS Pro, users have the ability to bring in and use their own data alongside Esri’s data.
Business Example: Lincoln wants to make a map that analyzes the areas near his Temecula, CA winery based on multiple criteria – sales by customer, disposable income, and an index of wine consumption away from the home. Lincoln can do this by bringing his sales data into ArcGIS Business Analyst to analyze alongside Esri’s data using one of the tools listed above.
You can read more about the data that’s available in ArcGIS Business Analyst here.

Additional Business Analyst for ArcGIS Pro Resources
Bookmark these ArcGIS Business Analyst Links:
- Business Analyst product overview page
- Business Analyst resources page
- LinkedIn user group
- Business Analyst YouTube playlist
- Business Analyst GeoNet community
- Business Analyst help and documentation pages
- Email the team: businessanalyst@esri.com
Business Analyst for ArcGIS Pro Blogs:
- Seven New ArcGIS Infographics Available (Apr. 2019)
- GO PRO! How to Access Custom Reports & Infographics in ArcGIS Pro (Mar. 2019)
- What’s New in Business Analyst for ArcGIS Pro 2.3 (Jan. 2019)
- Four Exciting Tools in Business Analyst for ArcGIS Pro (3 min. read) (Oct. 2018)
- New Site Suitability Analysis Workflow and Tools in Business Analyst for ArcGIS Pro 2.2 (Jun. 2018)
- New Territory Design & Management Tools in Business Analyst for ArcGIS Pro 2.2 (Jun. 2018)
- Business Analyst Comes to ArcGIS Pro! (Jan. 2018)


Commenting is not enabled for this article.