The newest release of ArcGIS Business Analyst has arrived just in time for the 2019 Esri User Conference! There are many updates arriving with this release, but we’ve compiled the key highlights below.
We’re covering the full ArcGIS Business Analyst suite in this blog, so we have added some anchor links for easy browsing.
- Jump to the Business Analyst Web App
- Jump to the Business Analyst Widget for Web App Builder
- Jump to the Business Analyst Extension for ArcGIS Pro
- Jump to the Business Analyst Mobile App
- Jump to the Resources
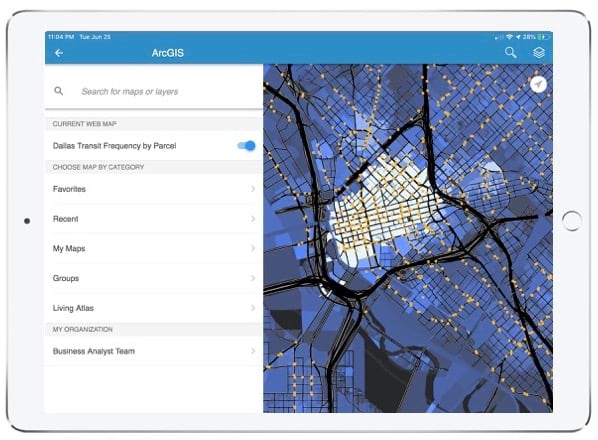
ArcGIS Business Analyst Web App
Updated 2019/2024 US Demographics Online Data
Every year, Esri’s Demographic Data Development team releases an annual update of US demographic data; this year is no exception.
Here are the demographic and data updates that are now in the Business Analyst Web App:
- 2019/2024 estimates and projections for US demographics.
- Consumer spending data now includes 2024 projections in addition to the latest 2019 estimates.
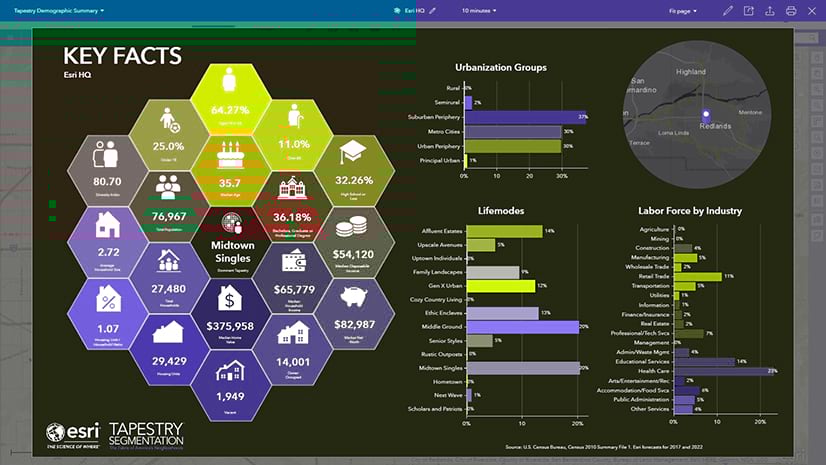
- 2019 Tapestry segmentation, daytime population, market potential, business locations, traffic counts, and crime indexes.
- 2013-2017 American Community Survey (ACS) demographics.
- New variables on life-stage and dependency that represent ratios of children and seniors to the working population.
- New variables on socioeconomic indicators to help explore the relationship between home value, income, wealth, and homeownership.
- Michael-Bauer Research data updates for 15+ countries and territories including Dominican Republic, Jamaica, Guatemala, and Puerto Rico.
Read more about all of the data updates in our What’s New in Esri Demographics (June 2019) blog.

Use Historical Data
Many Business Analyst users have asked for the ability to use historical data in their workflows. We listened, and we’re excited to bring this feature to you.
Users can now access historical data for the US population, households, and housing units. With this, you can easily create infographics, charts, or maps to understand demographic trends in an area. Here’s an example:
- Helena is interested in exploring if the population is growing or declining around one of her existing stores. Because she’s ready to expand her business, she needs to make a location decision while the timing is right. With this release, she’s able to use data for all previous years back to the last decennial census. Using data from the last five years, she can explore how the population has changed to make a more informed decision.

ArcGIS Business Analyst and Esri Story Maps
Ready for a brand new workflow? ArcGIS Business Analyst Web App users can now add sites, maps, infographics, and reports in interactive Esri Story Maps in just a few clicks. Select one of the four starter Story Map templates, choose your sites, configure items for the sites (attributes, notes, infographics, reports, etc.), and watch as all of your selected content is added to a Story Map. You can further customize the story map using the Esri Story Maps building experience, too!
This workflow is a great way to share your beautiful, custom infographics and other Business Analyst content. With Esri Story Maps, there’s no better way to serve polished creative assets directly to the audiences that need them most.

Import and Map Geographic Boundaries
Many businesses need to understand specific geographic areas, some conforming to predetermined boundaries (zip codes, counties, etc.) while others are designed based on experience or instinct (I know, I know… but some people still do this and sometimes, that’s okay). Regardless of how a geographic boundary is created or identified, we all need to be able to do an analysis of these specific areas. With this release, the new Import File workflow allows users to import their boundaries. Simply select the Geographic Boundaries option when importing a spreadsheet, choose which column has the boundary information, and then generate the map.

Improved Menu Structure
With this release, you’ll notice a brand new menu structure and renaming that’s bringing two new menus with it: Add Data, Create Maps, Define Areas, Run Analysis, and Share Results. We’ve organized common workflows to help you navigate to them quicker, and ordered them in the way they are used in your work.
Please note that none of the existing menus and their workflows will be removed.
For those that are very familiar with the existing structure, here’s how the tools have moved:
- The Suitability Analysis workflow will be moved under the new Run Analysis menu.
- Share Results is a brand new menu consisting of the new Story Maps workflow and the ability to share via PDF, image, and via ArcGIS Web Maps.
As ArcGIS Business Analyst Web App continues to grow, adding and improving functionality along the way, we feel that these five menu topics will help to better organize, order, and house all of the tools and workflows.

Business Analyst Widget for Web AppBuilder
The ArcGIS Business Analyst team has created a brand new widget for Web AppBuilder for ArcGIS! This new widget gives users the power to use infographics and classic reports in their Web AppBuilder applications. Access the dozens of starter infographic and classic report templates created by Esri or any of the custom templates created by you or others in your organization.

Business Analyst for ArcGIS Pro
Search for Businesses and Facilities
A brand new interactive workflow has been added to the Business Analyst extension for ArcGIS Pro! Users can now search and filter businesses or facilities for a better understanding of what’s in an area of interest. Here’s an example:
- Jean is looking for a new, larger location for her specialty electronics store. She knows that proximity and access to big-box competitors could impact customers’ decisions to visit her new location. Jean can use the new businesses and facilities tool to find competitors and to analyze her prospective locations.
Of course, we’re not done after just adding this search functionality. We have also added a companion geoprocessing tool to automate this work through models and scripting.

New Sharing Options for Infographics
We know how important it is for our users to be able to share their work with their teams, customers, managers, and communities. That’s why with this update we’ve added the option to print and export your Business Analyst Infographics to PDF, HTML, and Dynamic HTML formats right inside of ArcGIS Pro.

Share Custom Data
In the previous release of Business Analyst for ArcGIS Pro, we added support for custom data, allowing users to set up how fields can be aggregated and apportioned. Now you can publish custom data to your ArcGIS organization and share it with your colleagues to map and analyze. This can now be done without having to do a second setup and can be used in other applications like the Business Analyst Web App. For those that are a bit more technical, you can even create new fields with your custom data variables using a simple Arcade expression or with Python scripting!

Analyze Locations Using the Huff Model
We’ve added a brand-new tool to Business Analyst for ArcGIS Pro that uses the Huff Model to analyze market potential of a new facility based on the impact of competitors, distance, and attractiveness values. If you’d like to read more about the Huff Model, check out our Huff Model documentation page.

Generate Drive Time Trade Areas
Ready to easily create drive time trade areas? While your trade area is being created behind-the-scenes, our new geoprocessing tool conveniently adds the attributes used in reports and analysis. Simply setting your Business Analyst data source to either local or online is the only configuration needed! If you have a specific need requiring advanced settings like time of day, travel direction, and overlapping options, this tool can do that, too!

Optimize Territories Using Street Network
Many managers who create and assign territories have expressed interest in the ability to manage the size, shape, and location of their territories based on street network distance. Street network distance is how far a person would have to travel using a system of roads; sometimes this is also called drive-time distance. This is important because there are some locations where travel distance over roads is dramatically further than the standard straight-line distances that many territory designs use. Instead, it is often better to consider the street network distance. Here’s an example:
- Janet is interested in creating territories for her sales team. Because her area of responsibility has a large wooded forest in the middle without any roads cutting through, she needs to create territories that consider the drive around. Janet then designs her territories based on the factors she has always been interested in (sales history, current customers, demographic information, etc.) alongside the added street network distance.
This update isn’t limited to just roads! Now, territories can be optimized considering user-defined network barriers, restricted areas, line barriers like a river or interstate that can’t be crossed, or polygon barriers like an existing franchise area that needs to be avoided.

Business Analyst Mobile App
Evaluate Locations using Suitability Analysis
Business Analyst users can now run suitability analysis on the go! Gather or update location information using the Business Analyst Mobile App, use suitability models created in the Business Analyst Web App, and get the suitability score for the location.

Access Content from ArcGIS Living Atlas
A foremost collection of geographic information from around the globe at your fingertips! Easily find maps and data layers from a range of categories such as imagery, urban systems, transportation, and landscape and add more context to your work.
Resources
We’re so happy to share this June 2019 release of ArcGIS Business Analyst with you. Below you can find some links for Business Analyst that you may find useful:
- Business Analyst product overview page
- Business Analyst resources page
- LinkedIn user group
- Business Analyst YouTube playlist
- GeoNet community
- Business Analyst Web App login page
- Business Analyst help and documentation pages
- Download the latest version of Business Analyst for ArcGIS Pro as part of the ArcGIS Pro 2.4 release from my.esri.com.
- Email the team: businessanalyst@esri.com


Commenting is not enabled for this article.