The June 2022 release of ArcGIS Business Analyst Web App and ArcGIS Community Analyst contains major updates to U.S. demographic content, including the most recent data from the 2020 U.S. Census, 2016-2020 American Community Survey (ACS) variables, and crosswalks for several variables from the 2000 and 2010 Census. To support users as they migrate their content to the 2020 decennial census and its updated geographic boundaries, Business Analyst has created a migration tool for copying content into Esri 2022, the new data source.
Business Analyst now includes both current-year (2022) and past-year (2021) demographics, which are available in all ArcGIS Business Analyst products, including Pro, Enterprise, Web, and Mobile. This will allow users ample time and flexibility to bring their content to the new Census 2020 geographic boundaries, attributes, and settlement points contained within the Esri 2022 data source.
Using the past-year data source, Esri 2021, you can continue to work with the geographic boundaries based on the 2010 U.S. Census and migrate your analysis, markets, reports, personal variable lists, custom data, and other assets using the built-in Business Analyst migration tool. Where automated migration is not possible, you will see warnings when the impacted assets are used.
For many users who have not created custom reports or infographics, or do not have geographic sites, switching to the Esri 2022 data source will be automatic and have no impact on your work. This article outlines the steps for migrating custom content, allowing the advanced user to maximize use of 2022 Esri demographics in Business Analyst.
Introducing 2022 Esri Demographics
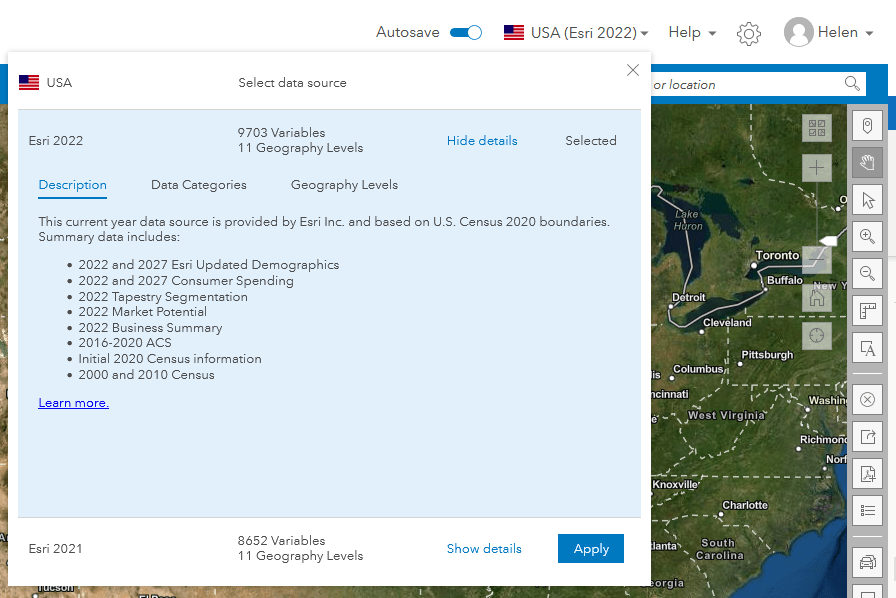
This release contains 2022 Esri Demographics, also called the Esri 2022 data source, which contains the most recent Esri content, built exclusively on U.S. Census 2020 boundaries and containing data from previous Census reapportioned to the new geographic areas. You’ll see this source selected in the Business Analyst country/region drop-down menu:

The 2022 Esri Demographics release includes:
- 2022 and 2027 Esri Updated Demographics
- 2022 and 2027 Consumer Spending
- 2022 Tapestry Segmentation
- 2022 Market Potential
- 2022 Business Summary
- 2016-2020 American Consumer Survey (ACS)
- Initial 2020 Census information (formerly called PL94-171)
- 2000 and 2010 Census
New content and data collections
Market Potential data provides details about consumers’ use of products and services, as well as data about consumer attitudes. In this release, we have added over 700 new variables under a new Psychographics data collection within the Business Analyst data browser.
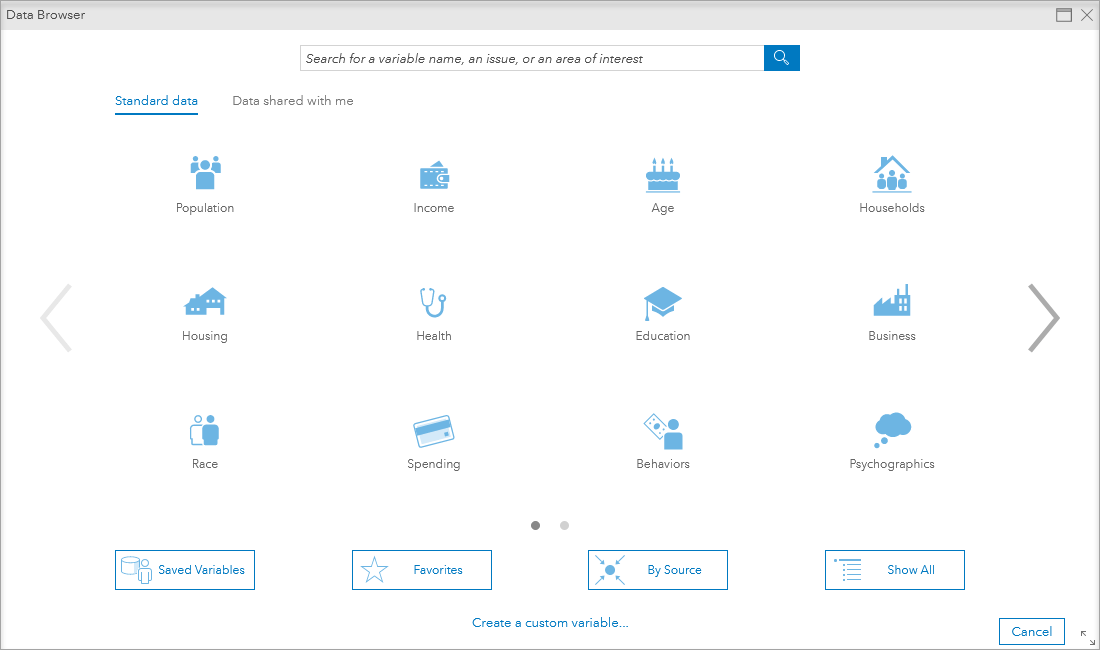
Psychographics variables are aggregated into categories about advertising, food, lifestyle, media, and shopping.
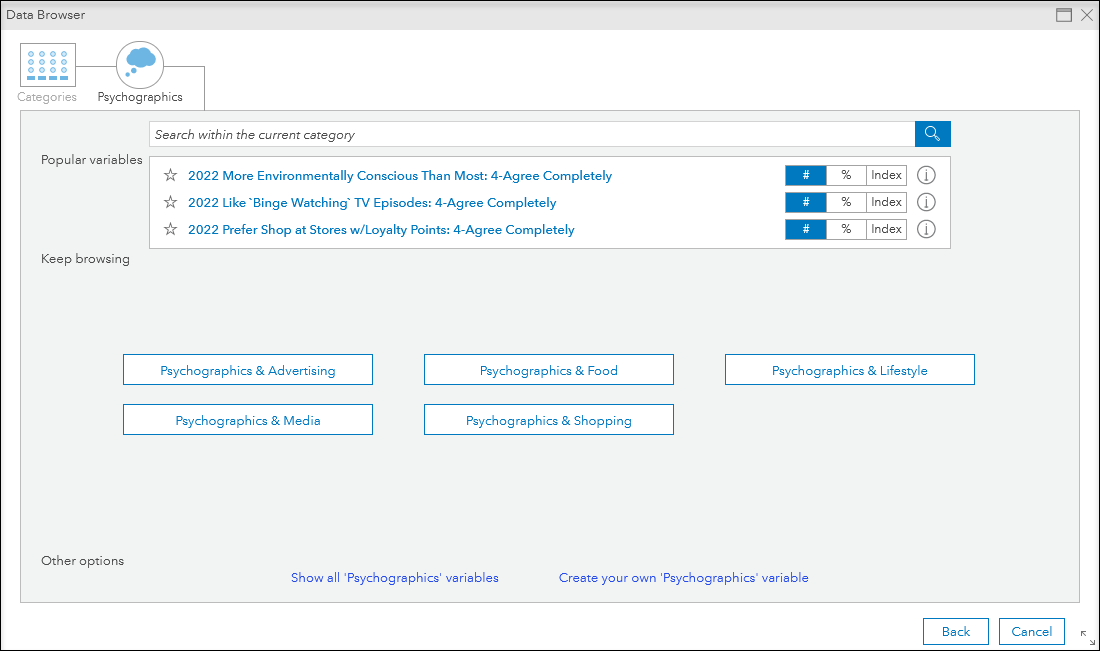
Psychographics variables include attitudes towards health, environmental impact, online shopping, and product engagement.
Changes from the December release
The Census PL94-171 data that was previously in a separate data source is now included in 2022 Esri Demographics, under 2020 Census. This has been expanded to include ACS data.
Retail MarketPlace (also known as Supply and Demand data) has been deprecated and will no longer be available in future releases. Esri is developing an alternative supply and demand dataset that will be available in future years. Retail MarketPlace data is still available in the Esri 2021 data source available in the country switcher.
Crime data was not updated in the June 2022 release; therefore, the data and reports are not available in the Esri 2022 data source. Please switch to the Esri 2021 data source to access the data in the data browser for mapping, analysis, and to run the Crime Summary and Retail MarketPlace Profile reports.
A new points of interest (POI) data source from Foursquare is now available as part of the global POI roll-out. Foursquare appears in the Data source menu, along with Data Axle and SafeGraph, in workflows that use POI data such as Points of Interest Search. You can learn more about data sources and providers in Learn more about data sources.
Accessing 2022 Esri Demographics in Business Analyst Web App
Starting on June 23rd, 2022, the default data source for the United States is Esri 2022. Historically, data sources were automatically updated and users were not able to access historic (past-year) data. Because this release uses geographic boundaries and attributes that are based on the 2020 U.S. Census, some analysis and many reports need to be migrated to the new data source. Many organizations have workflows that are dependent on existing geographic boundaries and demographics, and some organizations are waiting to migrate to Census 2020 when the full Census is released in summer 2023. We have implemented data and migration strategies that allow our users to adopt any of these strategies, as well as hybrid use.
Business Analyst Web App contains a country picker for selecting a country and for choosing a data source when multiple are available. By default, the USA data source is set to Esri 2022 and is highlighted within the top menu bar. By clicking on the country flag, you can access the country picker with a cog icon indicating that multiple U.S. data sources are available. This is similar to other countries with premium and standard demographics such as Australia, France, and Germany. See below for an example of accessing the country picker:
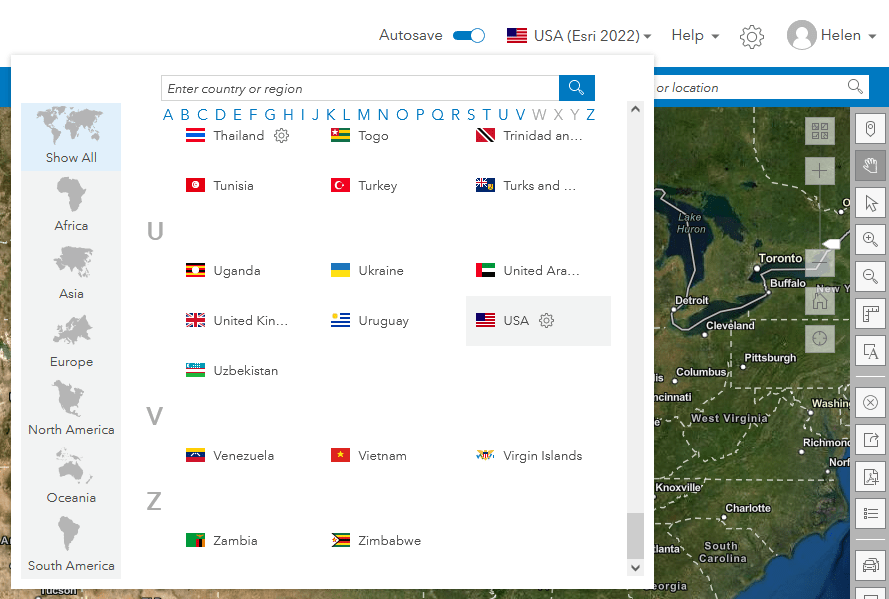
To use the Esri 2021 data source, click on the cog to reveal the available data sources and click Apply to switch between data sources. When autosave is turned on, your choice of data source will be maintained across logins. Note that the country picker contains a detailed list of available datasets and geographies. You can tab through data category descriptions and other details using tabs and documentation links.
Migrating reports and infographics to 2022 Esri Demographics
The most critical work for you to do as a Business Analyst user is to migrate your custom infographics and reports. The first time you log into the app after the 10.2 release, and on subsequent logins, you are prompted to migrate your content. Migrating your infographics and reports is fully automated and only takes a few minutes. If you have infographics that are used by Experience Builder or Web AppBuilder, you must update your infographics or they will not be seen in these applications. Currently, Experience Builder and Web AppBuilder cannot access the historic 2021 demographics.
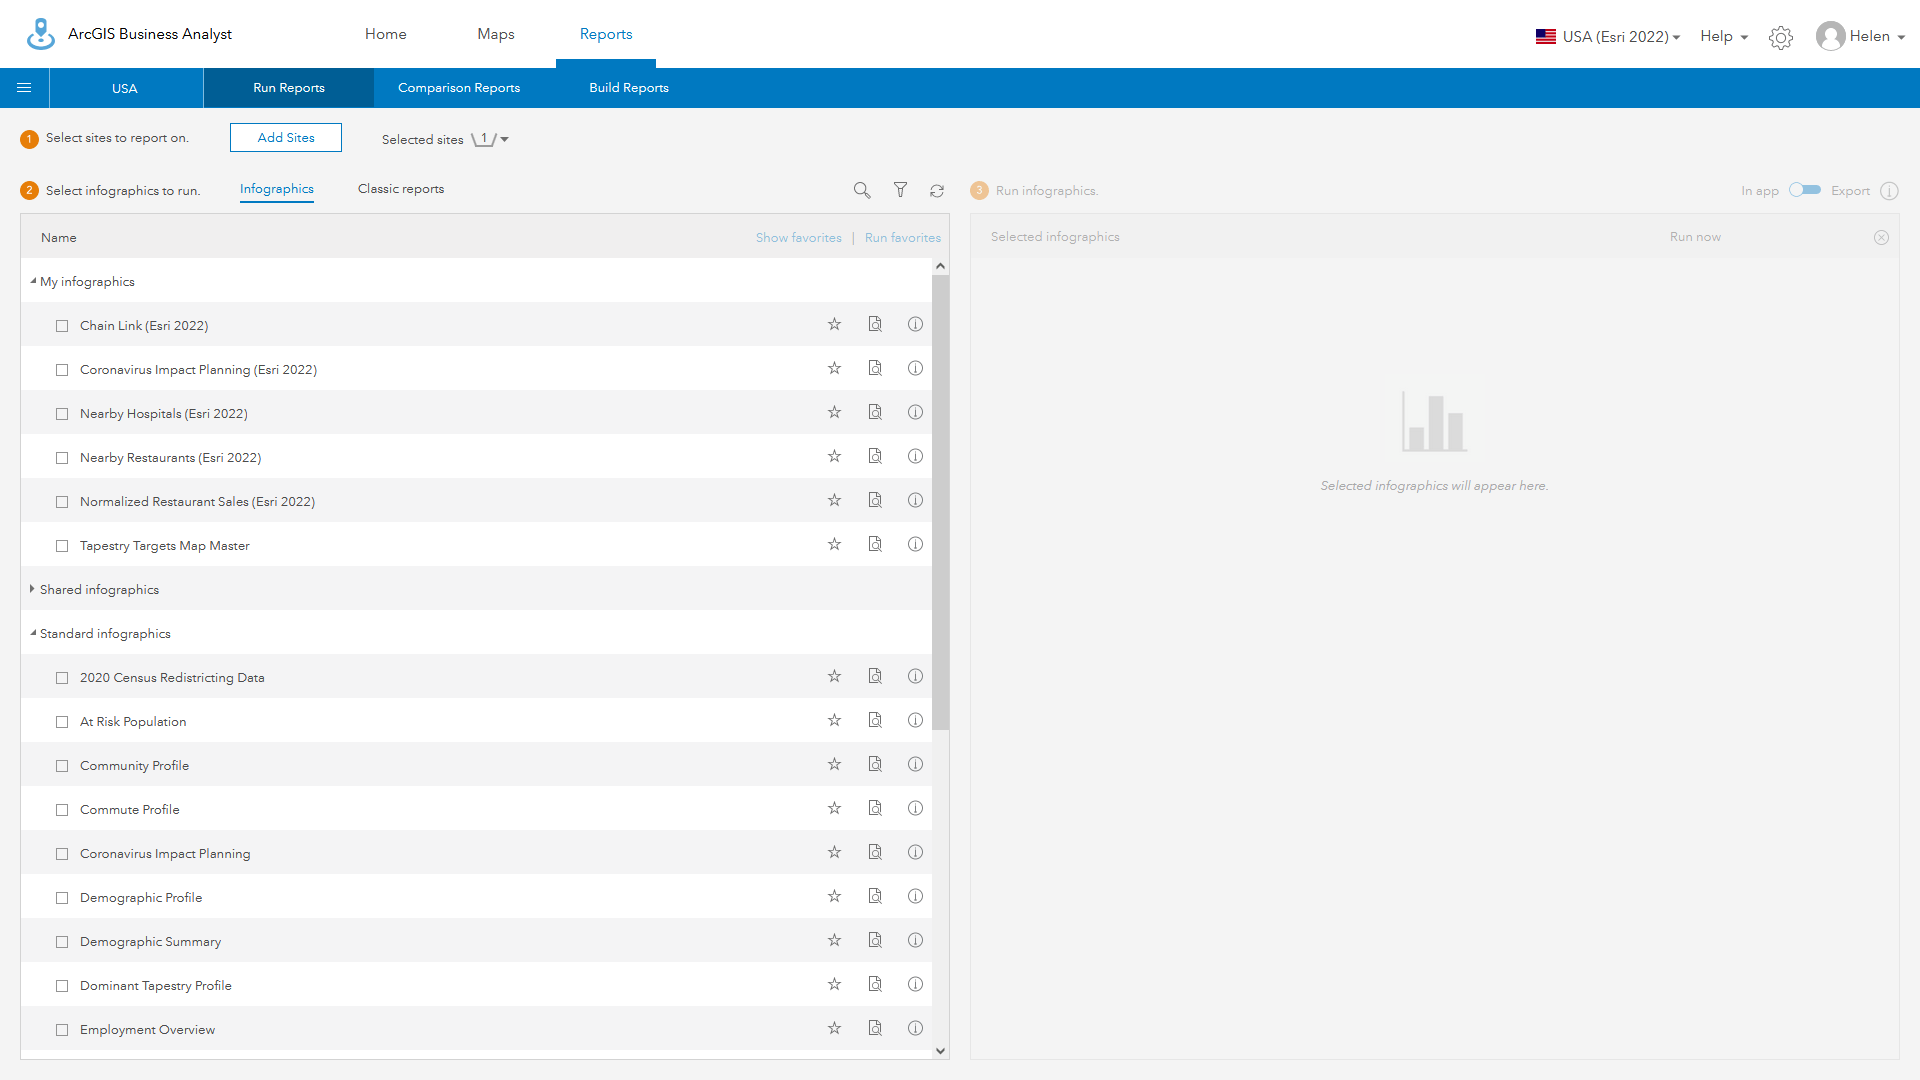
Automated migration creates a copy of your infographics and reports and appends a suffix reading (Esri 2022) to them. Your original templates can still be used with the 2021 demographic data source and Census 2010 geographic boundaries. When using the 2022 demographics, you will get a list of standard templates, shared templates that have been updated, and your migrated templates. Use the Edit button (the pencil icon) to change the name if you want, including removing the suffix.
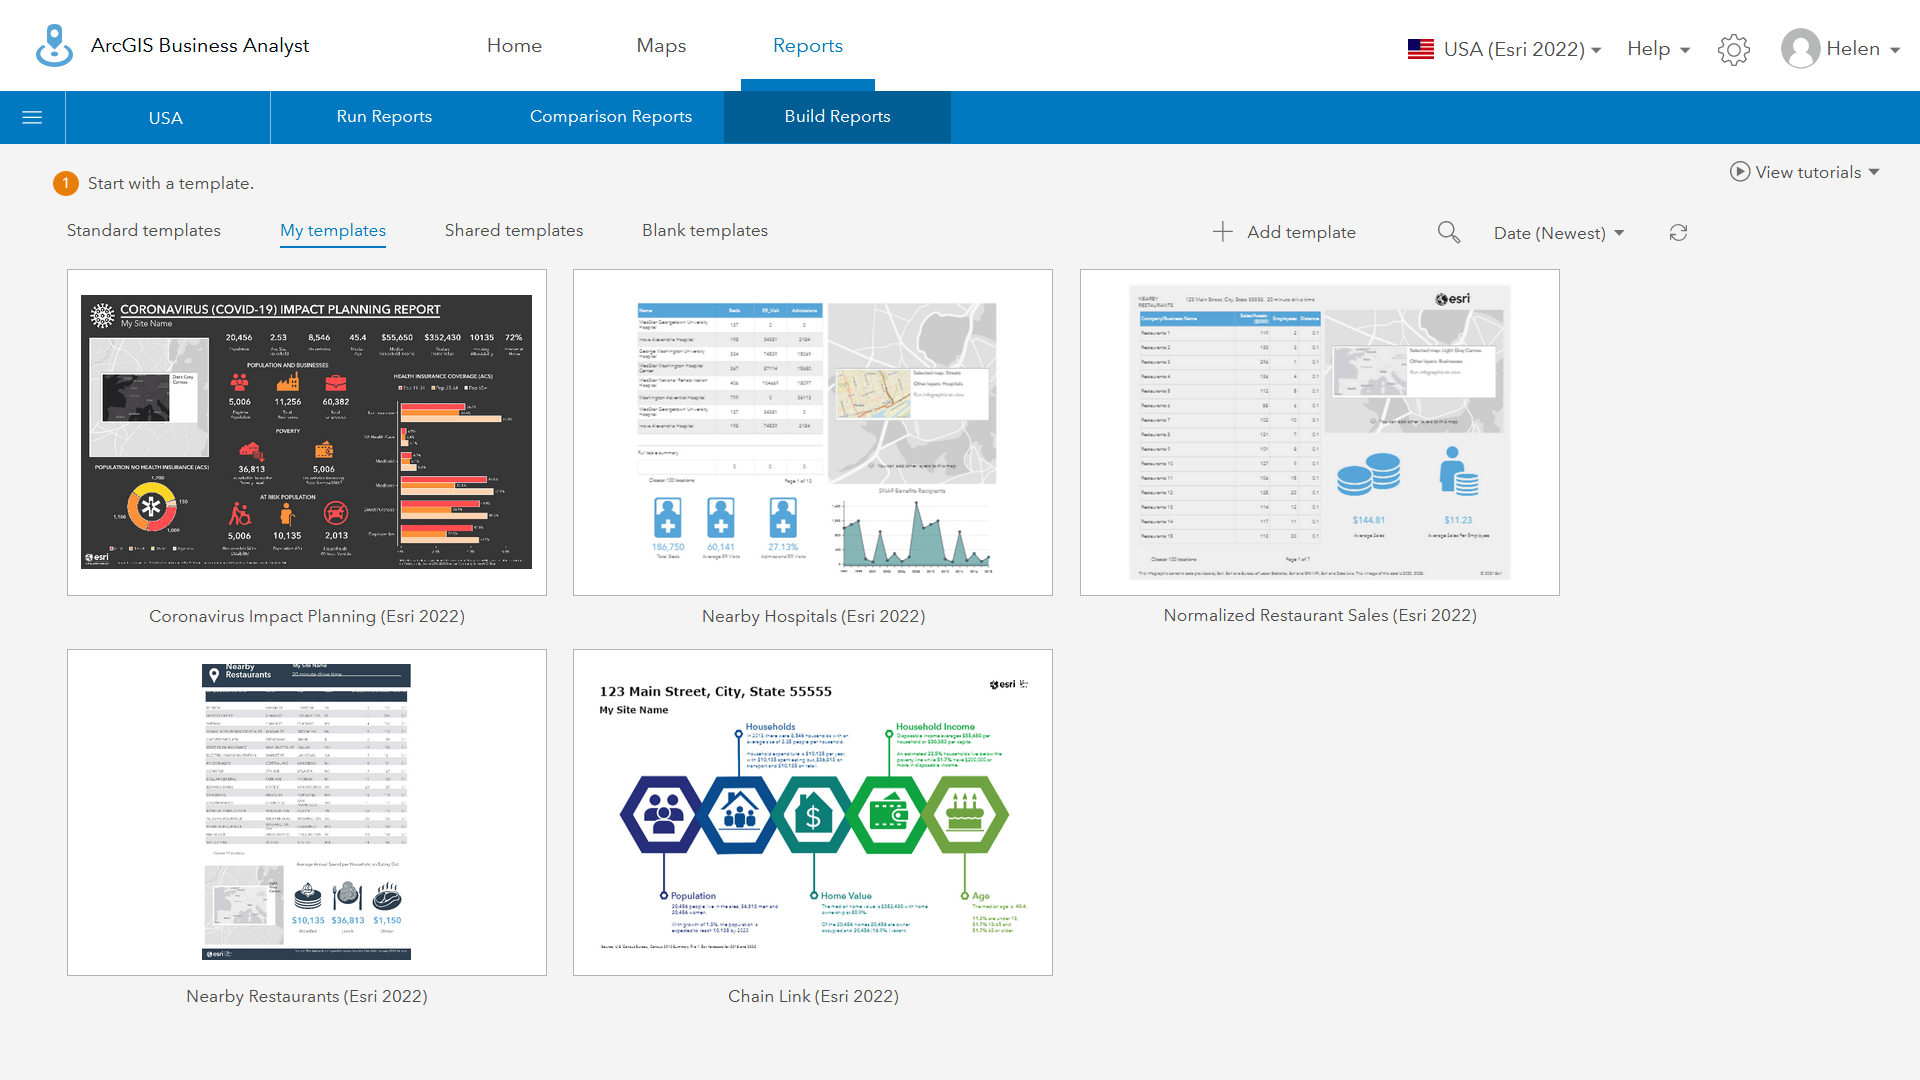
Esri standard infographics and classic reports do not use the (Esri 2022) suffix, as shown below. All templates have been updated to use the new data source and variables. Due to changes in variables, often due to missing Census variables or historic trends, there are minor differences between some reports and infographics compared to the standard reports that run with the 2021 data source. Note that the 2021 gallery has not been migrated to 2022 Esri Demographics for this June release. Migrating gallery reports and adding new templates will happen ahead of the 10.3 release of Business Analyst Web App and Community Analyst planned for later in 2022.
How long does automated migration take?
I had over 150 custom templates, containing thousands of attributes and hundreds of custom variables. Migration took only four minutes, and this one-time process updated all my templates to the 2022 attributes, including editing text labels and vintage information.
Can I ignore the prompt and migrate later?
We encourage you to migrate when you are first prompted or on later logins. The automated migration is a single-step process that includes migrating variables and text labels. Running migration later will require you to manually initiate both processes. Failure to run the automated update process may have unintended consequences for other users in your organization that use shared reports, Experience Builder or Web AppBuilder applications. Users without direct Business Analyst access or editing capabilities, including those who use shared infographics in ArcGIS Pro, may also be impacted by not updating your templates.
I have no infographic templates of my own. Does the new data source impact my content?
If you have no custom infographics or reports, then you will not see the migration tool prompt. Depending on how your organization uses shared infographics in Business Analyst, Experience Builder, Web AppBuilder, ArcGIS Pro, and custom apps, you may not see templates when using these applications. We encourage all our users to contact their Business Analyst organization administrator to ensure all shared templates from all users are migrated to 2022 Esri Demographics.
What isn’t automatically migrated? How do I fix warnings and errors?
Due to missing variables and variables which have not been migrated to 2022 Esri Demographics, you may receive errors or no data when running infographics. Where variables are missing but their omission does not impact the interactive experience, such as 2010-2019 Total Families, the infographic will still run but panels and charts may exclude these data. When missing variables are part of the same chart data series, the series will not be shown in the interactive experience or when exported to any of the supported formats.
When variables are missing, you may see N/A or zero values in your infographic, especially if they are part of tables and are embedded in custom variable calculations. To fix these issues, you will need to edit your template(s).
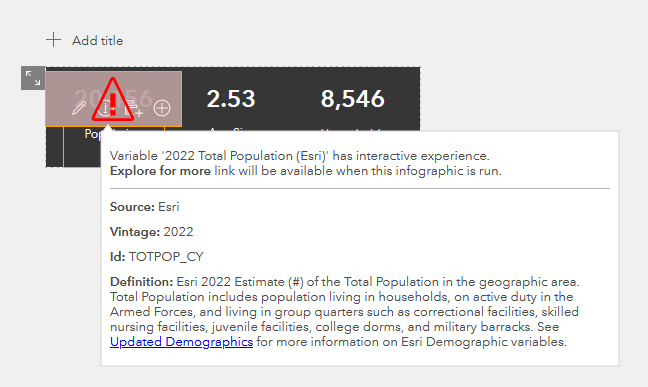
Missing variables are identified by a warning triangle. In the template shown below, the interactive panel experience for population has variables that are not available. The triangle is shown over the element that needs to be edited.
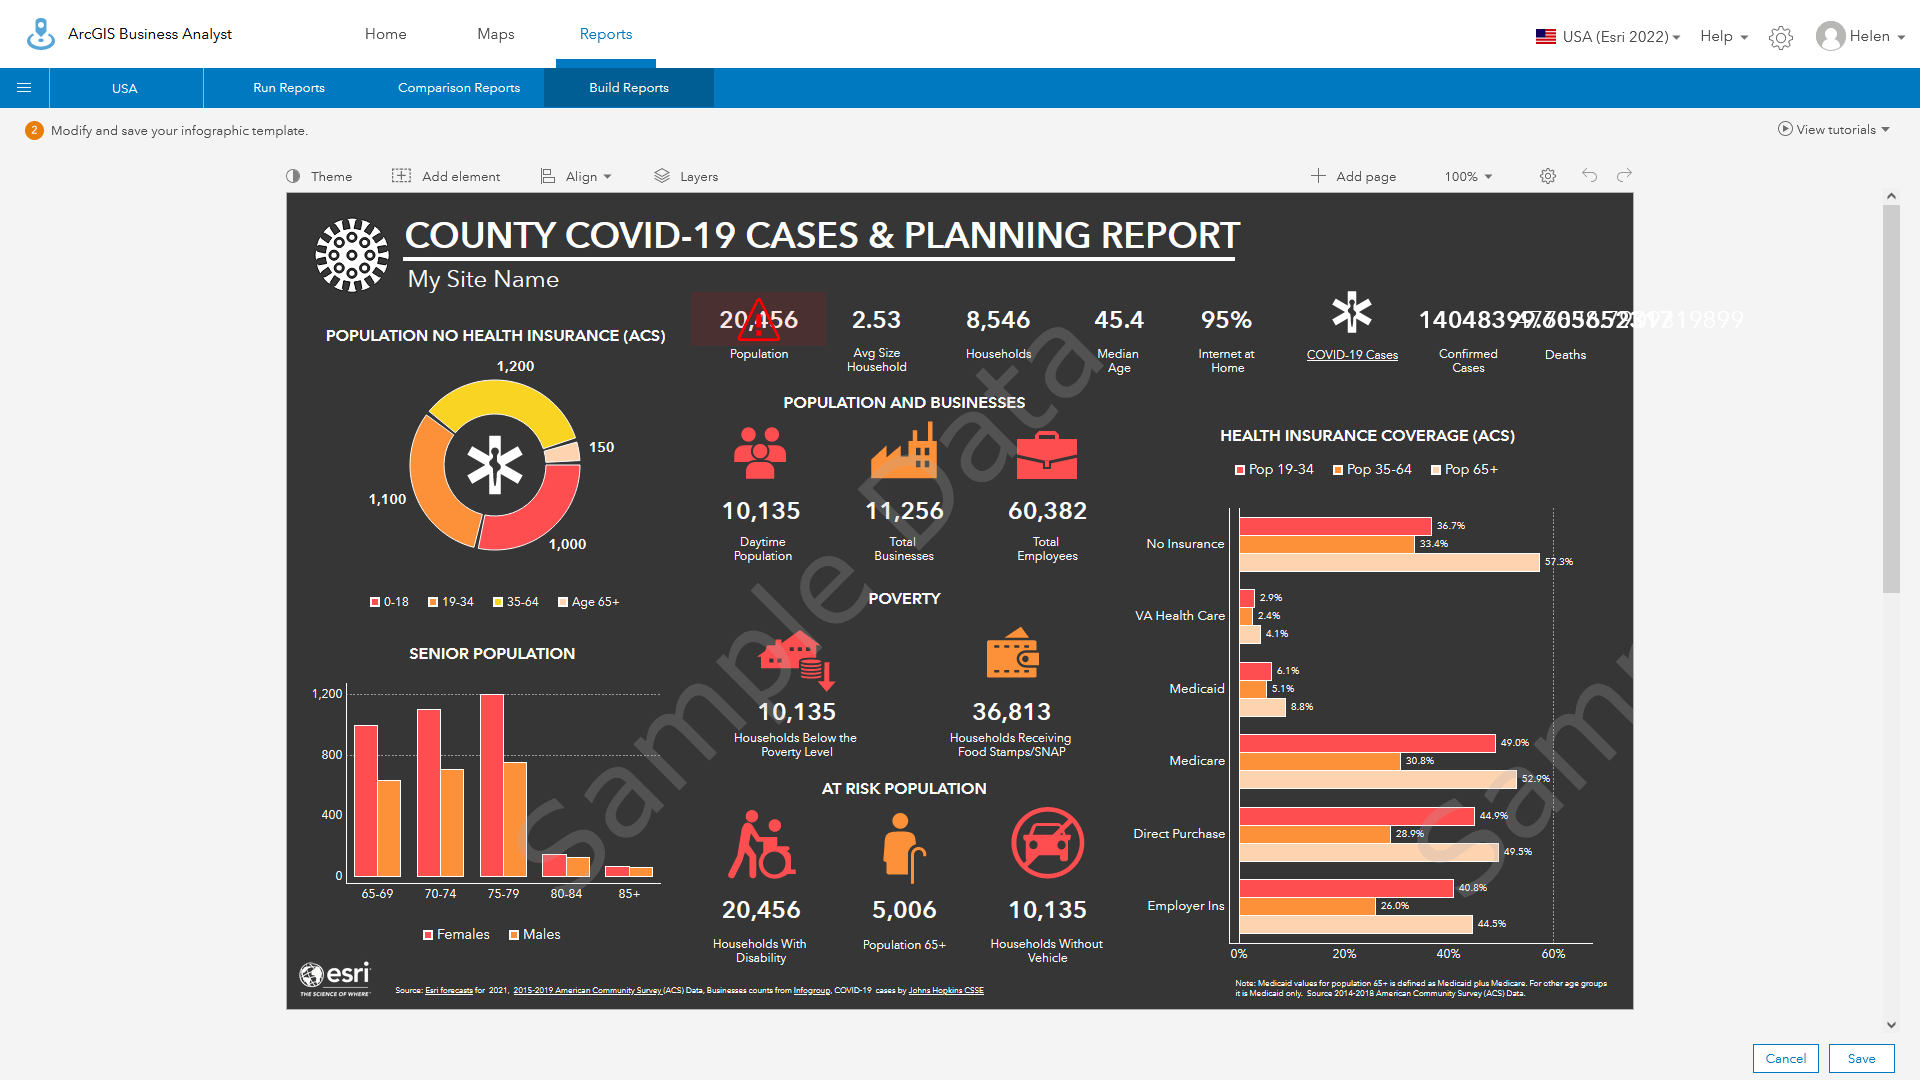
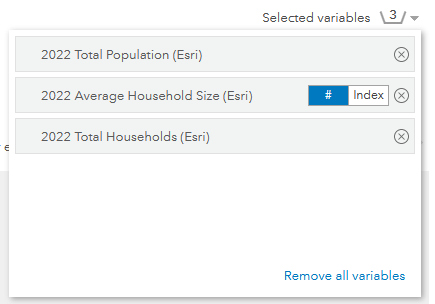
While the panel has the correct number of variables, all of which exist, the panel has an interactive experience that contains variables missing in the new data source Note that when there are missing variables in a panel, the selected variable list will show the errors. When the missing variables are in an interactive experience, you must edit the experience.
Warnings will be shown when you first access the chart or table experience:
Warnings are also shown when expanding the chart data:
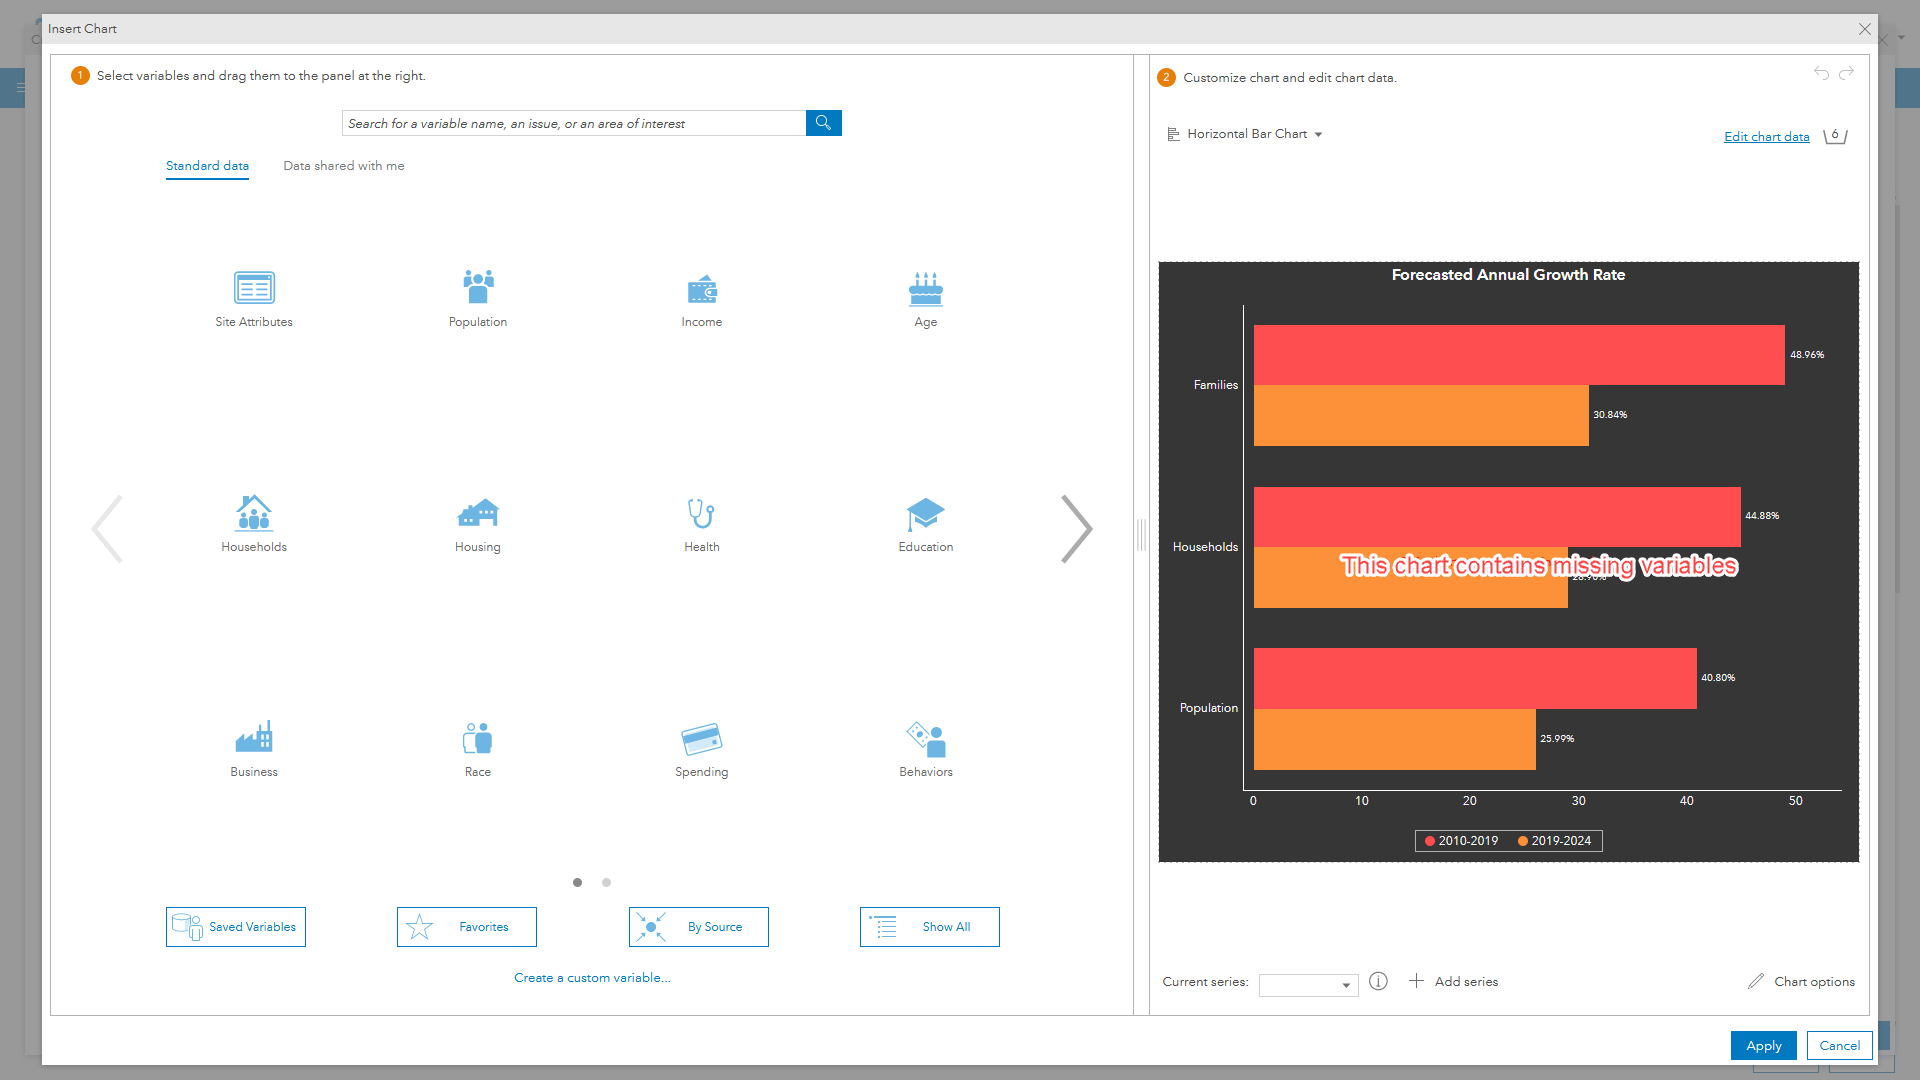
This interactive experience is missing 2010-2019 historic time series data, which have not been migrated to the 2020 Census geographies. Note that the current-year forecast (2022-2027 compound growth rates) have automatically been updated to replace the previous current forecast. The user-assigned series label (2019-2024) has not been automatically updated because it is a custom user setting. It will need to be updated manually.
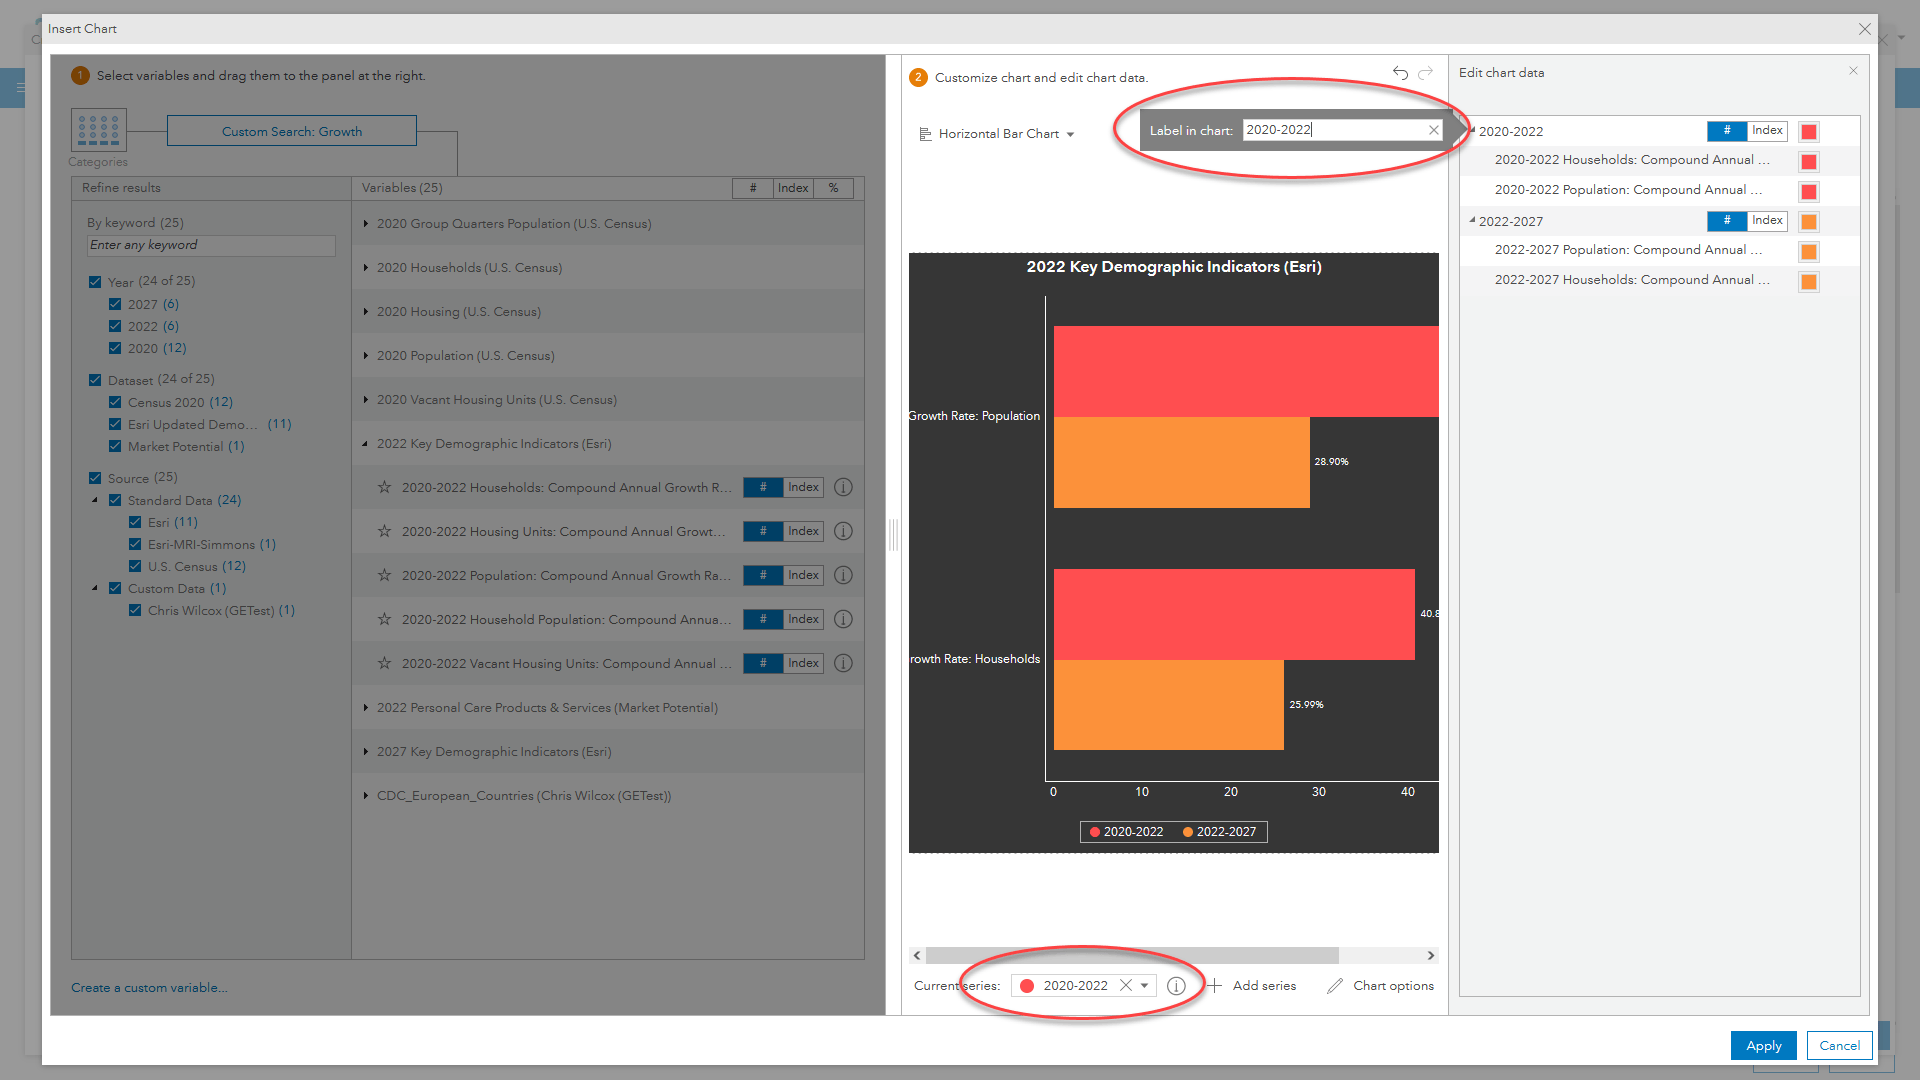
Not all of the historic time series are missing. Using the data browser, you can see that there are data from 2020-2022 for our series of key demographics.
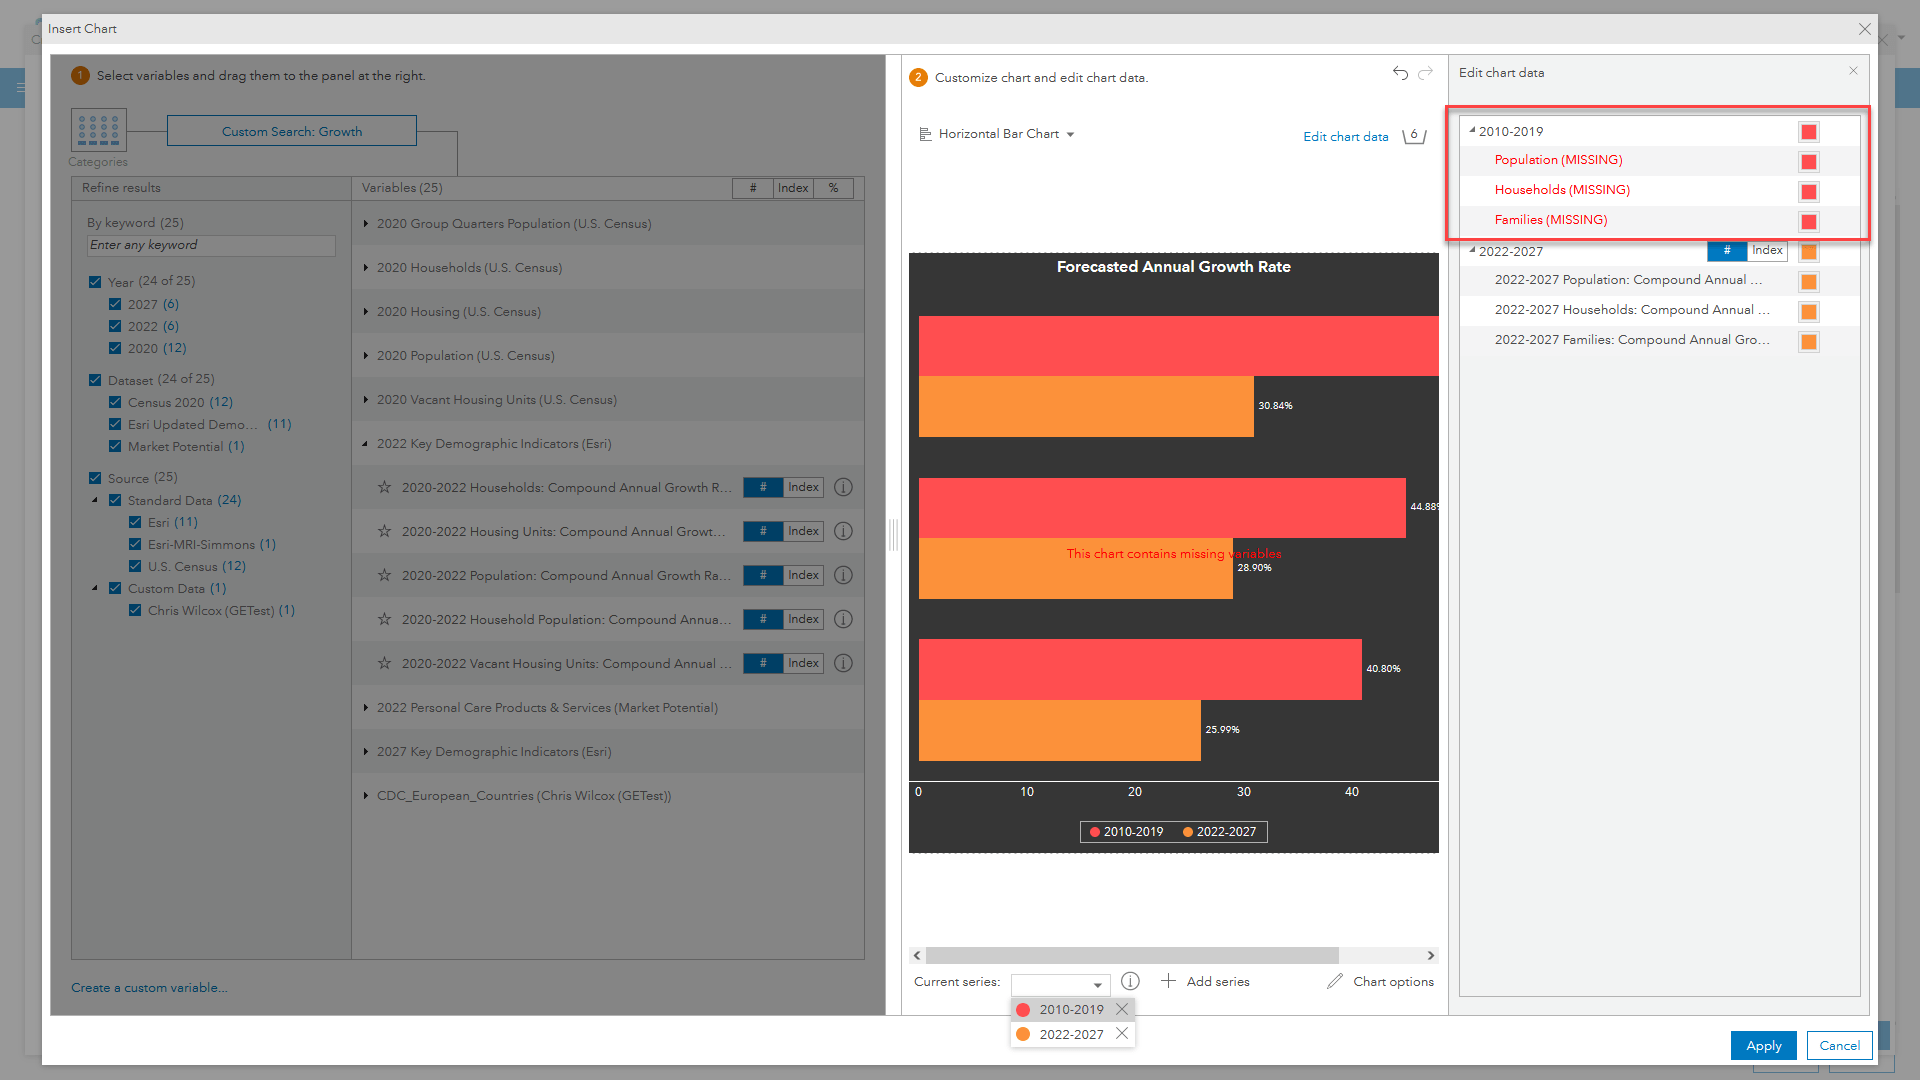
The chart uses compound annual growth for population, households, and families. Only families are missing from the historic trends. So we can select the historic time series (now mislabeled as 2010-2019) and replace the existing variables with the new 2022 population and household growth data.
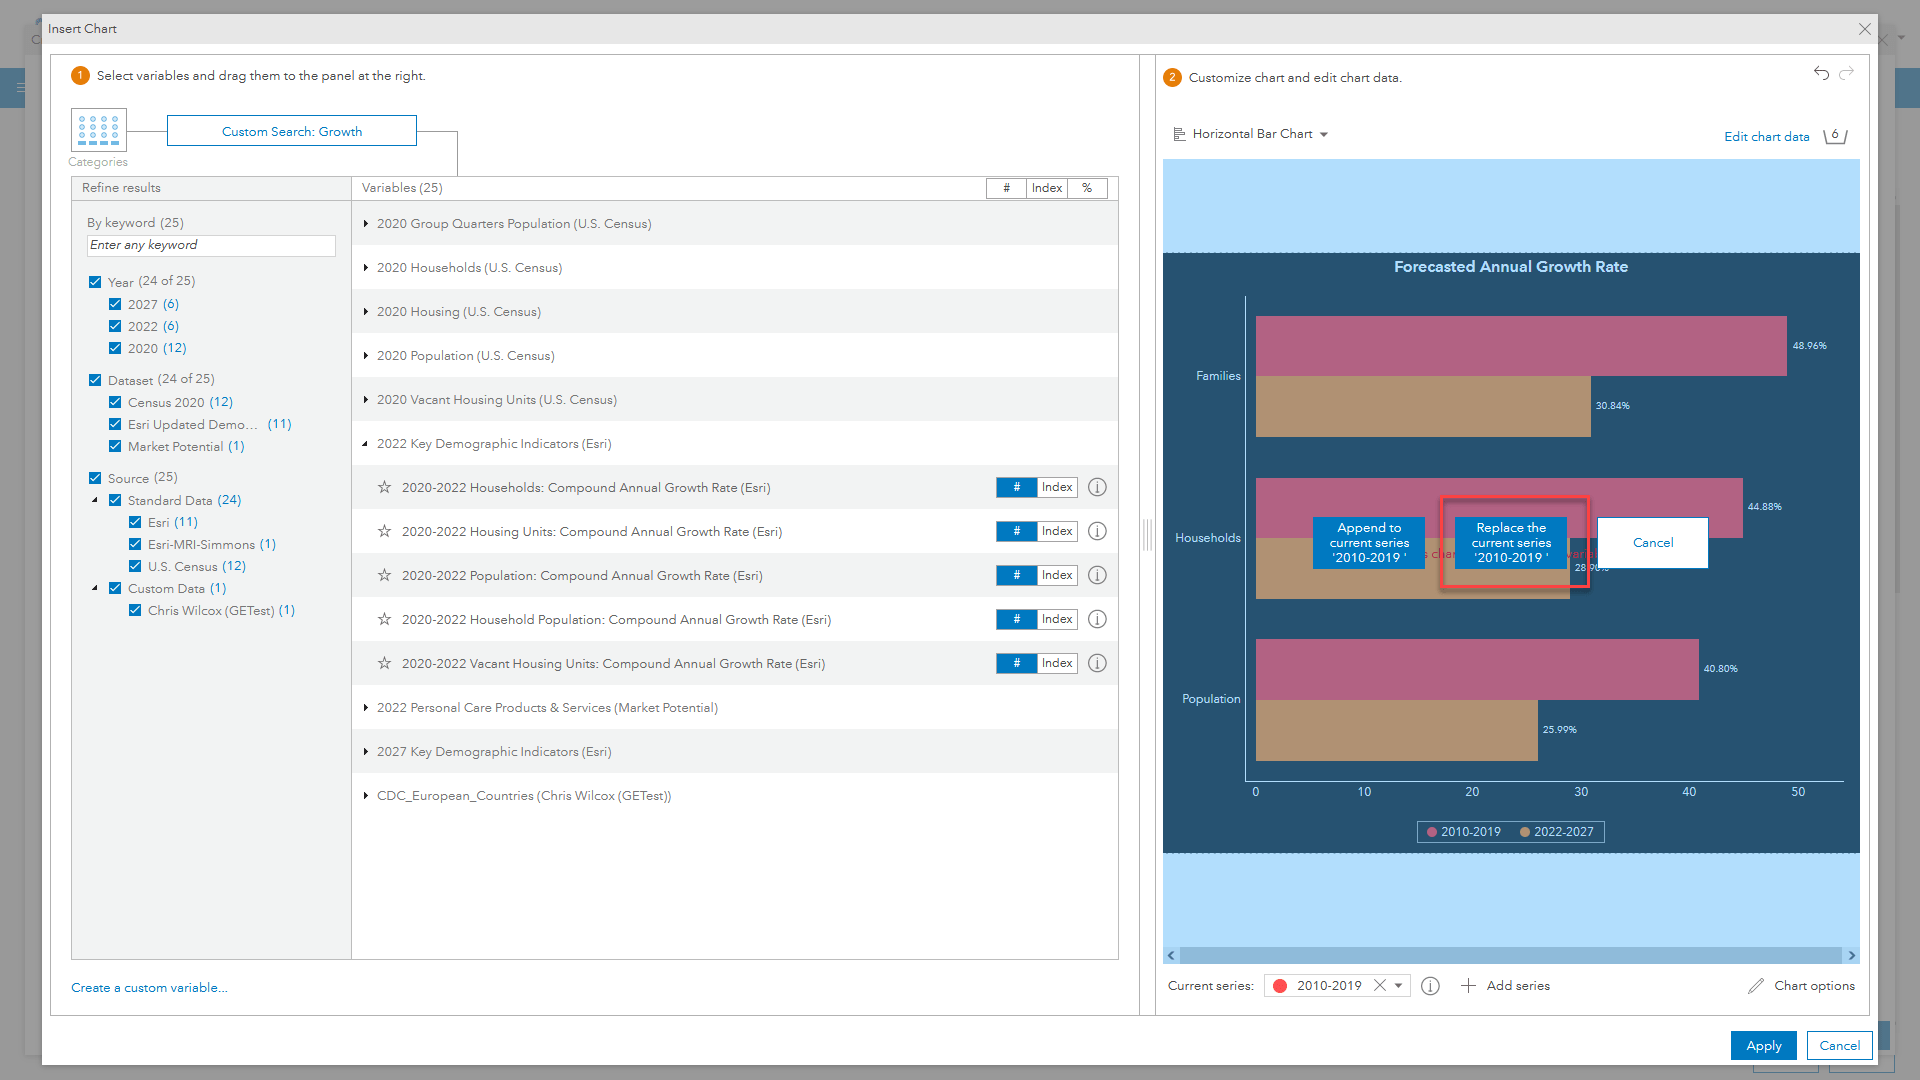
Once the family growth is deleted from the 2022-2027 future year growth and the series label updated, the interactive experience is now fixed and the infographics will have no more warnings in edit mode or missing experiences when run.
Is there a list of variable changes, additions, and deletions?
Check out Esri Demographics documentation for more details on demographic changes, data documentation, and the latest blog articles. The Business Analyst resources page has a regularly updated set of information and links to help you make the most out of the app, fix application and report issues, and other community support.
I’ve fixed everything and I still can’t save the template. What’s happening?
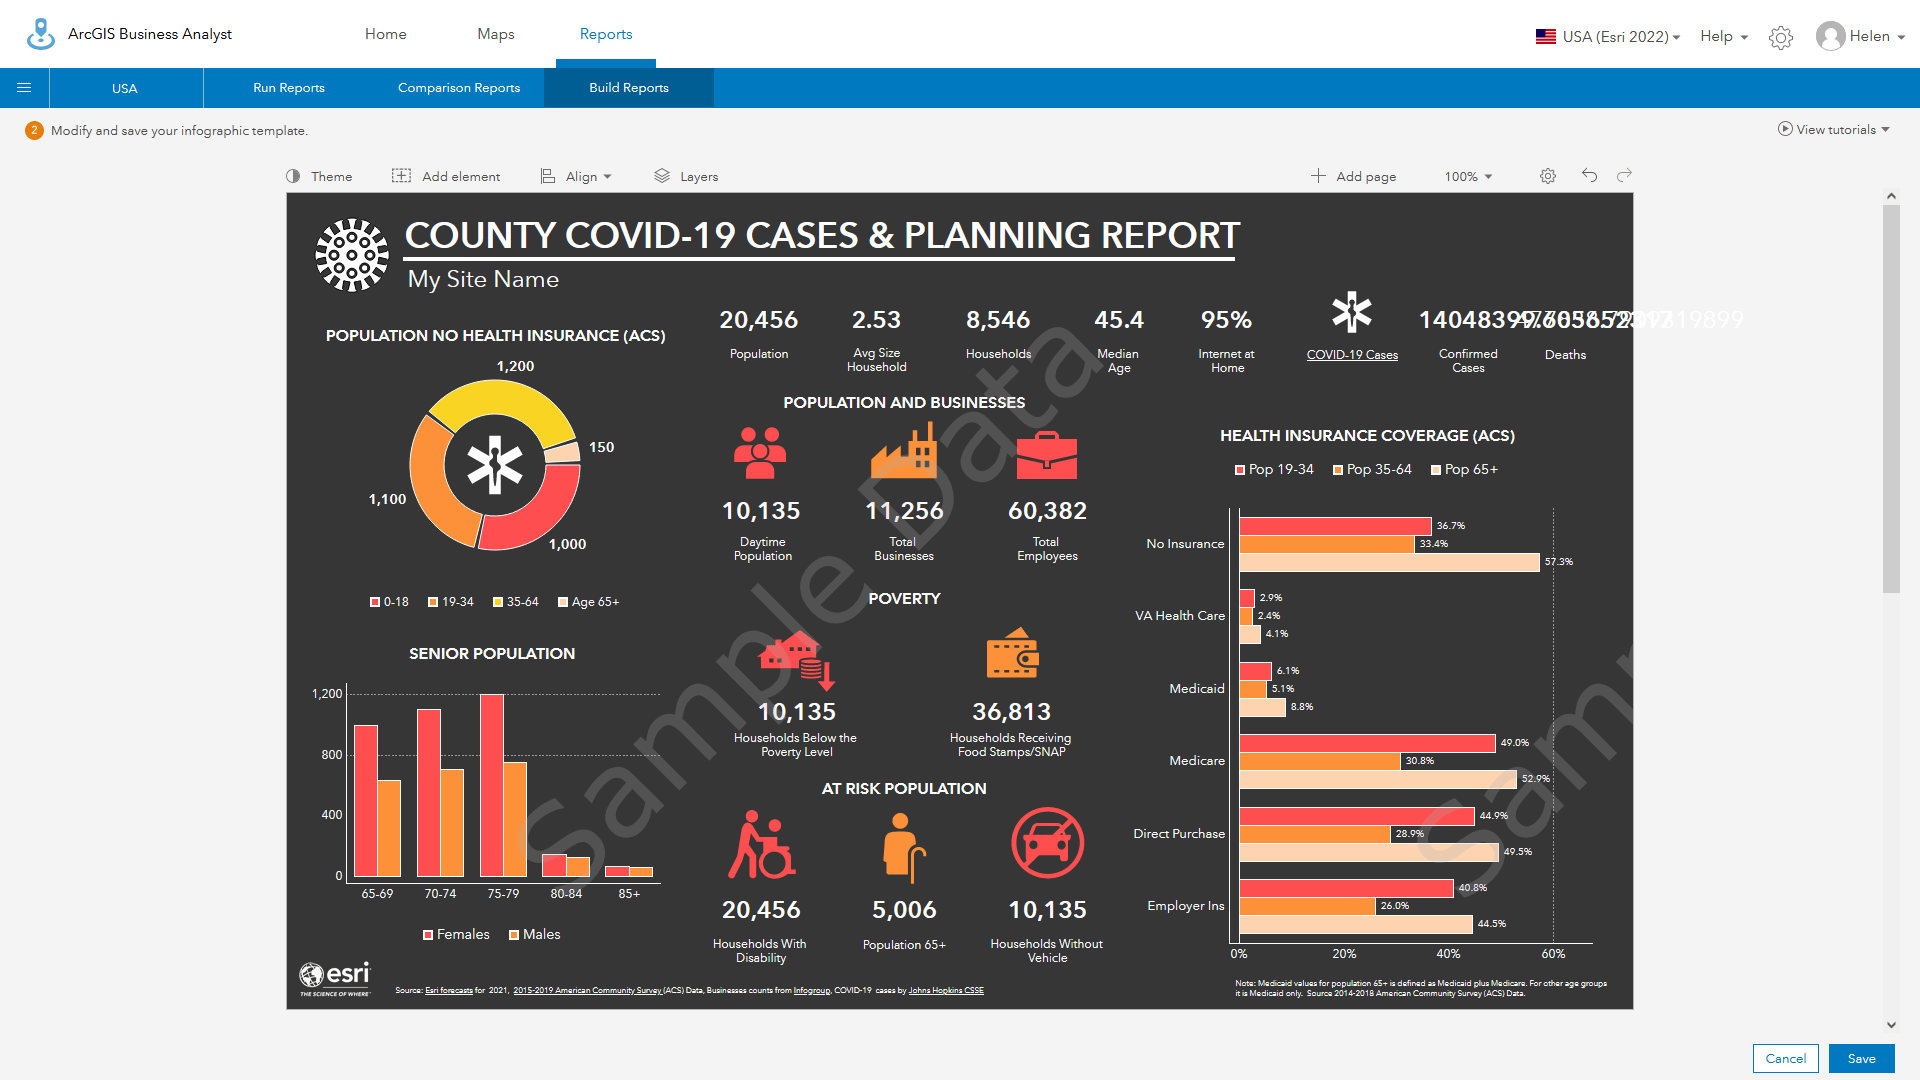
When saving templates with missing data or variables, you may receive a message that the template cannot be saved, as in the example below. This is often because there are additional pages with other interactive experiences that need to be edited. The Coronavirus Impact Planning template repeats the population experience on the second page and because it has not been edited, the template cannot be saved.

Is there a way to avoid having to fix content individually, especially if it’s repeated in different panels?
If you use common components across multiple pages or use the same interactive experience in different panels, you can simply delete the panels or experiences and then save the infographic. Once saved, open the infographic for editing, and then use “Add element from another template” to add or replace the second or multiple panels with the one from the current saved template.

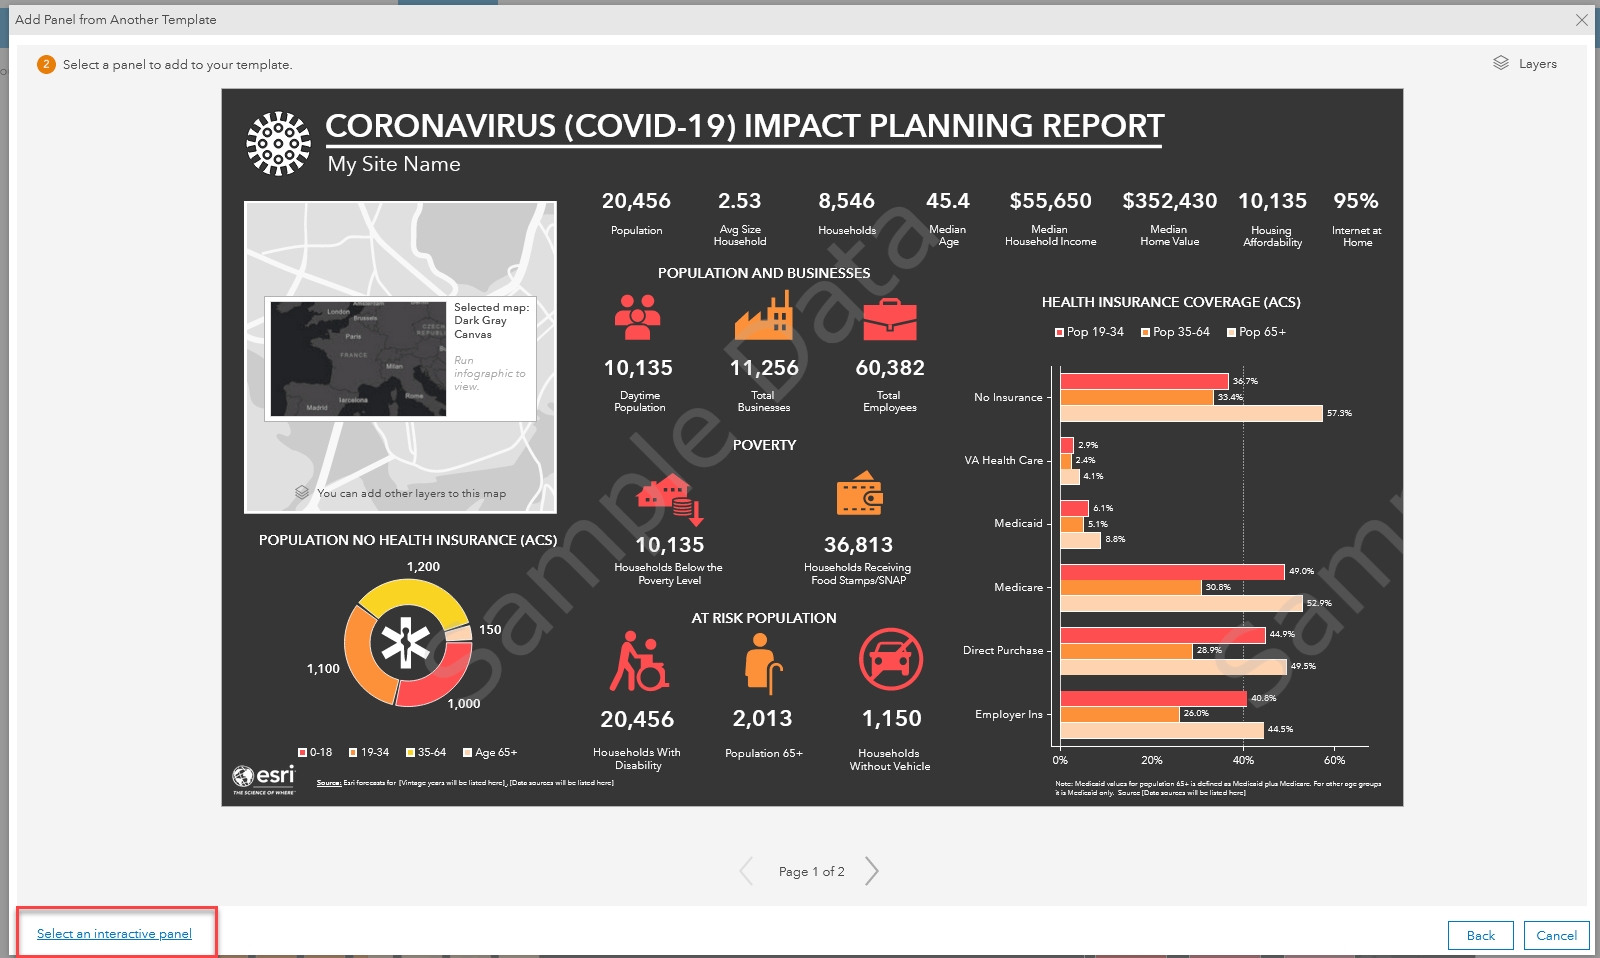
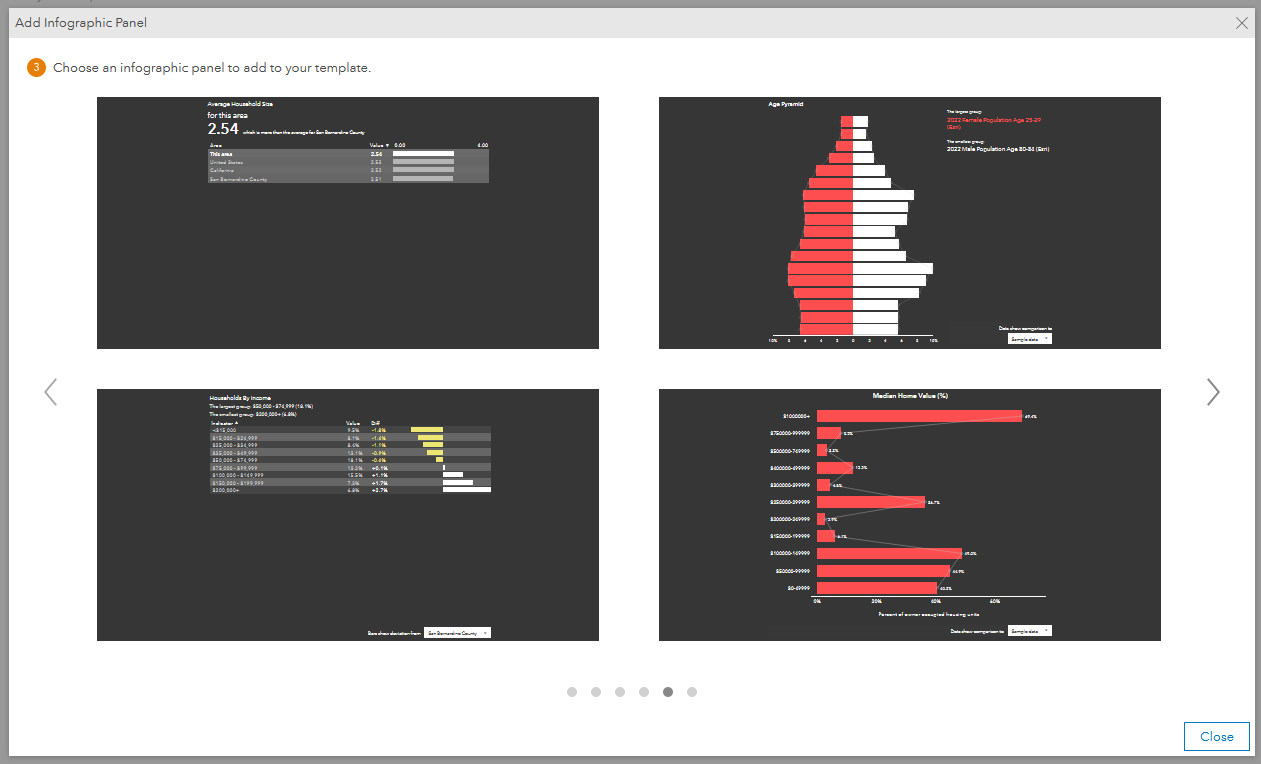
Note that you can use “Select an interactive experience” to browse through all the experiences in your current template, or any other template. You can then use it as an interactive component on your main template or add/replace an interactive experience within a sub panel.
What about variable lists? How are those changing?
Esri has migrated all system-wide variable lists, which are used in color-coded maps, smart map search, and analytical workflows (void and suitability analysis) to the new 2022 Esri Demographics.
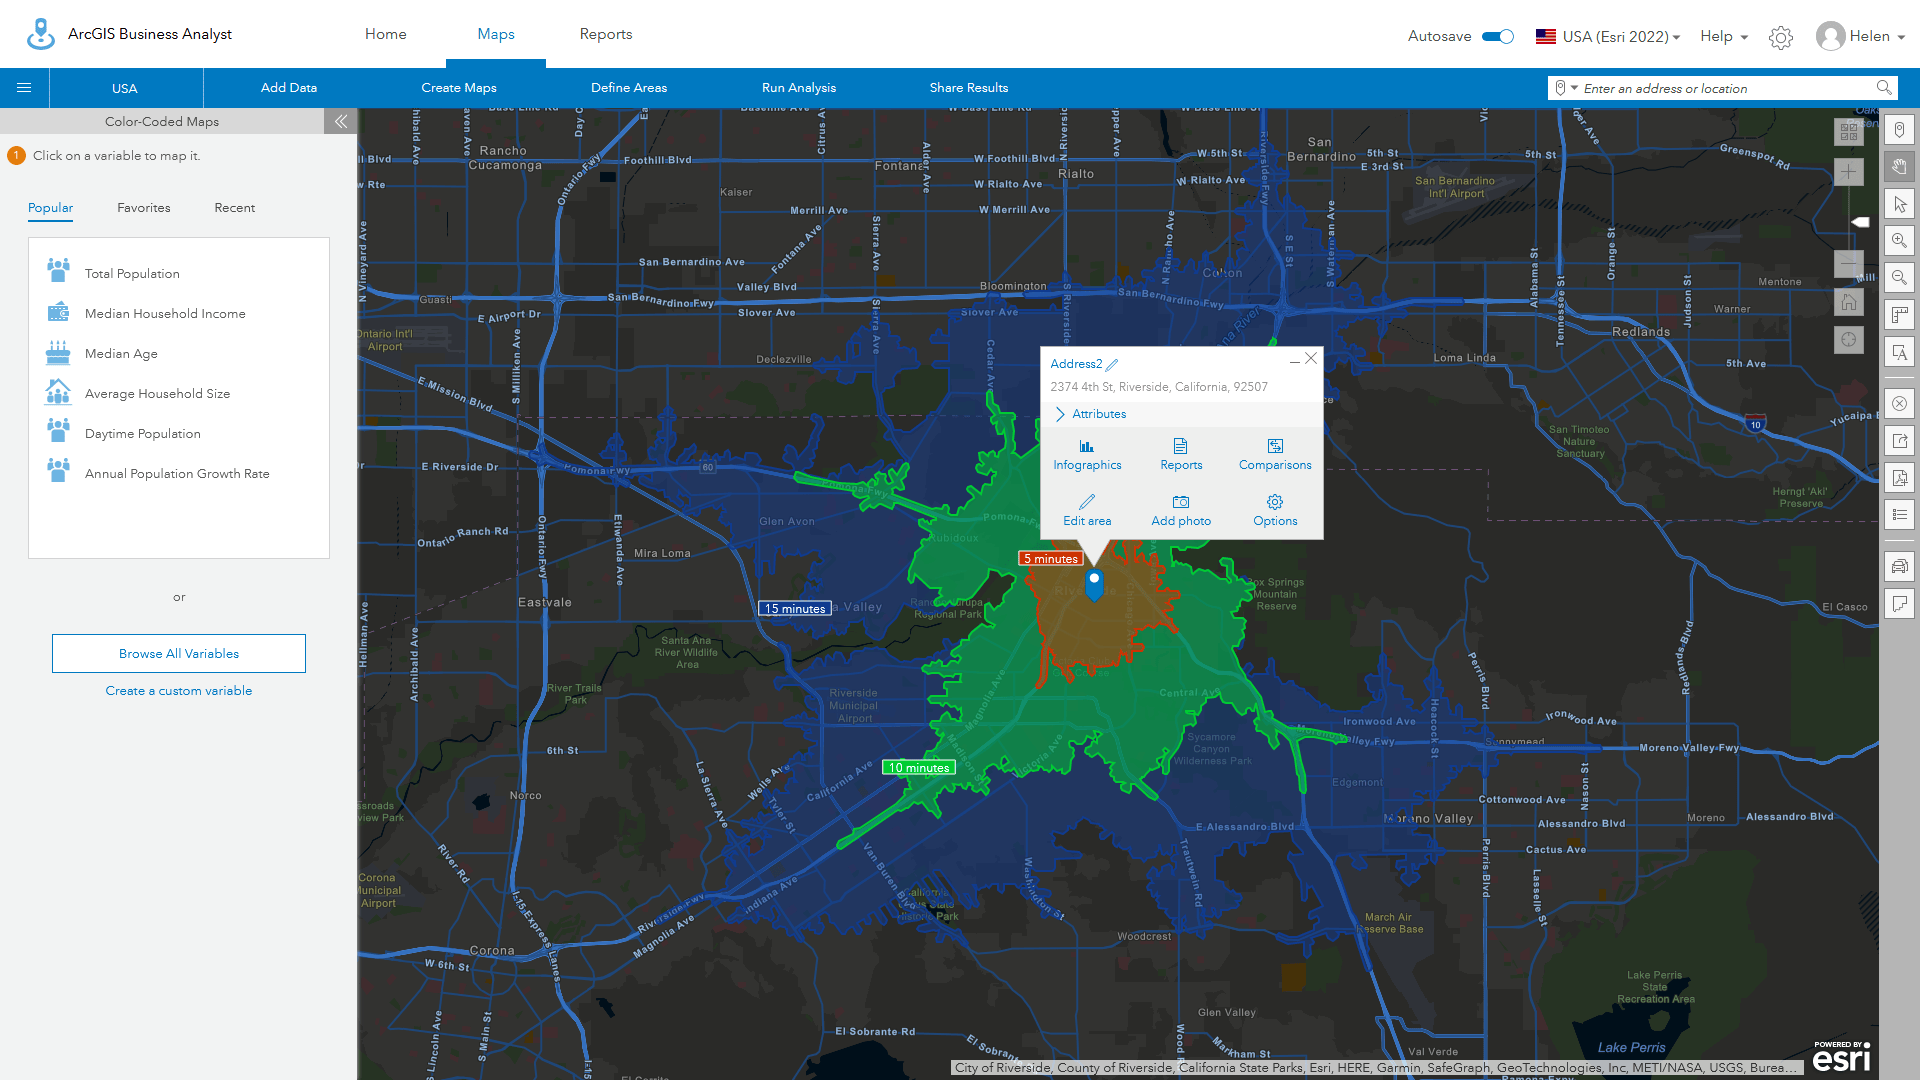
Esri-curated variable lists used in the Interesting Facts functionality in infographics have also been migrated.
If you have custom lists, which are shown as “My lists” in these workflows, the list will be automatically updated when you use them for the first time. Your list will show all the existing variables minus those that do not exist. You can save the updated list to permanently update the variable list.
Variable lists in the historic 2021 Esri Demographics are not impacted by any changes to lists within the 2022 demographics data sources. Lists that are used or shared with Business Analyst Pro will be maintained separately for the different data sources.
What about organizational lists managed by the administrator?
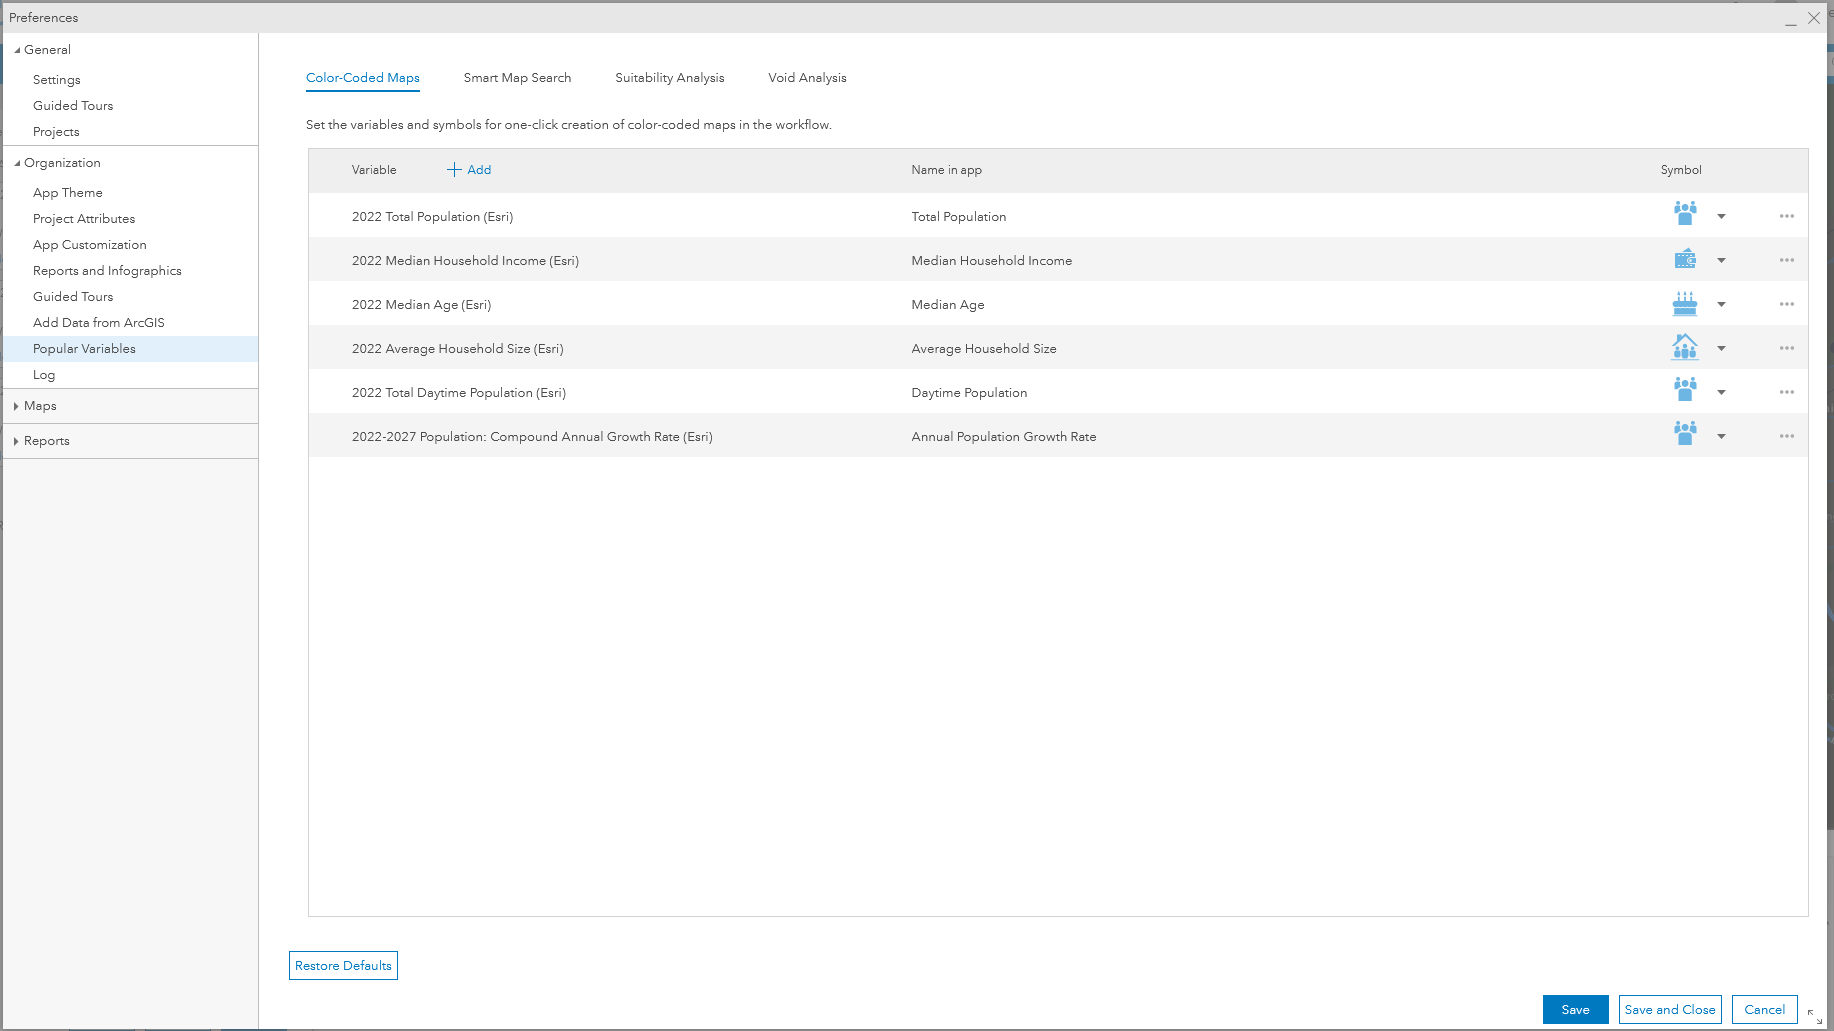
All organization-wide lists are migrated in the same way as personal lists. Missing variables are removed from the managed lists associated with each of the workflows, as shown below. An administrator can edit any of the organization-wide lists, extend the Esri default lists, and create or reorder lists. Organization-wide lists cannot be shared across data sources, so any changes made to a list using the Esri 2022 data source will not be reflected in the 2021 lists. If you want to keep lists consistent between sources, you must edit them in both demographic data sources.
I have a lot of custom variables. Do I need to update all of them?
Many users create custom variables that use multiple variables or perform mathematical calculations on specific variables. Where variables have been updated, such as the renaming of the Tapestry Segment Small Town Sincerity, your custom variables will automatically be updated when used in any of the workflows, map visualizations, or analysis tools.
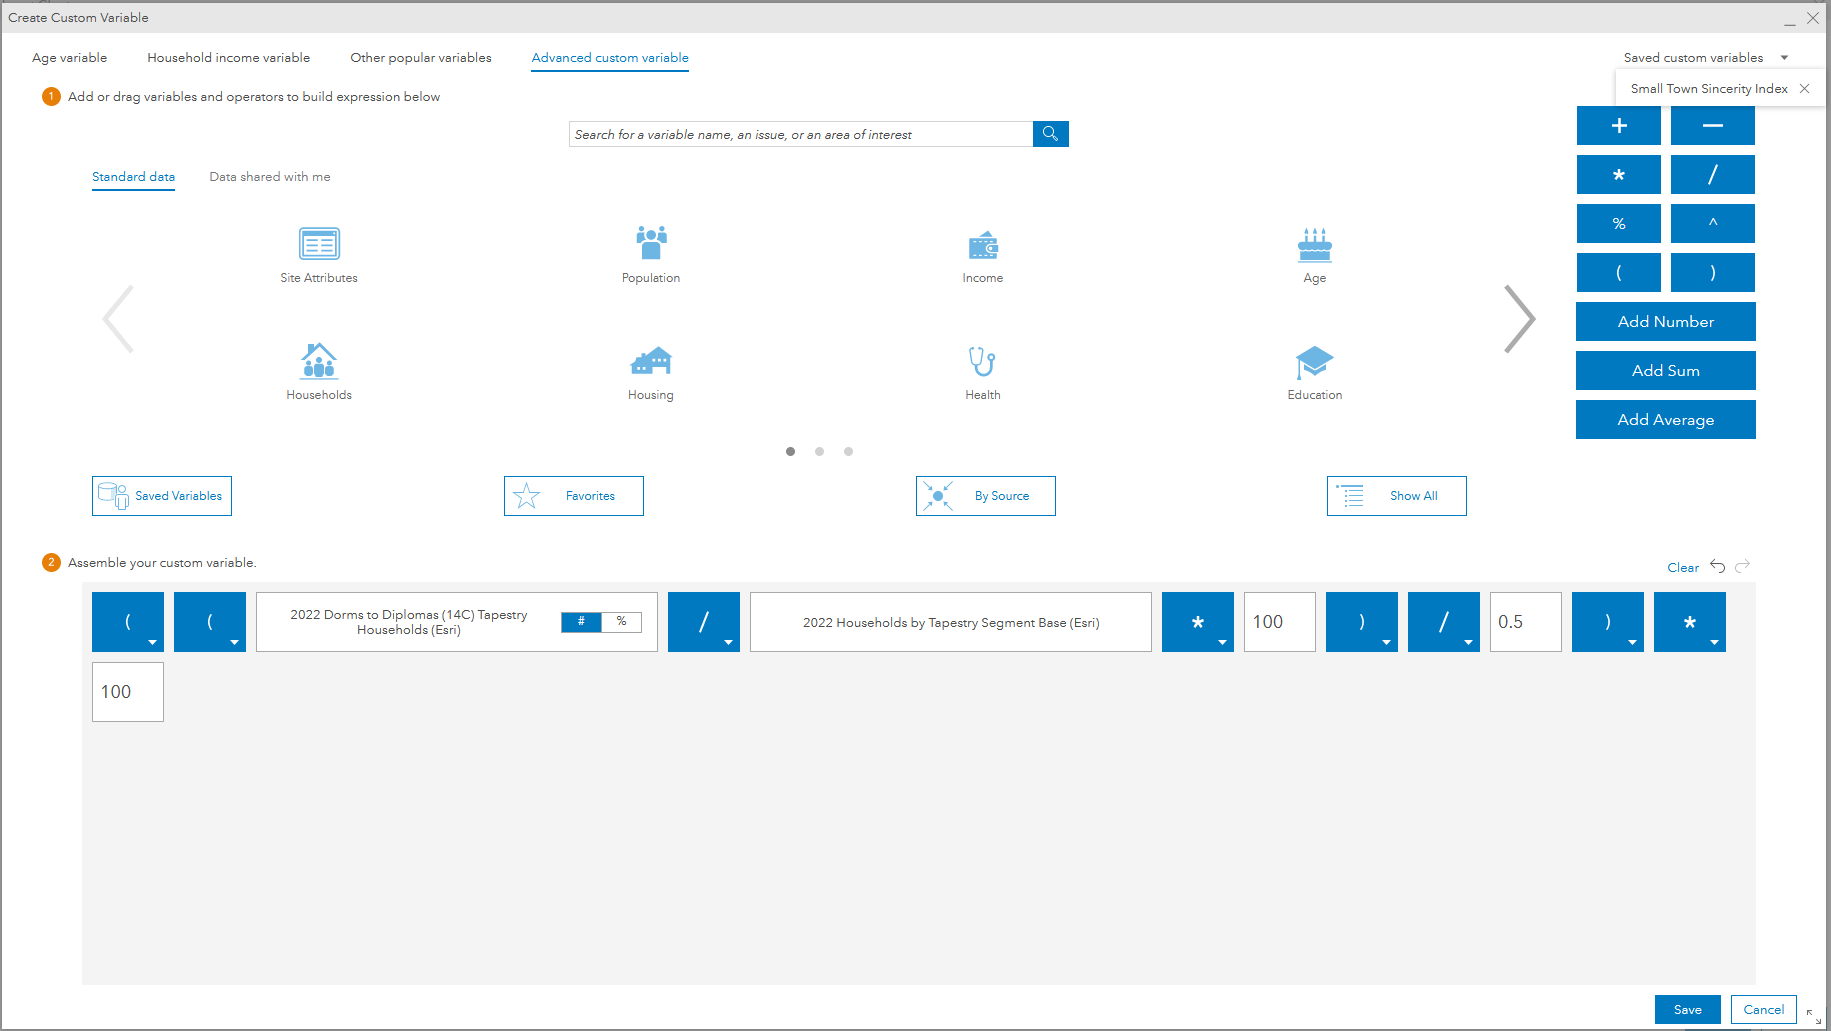
If a custom variable was built using a variable or set of variables that is now missing, then you must edit the custom variable for use in your workflows. This may include suitability analysis where variables will not be loaded from saved lists, or smart map search where the search criteria includes custom variables.
How are custom variables migrated in shared infographics that someone else created?
Custom variables are inherited and shared automatically within infographics so that if an author has created an infographic with a custom variable that can be migrated, the infographic will automatically work. You do not need to edit the variables. If an infographic or report fails because of a custom variable, contact the author and ask them to update and reshare the edited version.
I have lots of color-coded maps, smart map searches, and suitability analyses. Can I move them to the Esri 2022 data source?
Unfortunately, because the 2021 and 2022 data sources are independent and use different hierarchies, underlying population models, and analysis rules, you cannot migrate these maps between data vintages. The same is true of maps created using the standard and premium content in other countries such as France, Germany, and Australia.
You will need to create these items again in the Esri 2022 data source.
What happens with comparison reports and my custom comparisons?
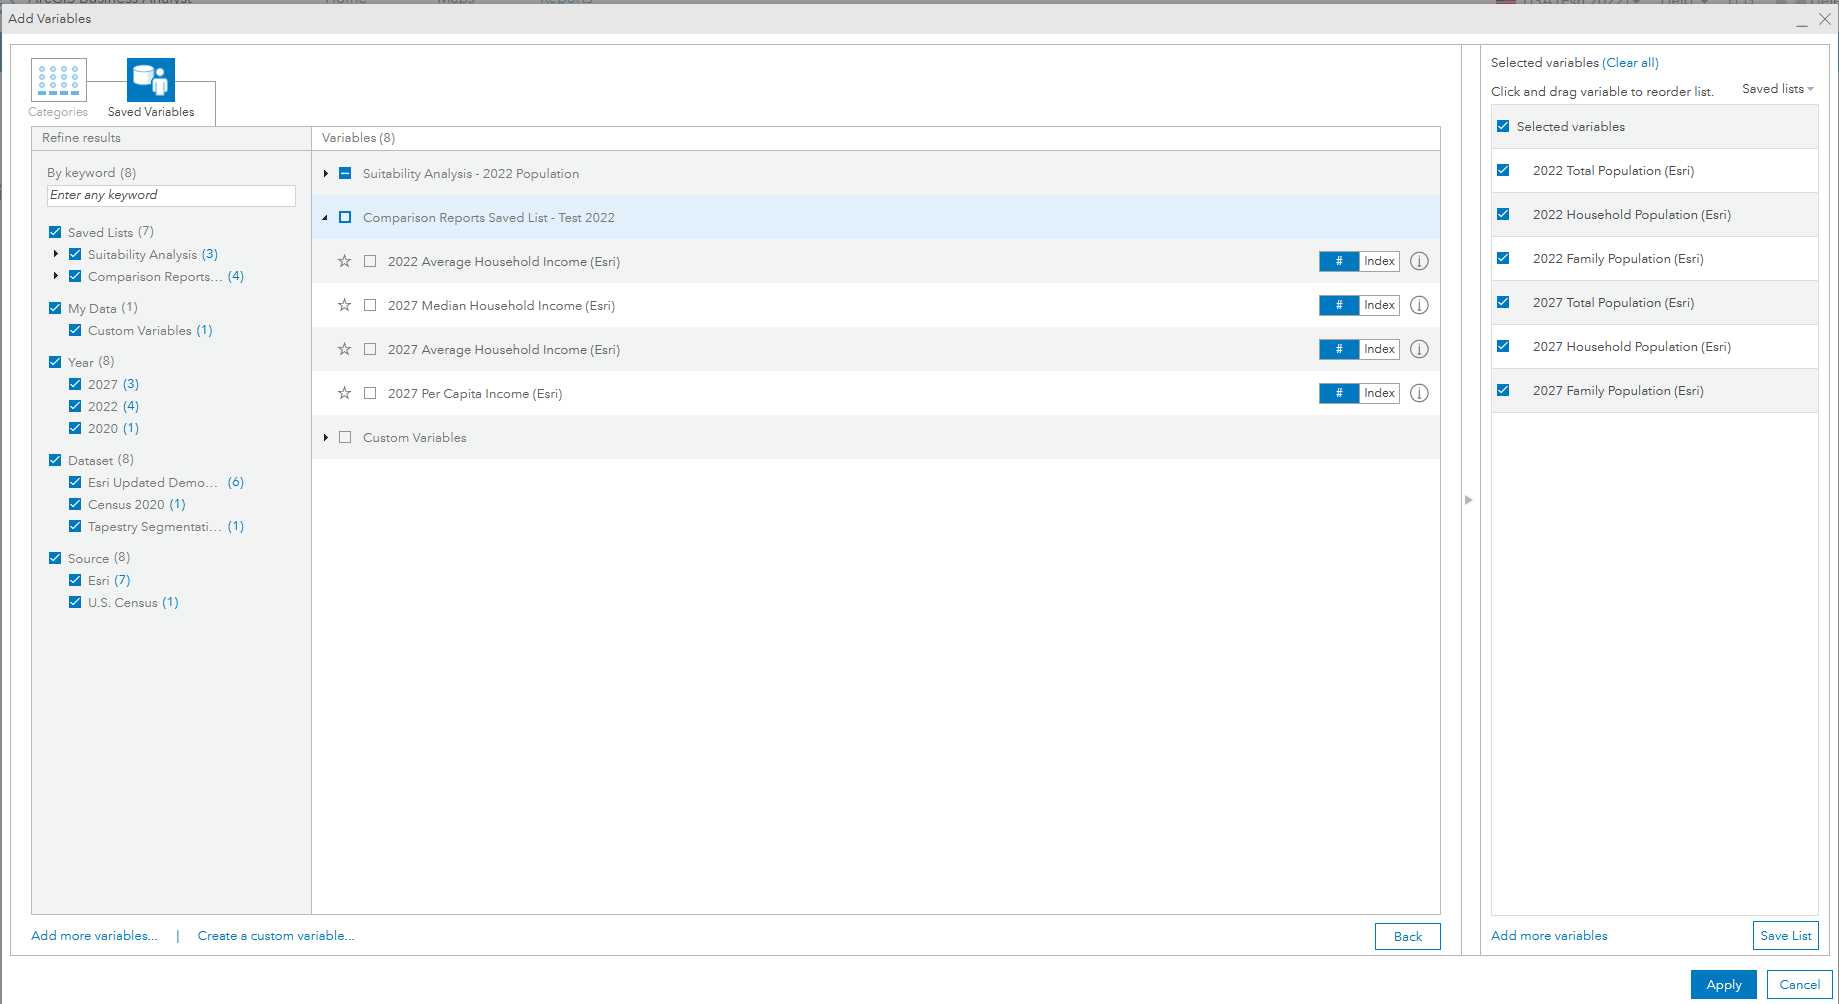
Like the other standard variable lists, Esri has migrated the comparison report templates to the new geographies. User-defined lists and shared lists are automatically migrated to the new data source, with any missing variables deleted, in the same way other variable lists are migrated. This may impact your comparison reports and charts but will not prevent them from running.
I built a lot of geographic sites using standard geographies. What happens to them?
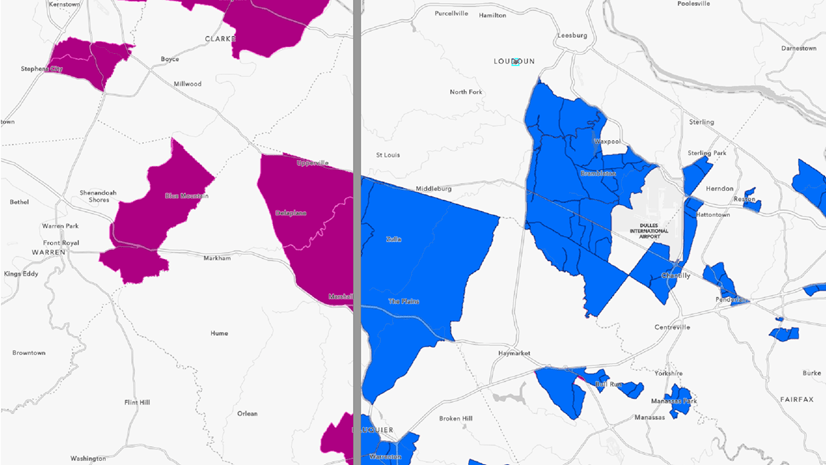
Unfortunately, there are some significant changes between the fundamental building blocks of the 2022 Esri Demographics, which are built on top of the most current Census geographies. Block groups, census tracts, ZIP codes, and even some counties have undergone change between 2010 and 2020. DMAs and CBSAs have also undergone considerable changes. Because of this, and the way geographies can be merged to create custom geographic sites, there is no way to migrate these analysis areas across different data sources and geographic boundaries.
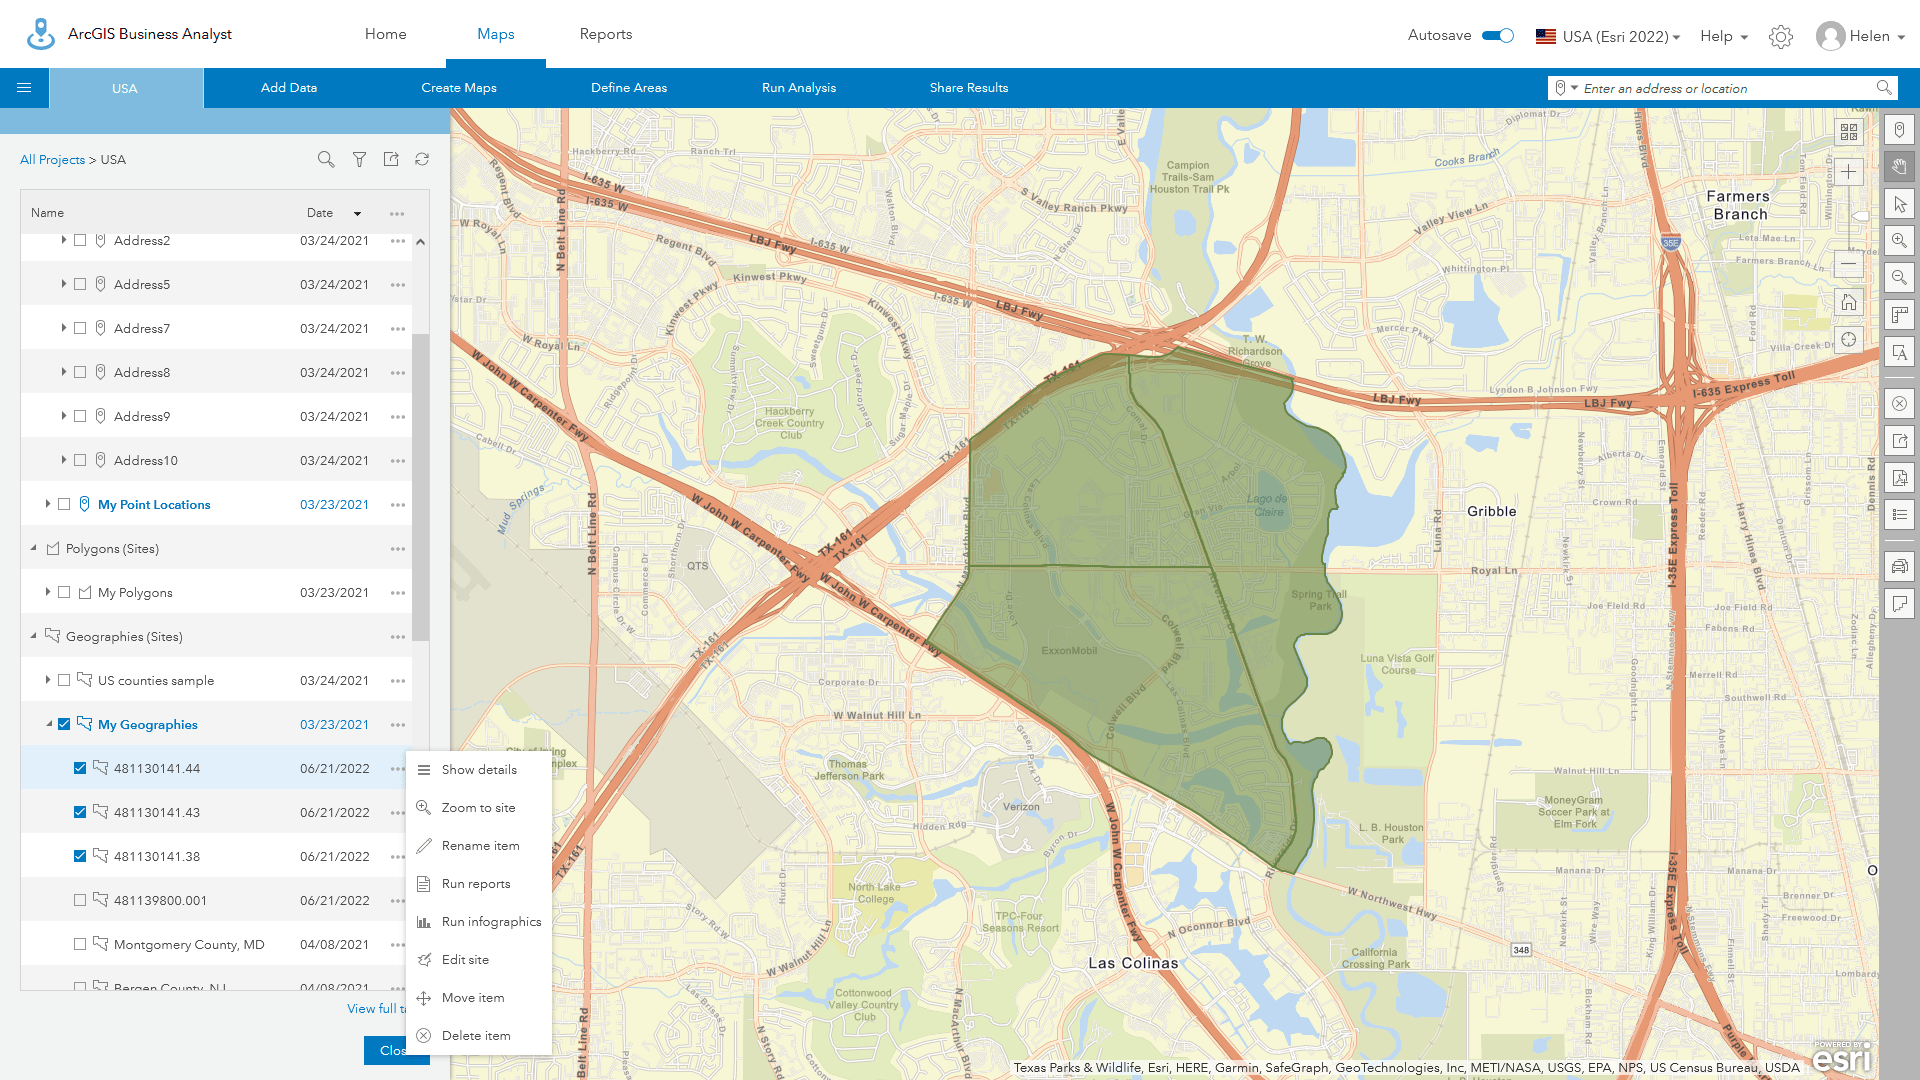
If you need to use a custom site built with standard geographies, we recommend that you share the site in ArcGIS Online, switch to the new geographic boundaries, add the site using the add web maps and data workflow, then reconstruct the geographic sites by picking the geographic building blocks from the areas available.
If you know that your site uses a particular block group or FIPS, then you can use the Edit name menu to copy the name in the 2021 data and then use Select from full list in 2022 to identify the updated features, as shown below.
Do point-based sites, threshold areas, and hand-drawn sites change?
No. Functional geographies created using analysis or drawn by hand are migrated between different data sources. You can add a site from a historic project that uses the 2021 data source, switch to 2022, and those sites will still be available. Only geographic sites, which are built from formal geographies, change with this data update.
If the geographies have changed, what happens to my custom data?
Custom datasets rely on the underlying geographic boundaries, variable lists, and block apportionment model – also known as settlement points. As these are all different between the 2021 and 2022 data sources, you must recreate any custom datasets using the new Esri 2022 data source.
Can I use infographics that contain 2021 custom data and 2022 demographics?
All infographics contain an embedded link to the original data source and vintage. Infographics that use custom datasets will generally not run properly if they use different geographic hierarchies. Due to the complex nature of how custom datasets can be built and shared, coupled with infographic sharing, it is not possible to migrate these automatically.
If you have problems running shared infographics that use custom data on functional or standard areas, please contact the infographic author and custom data creator and ask them to ensure that these have both been migrated to the Esri 2022 data source.
What happens to the reports and infographics that I have run previously?
All classic reports have been updated and migrated to 2022 Esri Demographics unless the dataset, such as Retail MarketPlace, is no longer available. Reports that use variables that are missing have been updated with alternatives or those variables have been removed.
As more ACS and Census data becomes available, we will expand and refresh the reports to incorporate newly available variables.
Reports that you have run on previous versions of the demographics will remain in your table of content, independent of which data source you are using. When running the same report on the same site for a second time, you will be prompted with a message that a report already exists.
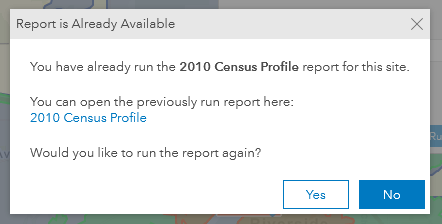
If you have switched data sources, say you use the 2022 demographics rather than 2021, you can create a new report. Both reports will be available with an incremented number or name depending on your file naming rules.
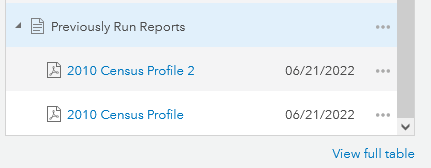
Data sources are not captured in the Previously Run Reports metadata, so it is not possible to know what reports were run on which data source without opening the report. If you want to ensure that you have the latest reports with the most recent data, we encourage you to rerun your reports using the 2022 Esri Demographics and download, then delete, the old reports using 2021 or previous vintages of data. This will avoid any confusion about data source or age and reduce the size of your online ArcGIS data storage.
Classic reports and standard infographics have been updated with new vintage and geography information in the report footer where appropriate. The examples below show two versions of the 2010 Census report, run using the same variables in different geographic hierarchies. Note the message identifying the geographic source in the Source description:

There are some big changes in this release of Business Analyst and Esri Demographics. Fortunately, these types of geographic data updates only occur with the release of each Census. The migration tools have been designed to catch more that 98% of all use cases we have investigated with users, so migrating to the 2022 Esri Demographics should be painless for most users.
We also know that there are individual situations and needs within an organization that we cannot account for. I hope that this article provides you with the knowledge you need to overcome any challenges. If not, please reach out to our technical support team, your account manager, or connect with us through the various community engagement channels.
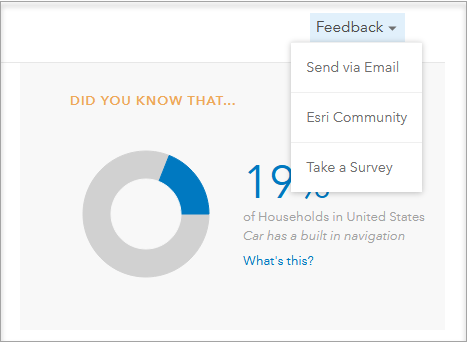
If you have comments about the content, the migration tools, and Business Analyst itself, please use the Feedback feature which you can find on the BA Web App Home page to contact us. We love hearing from you and your feedback makes us better.


Article Discussion: