In the June 2024 release, the Esri 2021 and Esri 2022 data sources were deprecated in ArcGIS Business Analyst Web App, ArcGIS Community Analyst and the ArcGIS GeoEnrichment service. This means that any analysis or published applications, such as ArcGIS Experience Builder, ArcGIS Web AppBuilder, ArcGIS Dashboards, ArcGIS StoryMaps and other applications, published via ArcGIS Business Analyst or ArcGIS Online that rely on dynamic access to these datasets, will not longer work.
Business Analyst Web App, Community Analyst and the GeoEnrichment service have been updated to provide the Esri 2023 and the Esri 2024 data sources. The Esri Updated Demographics datasets are annually updated with demographic data in the United States. Each dataset provides current-year and five-year forecasts for more than two thousand demographic and socioeconomic characteristics.
Data deprecation notices
Deprecation notices were added to the Esri 2021 and Esri 2022 data sources in the Country/Region drop-down menu in Business and Community Analyst to explain this migration and deprecation. These data sources were removed in June 2024 release. In preparation for the data deprecation, notices and blogs like this one, showed users how to clean-up sites that may have administrative boundary changes and update infographic templates with newer vintage variables.

Administrative boundary changes
Planning for any data deprecation includes cleaning up sites. Administrative boundaries may change over time because they are dynamic, reflecting changes to the underlying distribution of people, housing units, jobs, and other demographics. For instance, boundaries change due to redistricting, new incorporated areas for city boundaries, and new community development. Because of these changes, maps, reports, and analysis will not reflect the local market realities unless the boundaries are updated. The best practice is to update and refresh your boundaries with each annual release of Business Analyst data.
Administrative boundary changes impact saved sites.
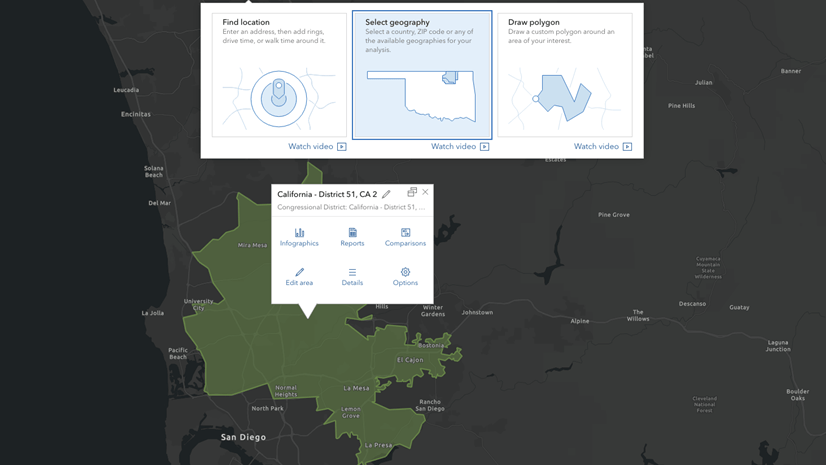
Let’s walk through an example of what it looks like if there are administrative boundary changes in your sites. Using the Esri 2023 data source, we are prompted that 9 saved geographies are not available and cannot be used. By switching to the Esri 2022 data source, we can see that there are changes in four Places (cities) and five California ZIP Codes. These geographies have changed since they were last saved in our project.

To understand what geographies are out of date, swap the data source used in the Country/Region drop-down menu to each of the historic data vintages. With each data source, look for changes in the names of saved sites. We recommend organizing sites by geographic type, such as ZIP Code, Place, or County, to quickly scan for differences. Use the Project pane to add new geography layers and name them appropriately for each geography type.
Another method to understand what geographies are outdated is to create a new layer and move the features that may need updating into it. Name this layer To sort. Switch the data source to the newest vintage (Esri 2023) and highlight the differences in sites. If there are no differences, then the sites are valid with the current 2023 administrative boundaries. Move these validated sites into a new geography layer. Name this layer Sorted.
It might seem cumbersome, but a few minutes invested in planning and organization can save many frustrating hours later.
Administrative boundary changes impact reports.
Be sure to identify, download and delete previously run reports that use these outdated sites. We recommend regularly downloading and cleaning up reports to save space, reduce credit consumption costs associated with storage, and to increase access to reports outside of Business Analyst. For instance, internally we reviewed our projects and identified over 500 historic reports across 30 projects that were created using batch reports. These reports could be deleted, freeing up over 1.5Gb of storage space.
Variables in infographics
Another way to plan for the data deprecation is to update infographics with newer vintage variables. Variables from the Esri 2021 or Esri 2022 data sources will be marked as missing after the data deprecation.
For instance, we migrated the Disaster Impact Report Gallery template, which uses the Esri 2021 data source, into our infographic builder using the Esri 2023 data source. We received two notifications to describe the missing variables.

In order to update the infographic, replace missing variables using the data browser.
Infographics in deprecated data sources
When building infographics, the custom infographics are saved under the My templates tab. Custom templates are only available within the data source used to create them. For instance, a custom infographic made using the Esri 2021 data source will not appear under the My templates tab when using the Esri 2023 data source.
With the Esri 2021 and Esri 2022 data deprecation, custom infographics made using these vintages will be unavailable after the June 2024 release. We recommend downloading custom infographics made using Esri 2021 and Esri 2022 then adding them from a file to the Esri 2023 or Esri 2024 data source.
Impact of deprecated data sources on other applications
ArcGIS Business Web App allows data and infographics to be shared and published via ArcGIS Experience Builder, ArcGIS Dashboards and ArcGIS StoryMaps. ArcGIS Experience Builder and ArcGIS Web AppBuilder also include a dedicated Business Analyst infographic widget that could be tied to older vintages of data.
Similarly, custom developed applications which use the GeoEnrichment service, ArcGIS APIs or dashboards and analysis built within any other the products and services shown below, may need to be updated because of the 2021 and 2022 data deprecation.

Resources
For more information on the data available in Business Analyst Web App, see the following resources:
- For information about the datasets included with a Business Analyst subscription, see Esri U.S. data fact sheet and Esri global data fact sheet.
- To learn about the geographic boundaries available, see Introduction to Esri demographic data.


Article Discussion: