Featured trainingNew Course | Introduction to Indoor Mapping Using ArcGIS IndoorsLearn more about the course
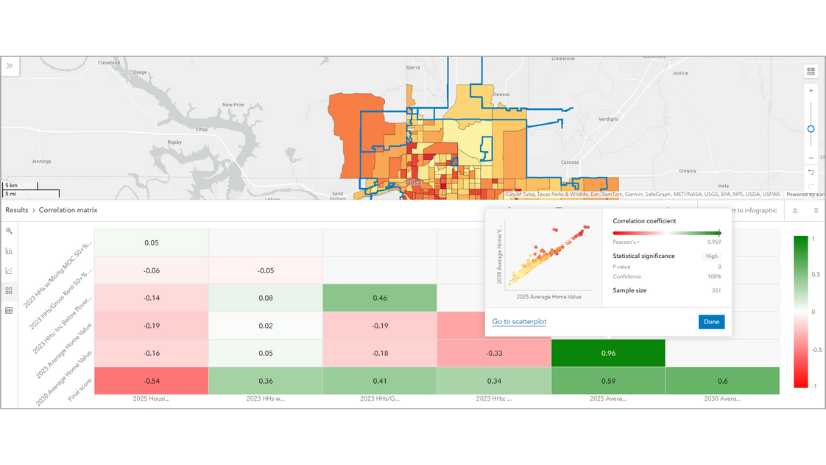
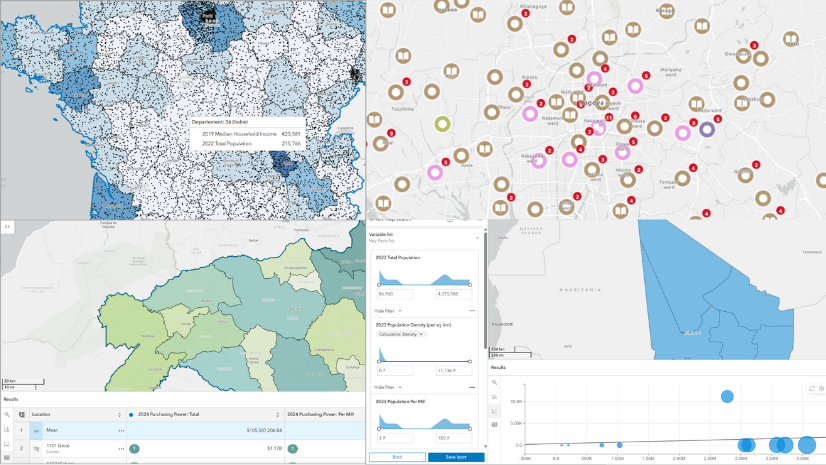
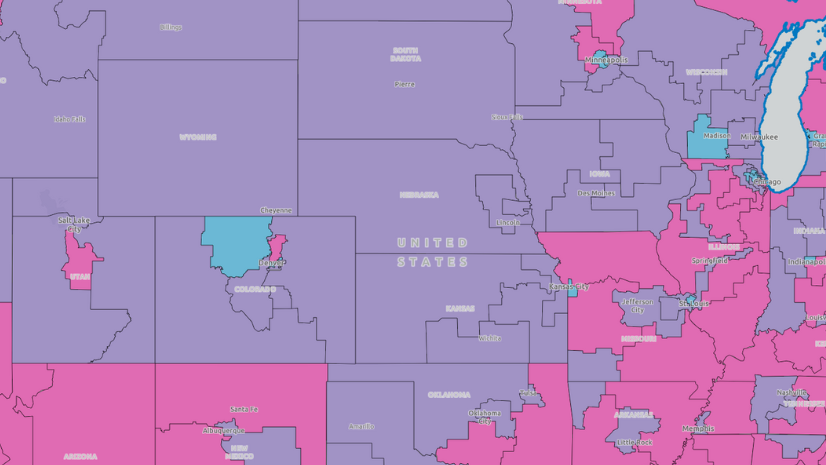
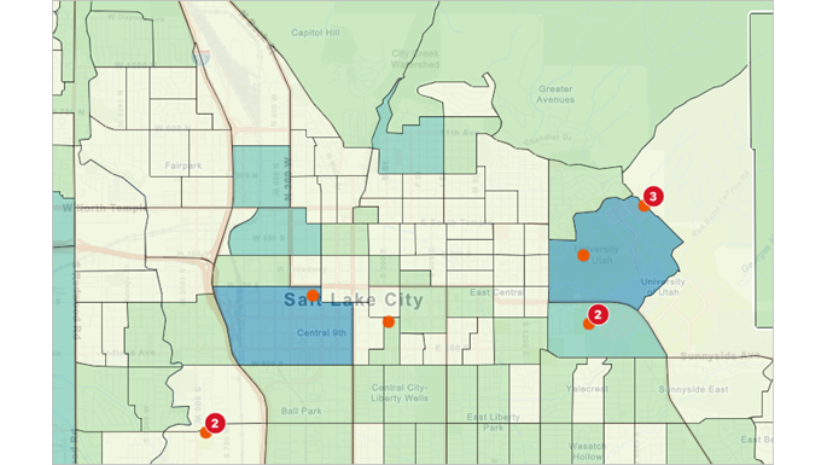
July 7, 2025 | S David | Analytics Analyze variable correlation to find suitable areas for new affordable housing using ArcGIS Business Analyst Web App
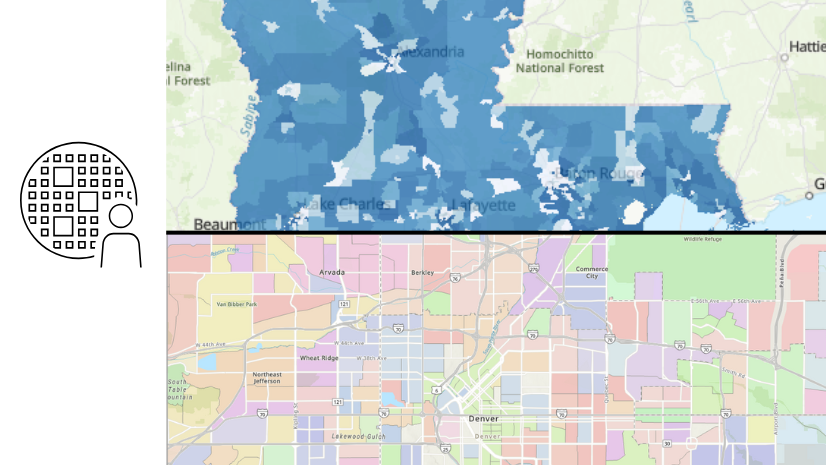
July 7, 2025 | S David | Announcements Enriching maps with ArcGIS Tapestry data in ArcGIS Pro, ArcGIS Online, and ArcGIS Location Platform
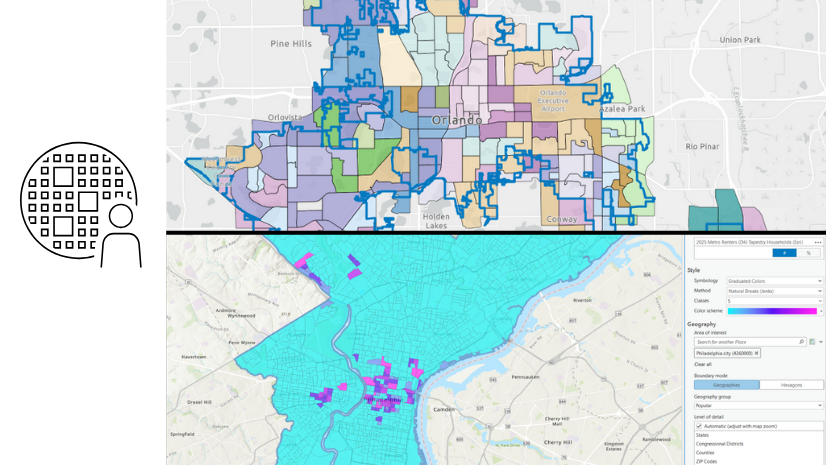
July 7, 2025 | Multiple Authors | Announcements Working with ArcGIS Tapestry data in ArcGIS Business Analyst
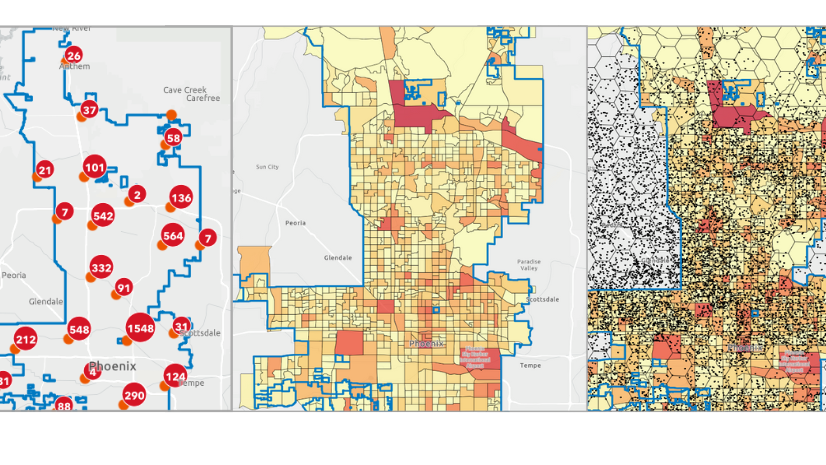
July 1, 2025 | S David | Analytics Map grocery stores to analyze food deserts using point data aggregation in ArcGIS Business Analyst Web App
June 25, 2025 | Multiple Authors | Announcements SafeGraph NAICS codes update in ArcGIS Business Analyst
June 25, 2025 | Multiple Authors | Announcements Discover the power of ArcGIS Business Analyst Web App Standard: Now included for Creator and above user types
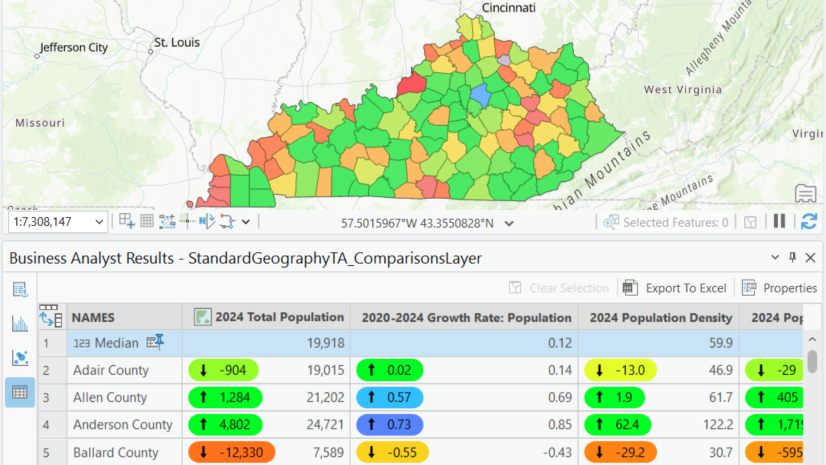
May 15, 2025 | Multiple Authors | Analytics Considerations for working with benchmark comparisons in Business Analyst Pro vs. Business Analyst Web App
February 26, 2025 | Multiple Authors | Announcements Foursquare data update in ArcGIS Business Analyst
February 20, 2025 | Multiple Authors | Administration Estimating credit consumption in Business Analyst Web App
November 22, 2024 | Multiple Authors | Announcements New tutorial: Use an AI assistant to explore the pickleball market
November 20, 2024 | Multiple Authors | Announcements Using Europe (Beta) data source in ArcGIS Business Analyst
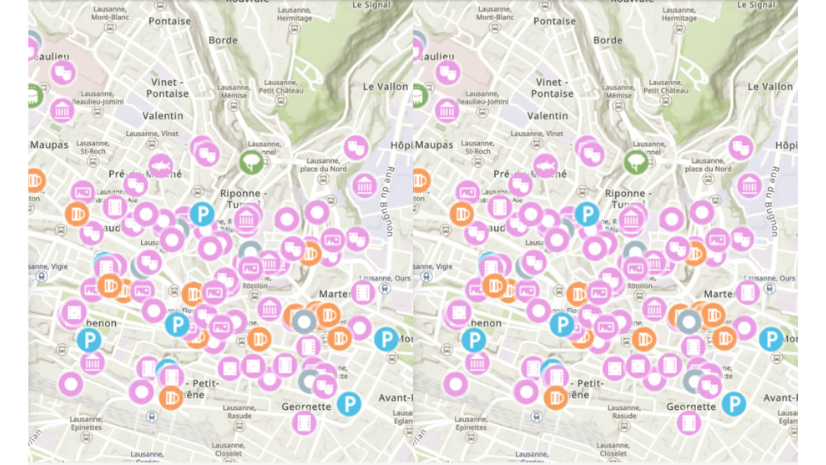
November 14, 2024 | Multiple Authors | Mapping Use new POI search capabilities to map parking and entertainment in ArcGIS Business Analyst Web App
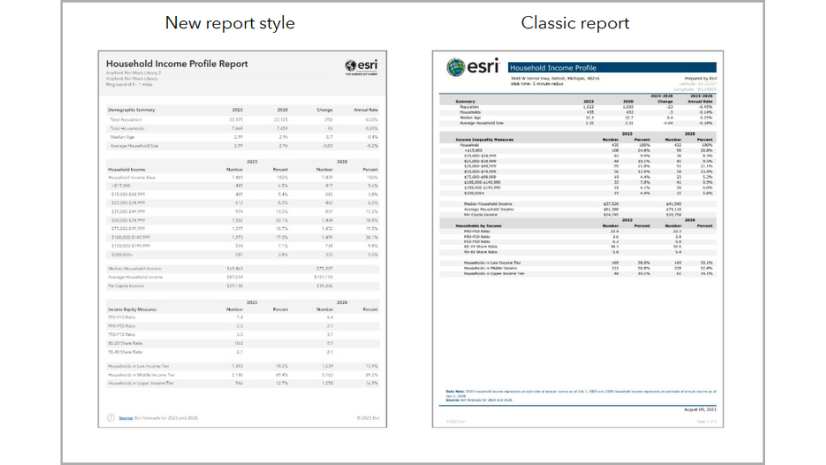
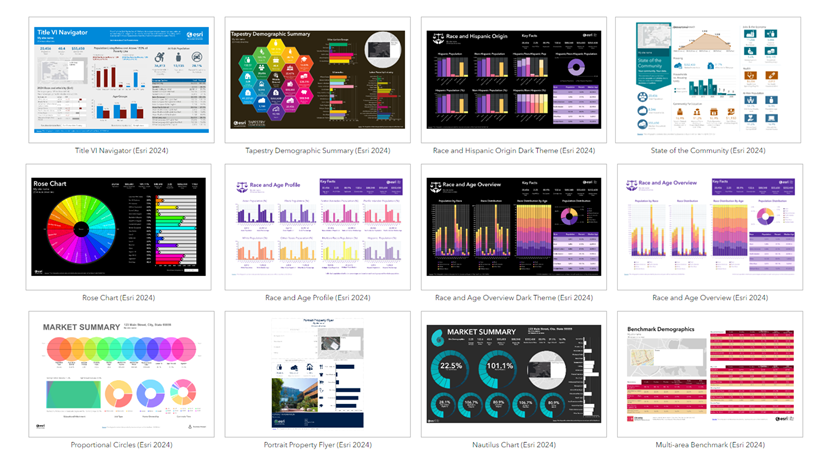
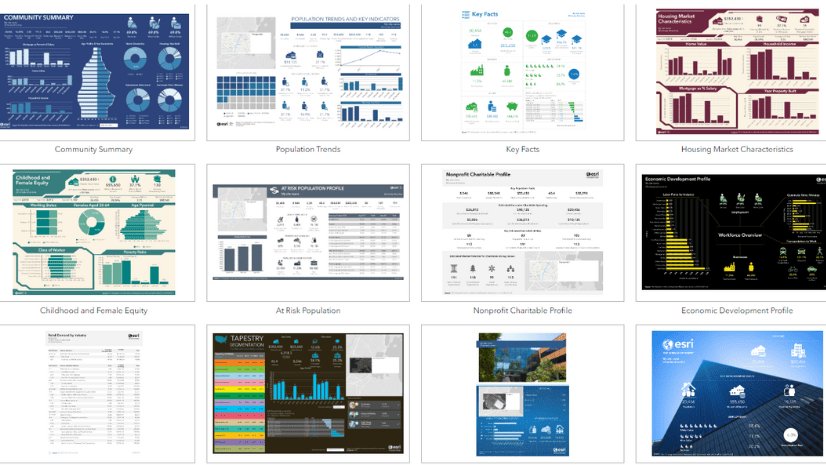
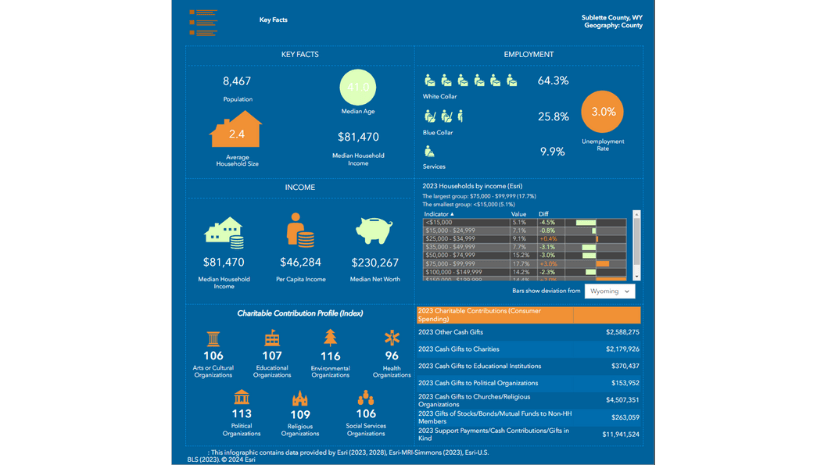
July 10, 2024 | Multiple Authors | Business Explore the infographics gallery in ArcGIS Business Analyst
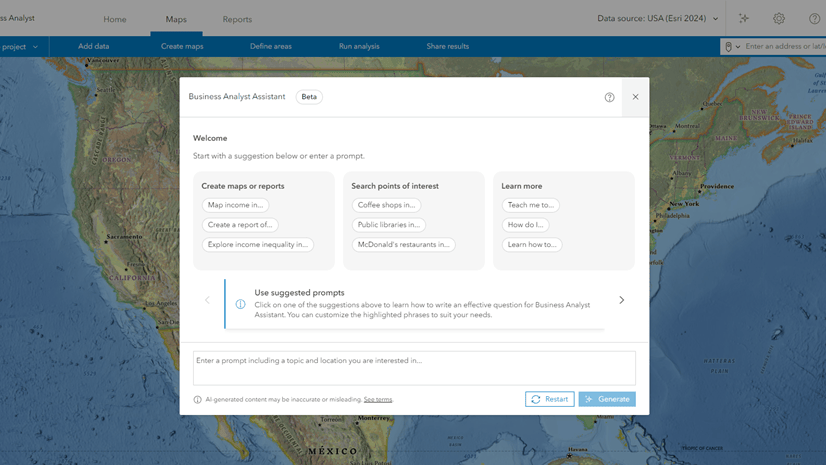
June 28, 2024 | Multiple Authors | Announcements Introducing Business Analyst Assistant (Beta) in ArcGIS Business Analyst Web App | June 2024
May 10, 2024 | Multiple Authors | Mapping Updated U.S. geographic boundaries in ArcGIS Business Analyst (June 2024)
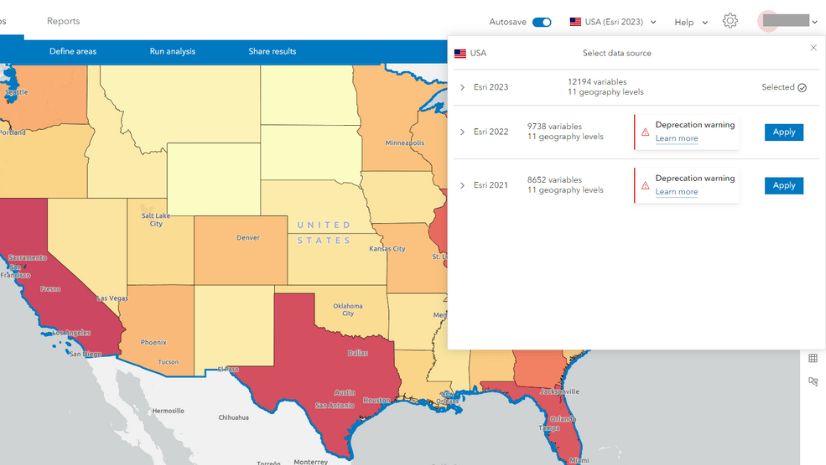
April 8, 2024 | Multiple Authors | Data Management Data deprecation in ArcGIS Business Analyst Web App, ArcGIS Community Analyst and Connected Apps (June 2024 release)
April 3, 2024 | Multiple Authors | Analytics Modify an existing infographic template in ArcGIS Business Analyst Web App and Community Analyst
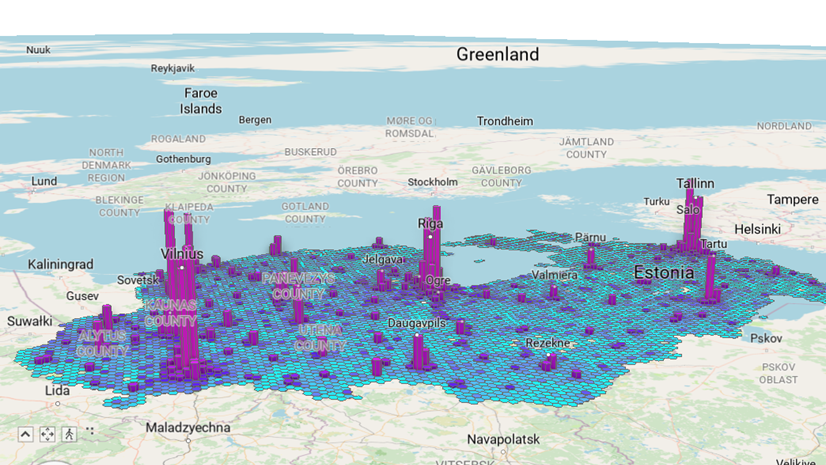
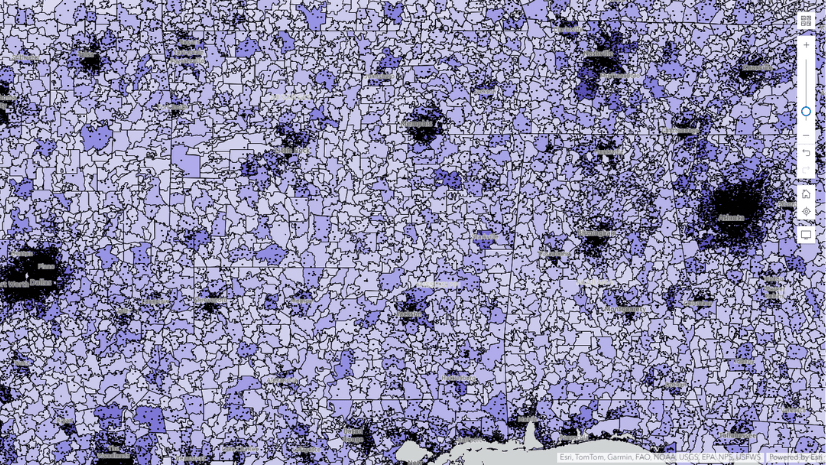
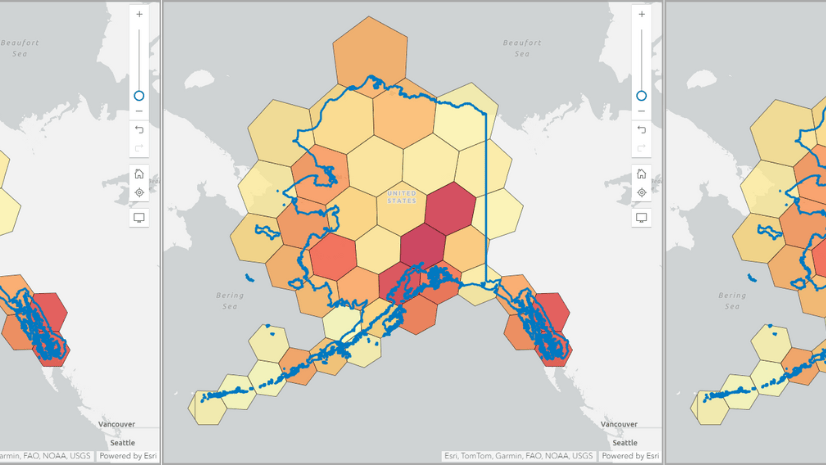
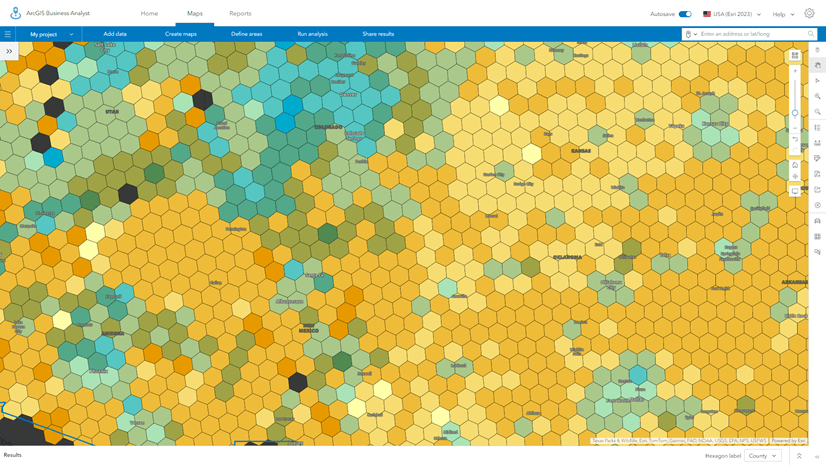
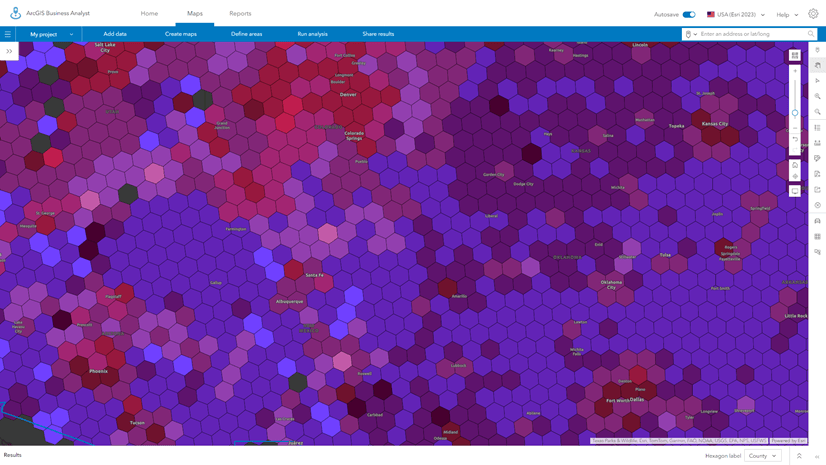
March 8, 2024 | Multiple Authors | Mapping Using hexagons in Business Analyst Web App: Proceed with caution
March 7, 2024 | Multiple Authors | Analytics An authoritative guide to hexagons in Business Analyst: Data enrichment
March 6, 2024 | Multiple Authors | Analytics An authoritative guide to hexagons in Business Analyst: Mapping and analysis