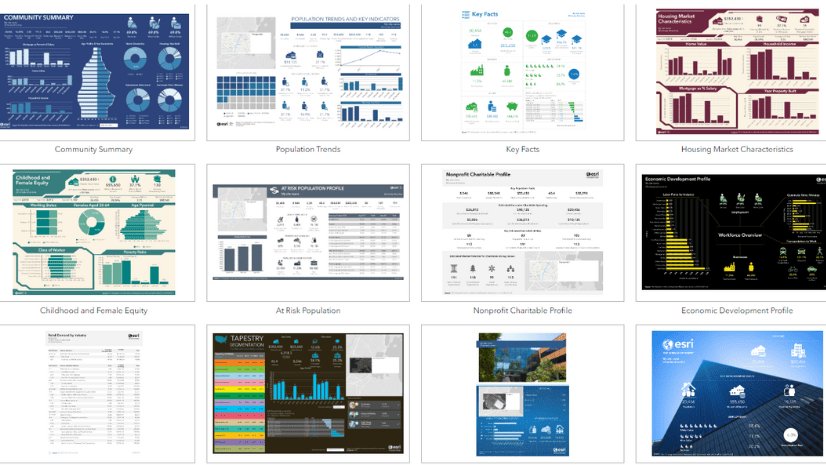
ArcGIS Business Analyst provides unique, presentation-ready infographic templates that you can use to share key data indicators for a variety of purposes, audiences, and industries. You may be familiar with Standard infographics including What’s in My Community? which groups places in a neighborhood into civic themes and At Risk Population Profile that supports businesses evaluating the impact of COVID-19 on their community.

Did you know that there are additional premade templates in the infographics gallery? The gallery is a collection of infographic templates designed for specialized goals, some of which use premium data sources from global partners such as Esri Japan and Esri France. These templates are open to enhancement based on feedback.

What is the ArcGIS Business Analyst infographics gallery?
The ArcGIS Business Analyst infographics gallery is a collection of templates designed for a particular dataset or country. Many of the available gallery templates have been created by Esri partners, such as users, and Esri teams like Sales or Professional Services. These types of infographics are created on an as-needed basis, driven by requests and opportunities that we learn about through conversations with Business Analyst customers.

How can I access templates in the gallery?
The gallery templates are configured in ArcGIS Business Analyst Web App. They can be run from a variety of Business Analyst products, such as Web App, Mobile App, ArcGIS Pro extension, or through the GeoEnrichment API.
To open a template from the gallery, go to the Build reports tab and click Build infographics. Then, click the Gallery tab. Explore the curated gallery of infographics and click Open to open the template and make any modifications. Feel free to customize ArcGIS Business Analyst infographics to better suit your business needs. Then, you can save and rename the infographic. It will be saved under the My templates tab, where it is available for you to run. Gallery templates are customizable in edit mode.

To refine the gallery template collection, click the Filter button. You can filter the gallery templates by category. To see results for only one category, click the Hide others button.

What data sources do templates in the gallery use?
Templates in the gallery are updated with each vintage release. The templates that appear in the gallery depend on which data source you have selected. New templates are added to the gallery as they become available and are added to the most current vintage.
Template migration
Multiple vintages of data are available in the gallery. Users can migrate between vintages to ensure that the infographic template is using the most up-to-date variables. You can choose a particular data source using the Click for data source selections button in the Data source drop-down menu.

Changing the data source will result in an updated gallery collection that has templates using that specific vintage. For instance, the template Key Facts 6 Part Gauge is available in the USA Esri 2023 data source, but not in USA Esri 2024. To run Key Facts 6 Part Gauge using Esri 2024 data, click Open to open the template, then click Save to add it to the My templates tab. Then, click Download this template as a file.

Change the data source to USA Esri 2024 using the Data source drop-down menu. Then, click Add template from file.

When you add the template, you may get a notification that the template uses variables that are not available in the currently selected data source. Clicking Yes will replace the 2023 variables with 2024 variables. Once you give the template a new name and save it, it’s now available for you to run from My templates.

Premium data sources
Business Analyst Web App is supported in six different languages, including English, French, Japanese, German, Portuguese, and Spanish. This allows the numeric and currency formats in infographics to automatically adjust depending on the language setting in your browser. We are continuing to work with our global partners to add translated versions of these templates in the future for wider use. These international templates represent an exciting opportunity for us to extend support for users all over the world in multiple languages.

What infographics do you need?
We welcome your feedback! The infographics gallery serves as a space for the Business Analyst development team to explore enhancements. What types of infographic topics would be useful for your workflows? Please share your recommendations for new infographic templates with our team. Or, if you create your own template, reach out to us about adding it to the gallery. Please use the feedback option at the bottom of this blog article or post on Esri Community.
Article version history:
- This article was originally published on December 22, 2022.
- It was updated on February 29, 2024.
- The most recent update was on July 10, 2024.


Article Discussion: